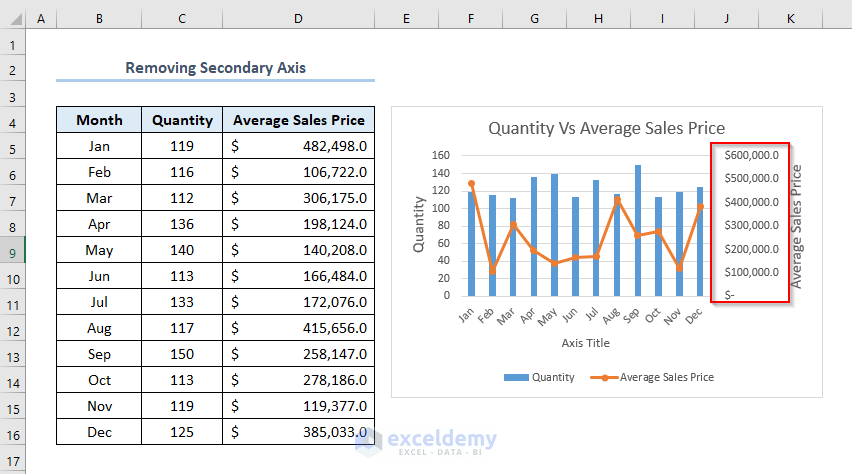
Compare the Quantity column and Average Sales Price columns. Min and Max values in the Quantity column are 112 and 150, whereas Min and Max values in the Average Sales Price column are 106722 and 482498.
As there is a big difference between these two data series, it would be difficult to understand the smaller values in a chart.
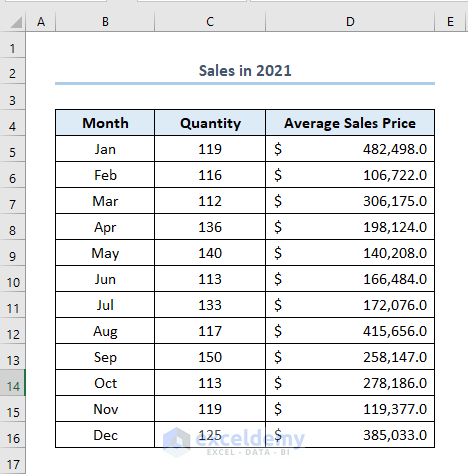
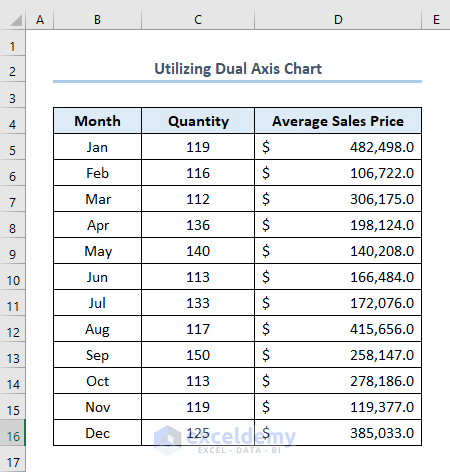
The sample dataset showcases Sales in 2021 and contains data on Month, Quantity and Average Sales Price.
Method 1 – Using Dual Axis Chart First
Steps:
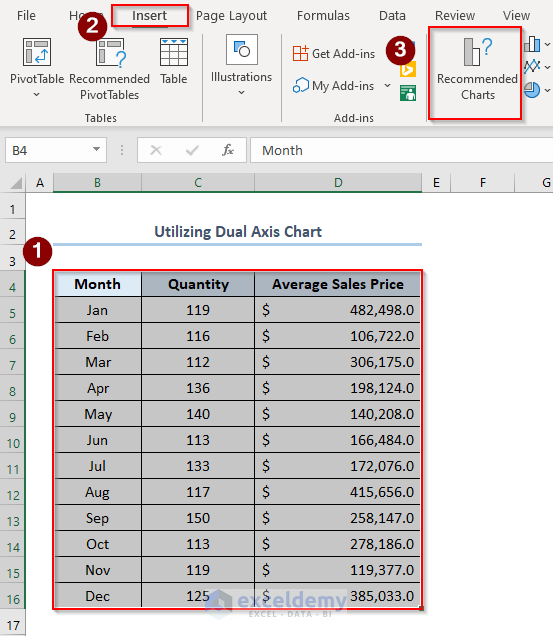
- Select the whole data, or a cell in the dataset.
- Go to the Insert tab > click Recommended Charts in Charts.
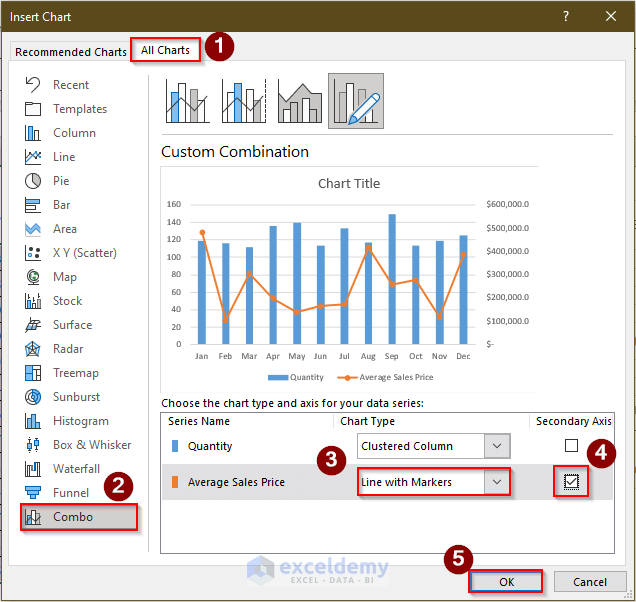
- In the Insert Chart dialog box, choose All Charts
- Choose Combo.
- In Series Names, choose Line with Markers for the Average Sales Price data series and check Secondary Axis.
- Click OK.
The chart is displayed with a secondary axis:
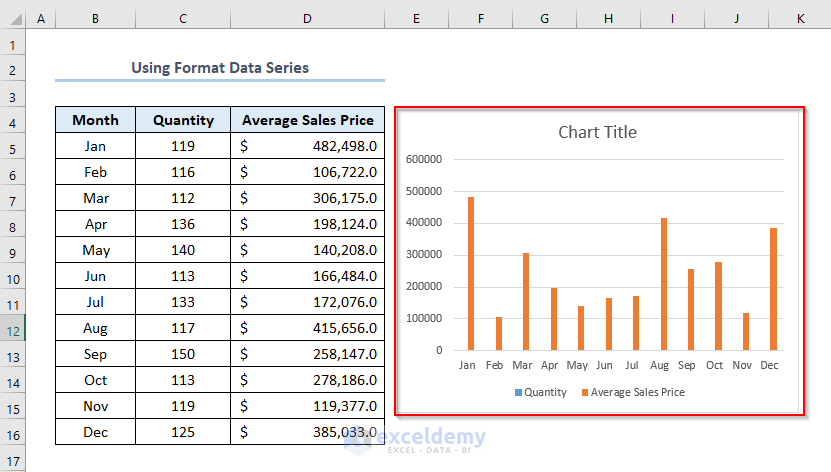
Method 2 – Utilizing the Format Data Series Option
This is the Column Chart created using the dataset below:
To add the secondary axis: Average Sales Price:
Steps:
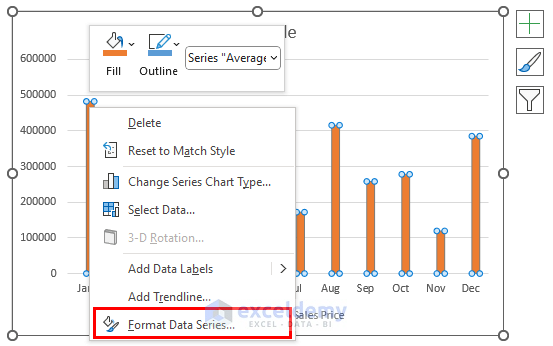
- Right-click any of the bars in the chart.
- Go to Format Data Series.

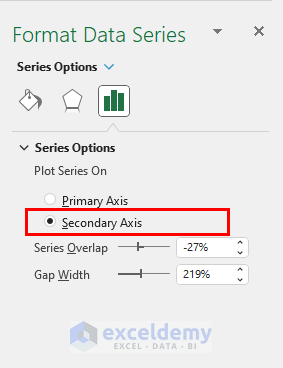
- In the Format Data Series window, select Secondary axis.
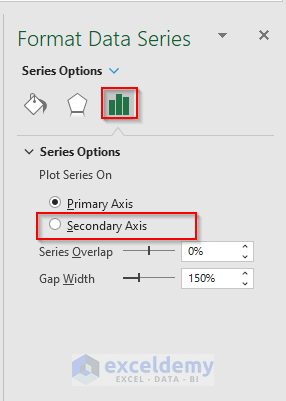
- A Secondary Axis is added.
- Name the Axis Title: Average Sales Price.
Read More: How to Hide Secondary Axis in Excel Without Losing Data
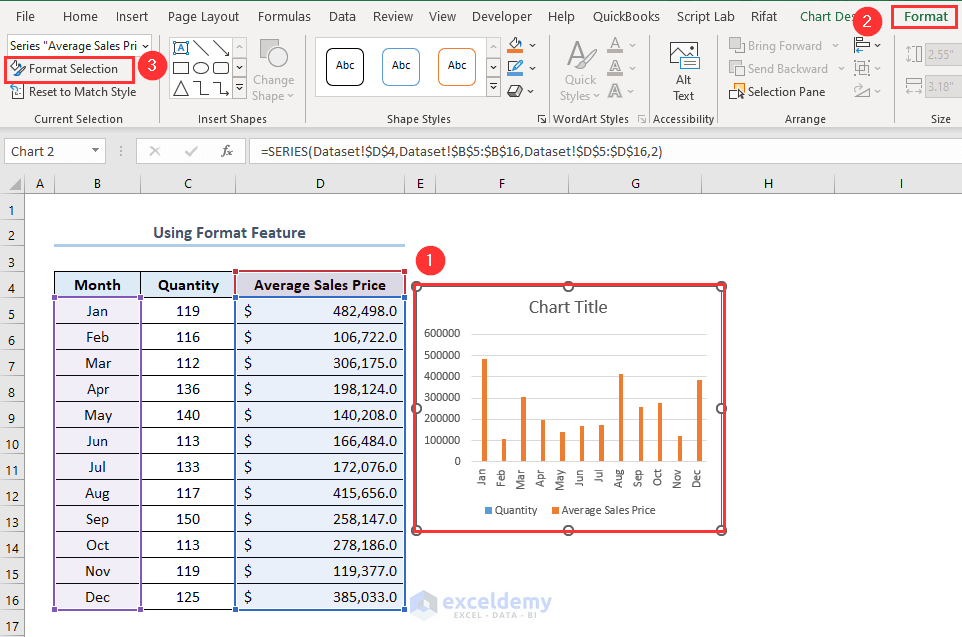
Method 3 – Changing the Chart Type
You have a Pie Chart based on the following dataset.
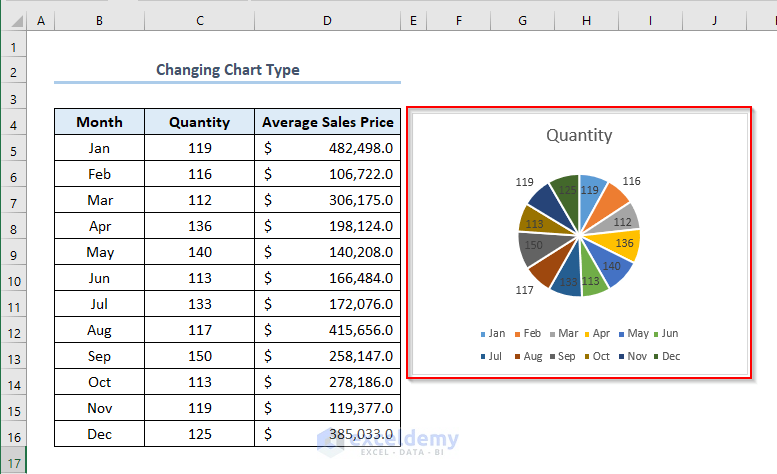
The Pie Chart doesn’t have the option of adding a secondary axis.
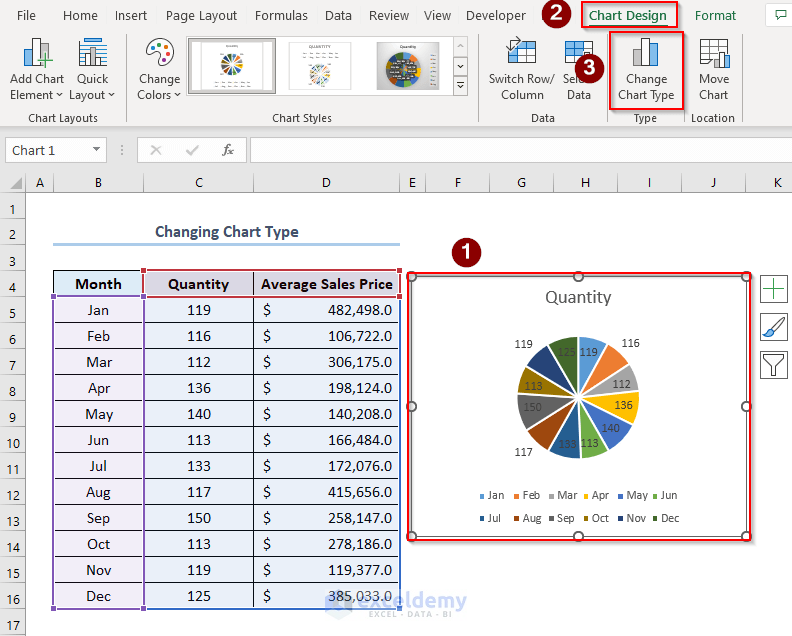
Steps:
- Click the chart > go to Chart Design > select Change Chart Type.
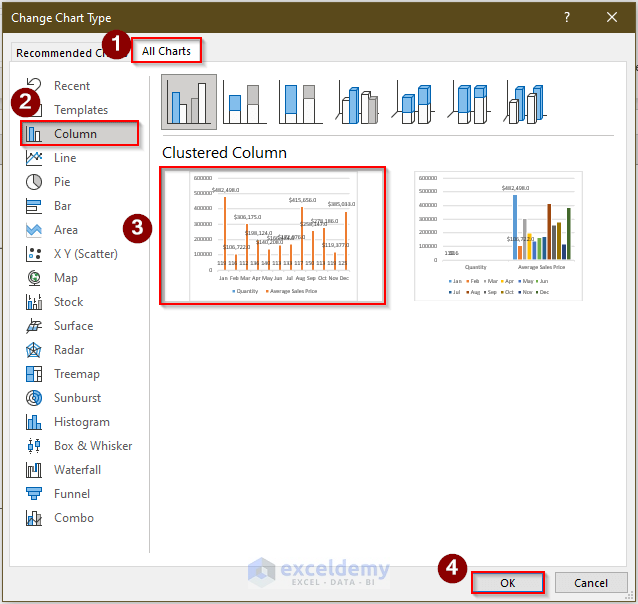
- In the Change Chart Type window, go to All Charts > select Column > choose the Clustered Column chart shown below > click OK.
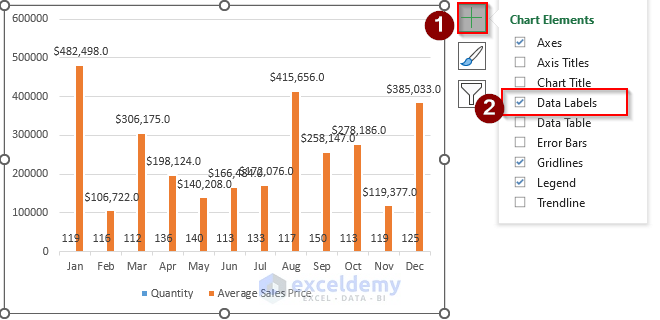
You’ll see the Column Chart with Data Labels.
- To remove Data Labels, select the chart > click Chart Elements > uncheck Data Labels.
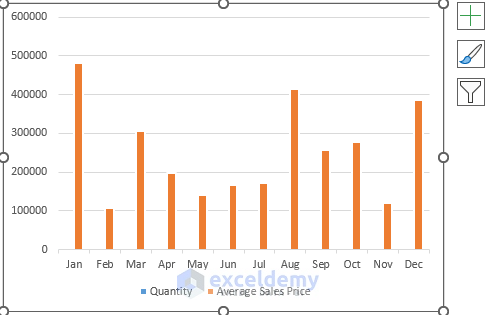
The chart is displayed without Data Labels.
- Right-click a bar > select Format Data Series.
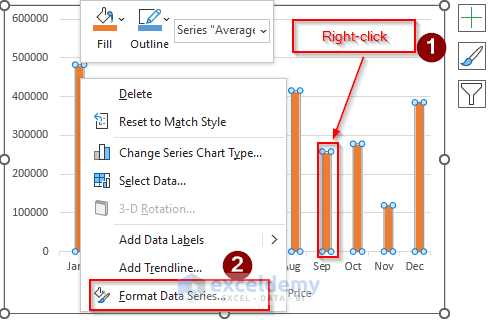
- In the Format Data Series window, select Secondary Axis.
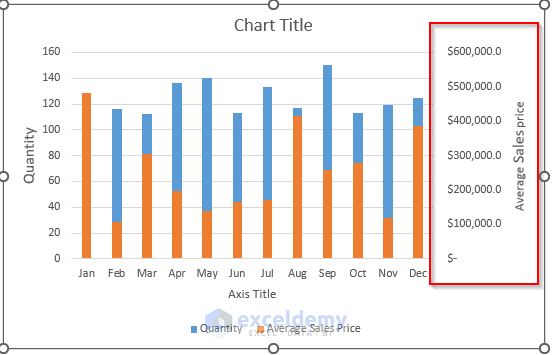
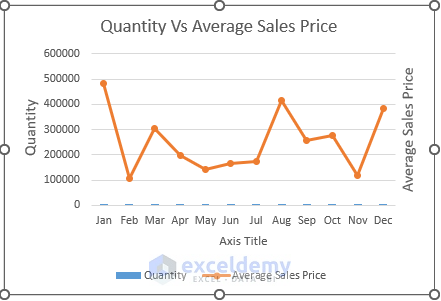
This is the chart with the secondary axis:
How to Remove the Secondary Axis
- Click the secondary axis.
- Press DELETE.
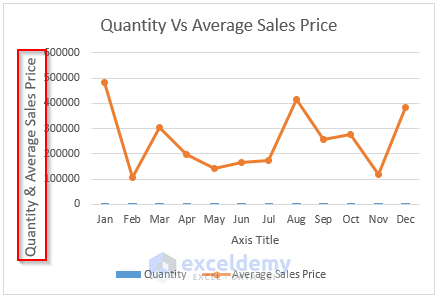
This is the output.
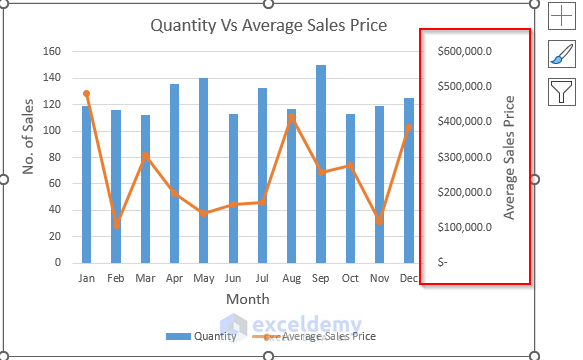
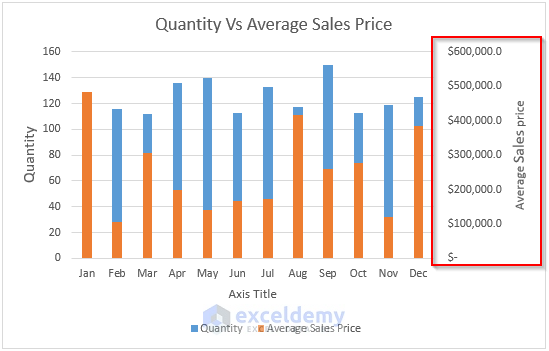
- Delete the Axis Title: Average Sales Price.
- Change the Axis Title to Quantity Vs Average Sales Price.
How to Add a Secondary X Axis in Excel
Steps:
- Right-click a bar in the chart > go to Format Data Series.
- Select Secondary Axis.
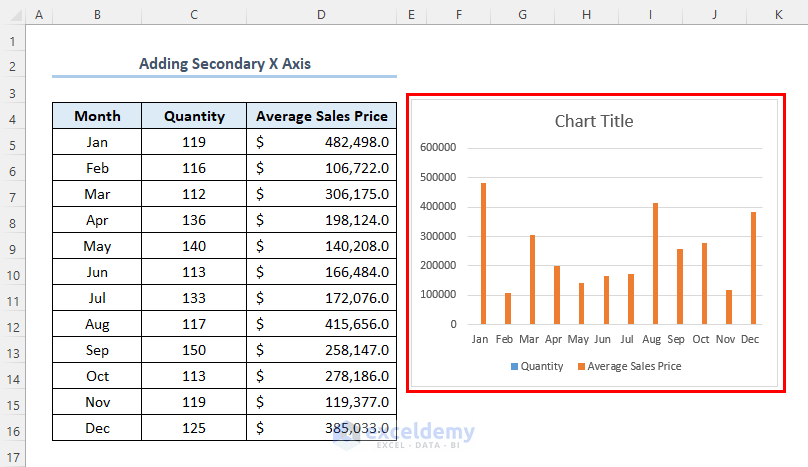
- Click the chart > select Chart Elements > click Axes > select Secondary Horizontal.
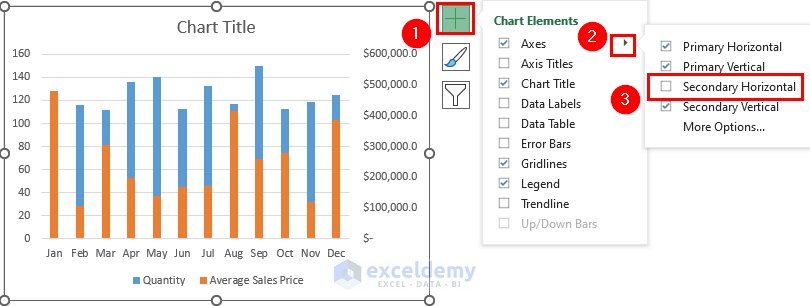
A secondary X axis is added.
- Name the Chart Title: Month.

Read More: How to Combine Graphs with Different X Axis in Excel
Download Practice Workbook
<< Go Back To Secondary Axis in Excel | Excel Charts | Learn Excel
Get FREE Advanced Excel Exercises with Solutions!

thanks, great job.
Hello Ahmed,
You are most welcome. Thanks for your appreciation it means a lot to us. Keep learning Excel with ExcelDemy!
Regards
ExcelDemy