Dataset Overview
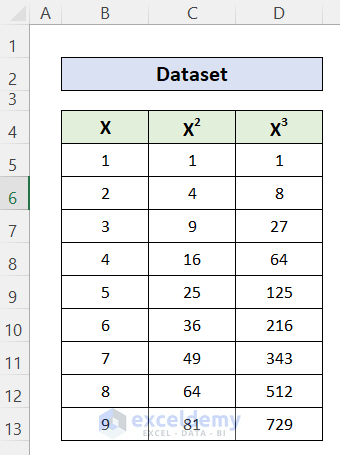
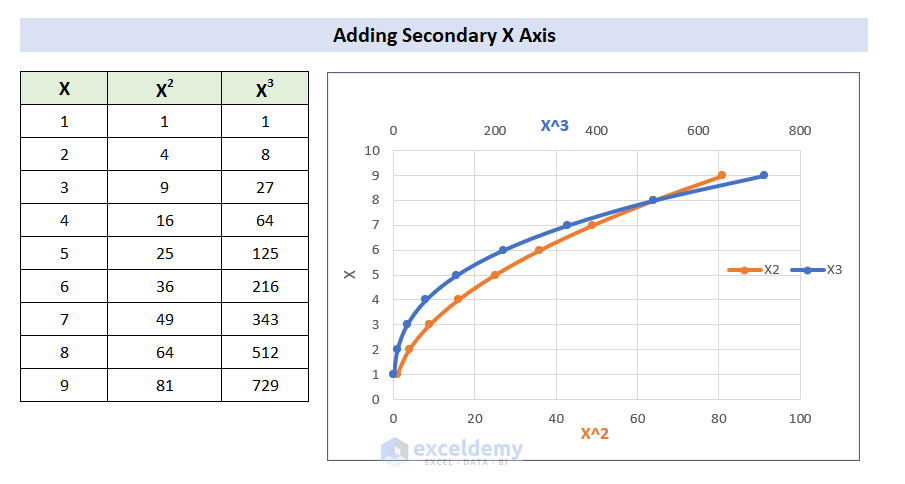
When working with data in Excel, you might need to create a chart that displays two different sets of values on separate X-axes. For instance, suppose you have a dataset showing the values of the 2nd and 3rd powers of numbers, and you want to plot a graph illustrating their patterns. Additionally, you want to display X² values on the primary horizontal axis and X³ values on the secondary horizontal axis.
Step 1 – Create a Scatter Chart in Excel
- Prepare Your Data:
- Organize your data in two columns: one for X² values and another for X³ values.
- Make sure the data is ready for plotting.
- Insert a Scatter Chart:
- Select the data range.
- Go to the Insert tab.
- Choose the Scatter chart type.
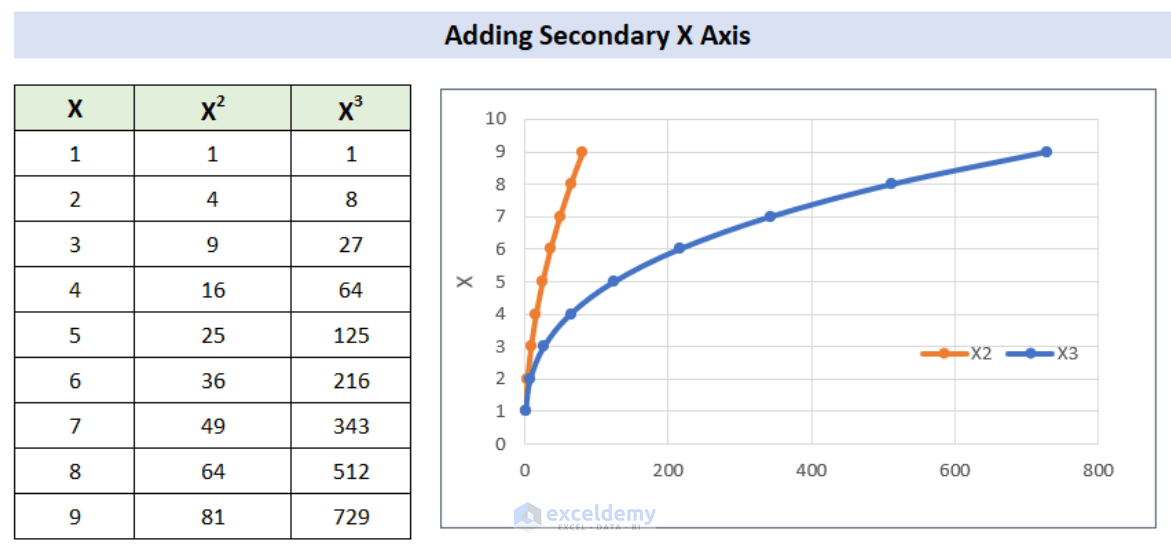
- Customize the Scatter Chart:
- Your scatter chart will now display both series of data.
Step 2 – Enable the Secondary Horizontal Axis
- Select the Chart:
- Click on the scatter chart to activate it.
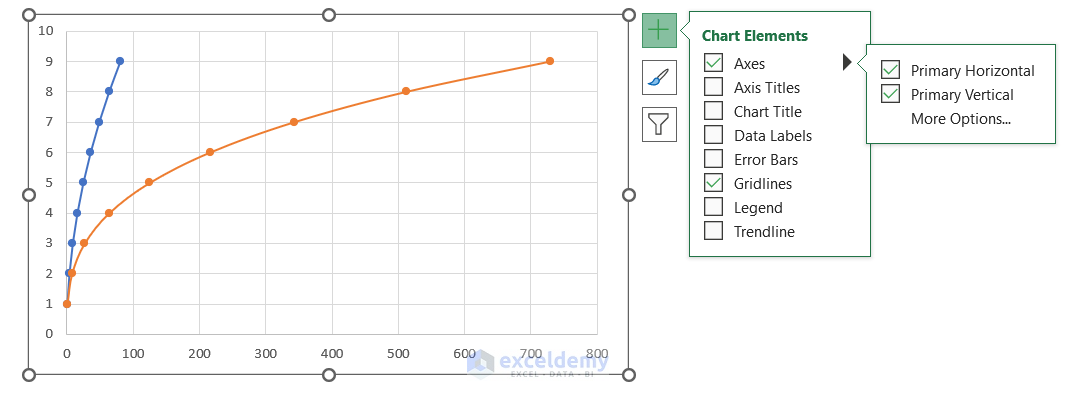
- Access Chart Elements:
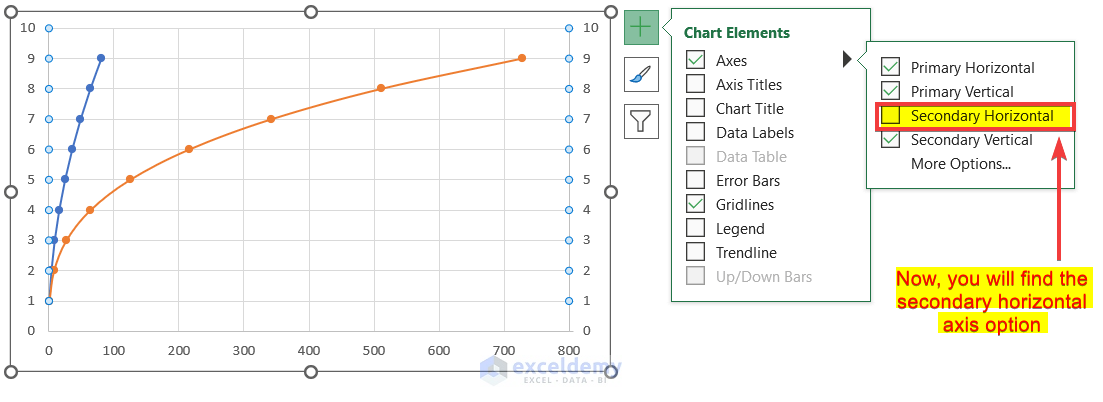
- Look for the plus (+) icon that appears on the top-right corner of the chart.
- Click it to reveal the chart elements.
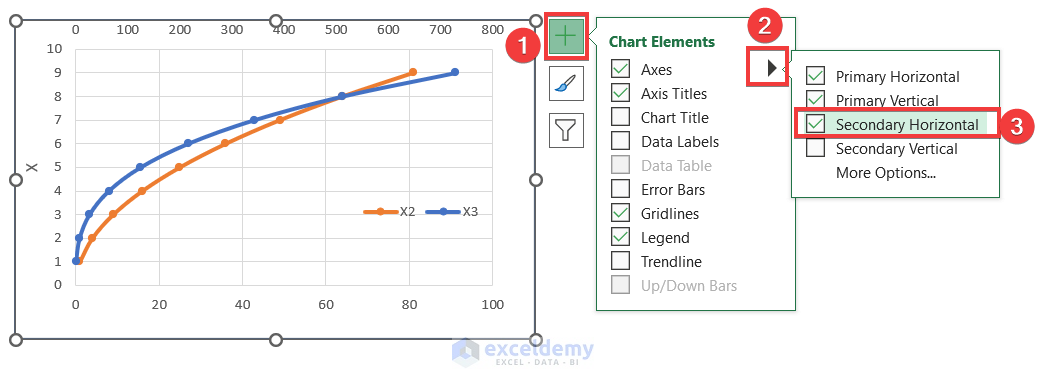
- Enable the Secondary Horizontal Axis:
- Within the chart elements, locate the Axes box (usually marked by default).
- Click the arrow next to Axes to expand the options.
- Check the box for Secondary Horizontal Axis to enable it. This will display the secondary X-axis on your chart.
Read More: How to Add Secondary Axis in Excel
Step 3 – Add Axes Titles to the Secondary X Axis
- Access Chart Elements Again:
- Click on the scatter chart to activate it.
- Look for the arrow next to Axis Titles.
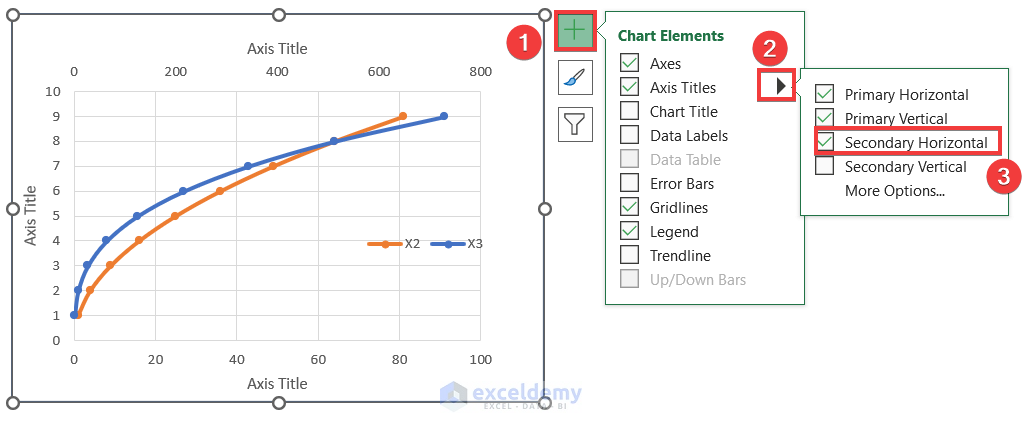
- Add Titles to the Secondary X-Axis:
- Click on the Secondary Horizontal option to add axis titles.
-
- Rename the axis titles as needed.
Read More: How to Combine Graphs with Different X Axis in Excel
Troubleshooting – Excel Not Showing Secondary Horizontal Axis Option
If you don’t see the option to add a secondary horizontal axis, follow these additional steps:
The screenshot below serves as an example of a situation where secondary horizontal axes option is unavailable.
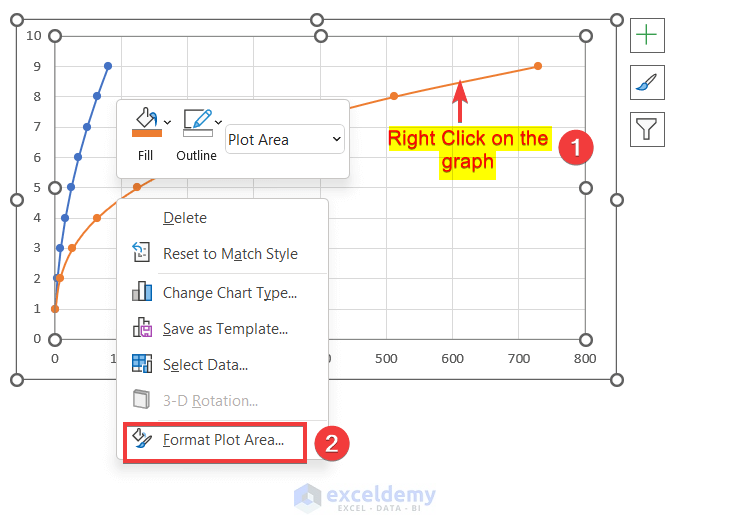
- Enable Secondary Axes Manually:
- Right-click on one of the data series in your chart.
- Select Format Plot Area.
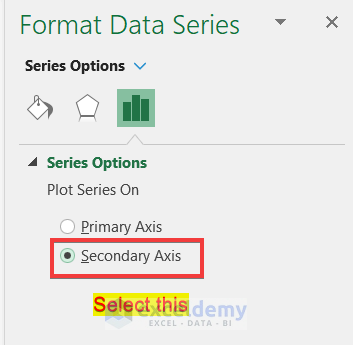
- In the Format Data Series window, choose the Secondary Axes option under Series Options.
- This will enable the secondary vertical axis.
- Access Axes Options Again:
- Go back to the chart elements.
- You should now find the secondary axes options available.
Read More: How to Hide Secondary Axis in Excel Without Losing Data
Download Practice Workbook
You can download the practice workbook from here:
<< Go Back To Secondary Axis in Excel | Excel Charts | Learn Excel
Get FREE Advanced Excel Exercises with Solutions!

Thanks for this tutorial. How can I enable a secondary horizontal axis on an Excel chart embedded in a PowerPoint slide? The option to click on that “plus sign” on the top right corner of the chart does not seem to exist.
Thank you PAULO GIOLO, for your query. Yes, I have just checked and found there is no issue to
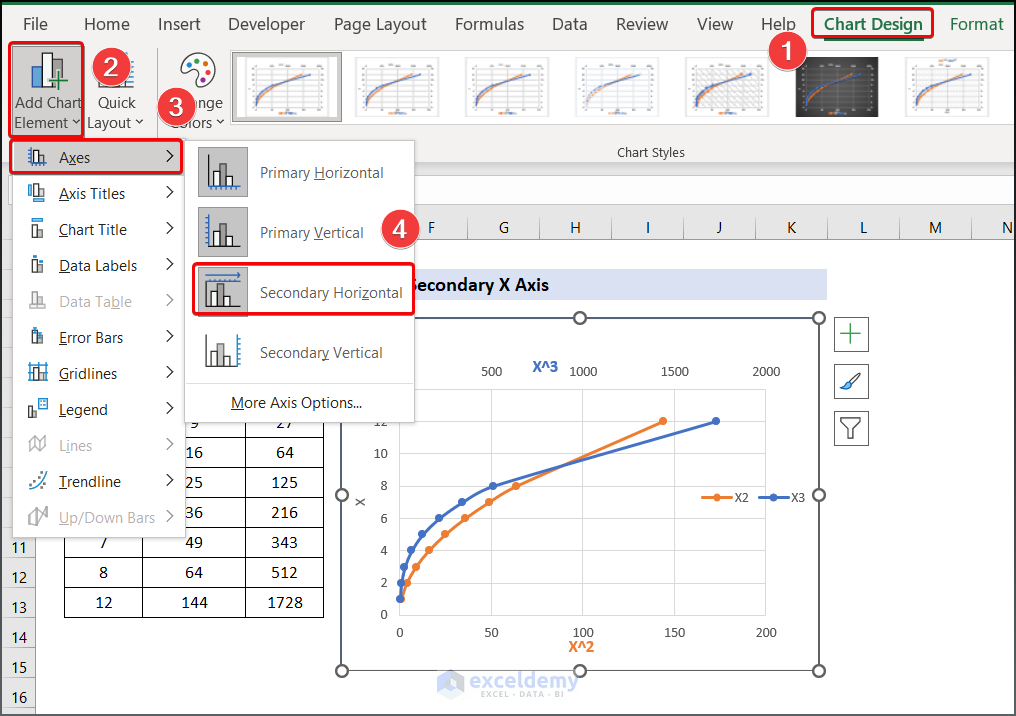
enable the secondary axis which is embedded in the PowerPoint slide. If you are missing plus sign in your chart, there is an alternate way that has been illustrated by the image below.
However, if there is no secondary horizontal axis option in the Chart Elements, then follow this part of the article. https://www.exceldemy.com/add-secondary-x-axis-in-excel/#Excel_Not_Showing_Secondary_Horizontal_Axis_Option
Hope this will work for you. If you have further queries, feel free to ask.
Regards
Mohammad Shah Miran
Team ExcelDemy