Method 1 – Use Excel Bar Chart to Create Progress Bar Based on Another Cell
STEPS:
- Select Cell D5 and type the formula below:
=1-C5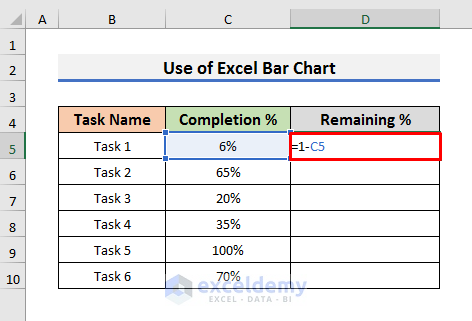
- Press Enter to see the result.
- Drag the Fill Handle down.
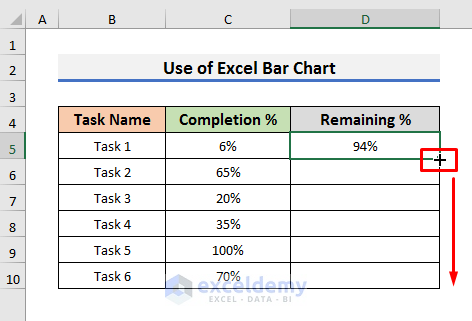
- You will see results like the picture below.
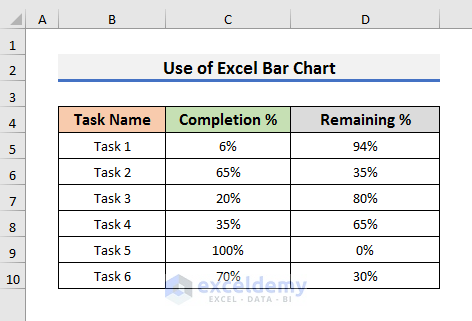
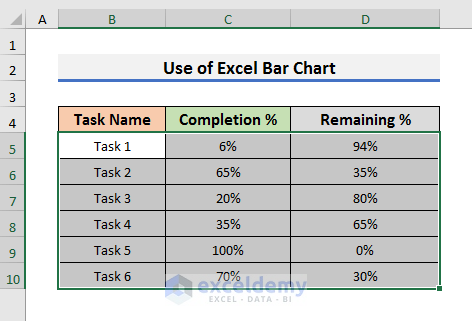
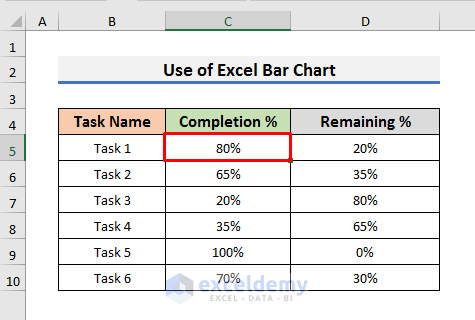
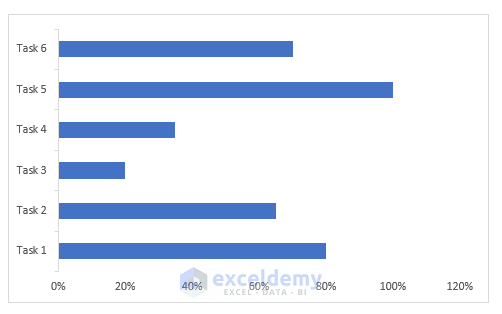
- Select the range B5:D10 in the dataset.
- Select the Task Name, Completion %, and Remaining %.
- Go to the Insert tab and select Bar Chart from the Charts section. A drop-down menu will appear.
- Select Stacked Bar from the 2-D Bar section.
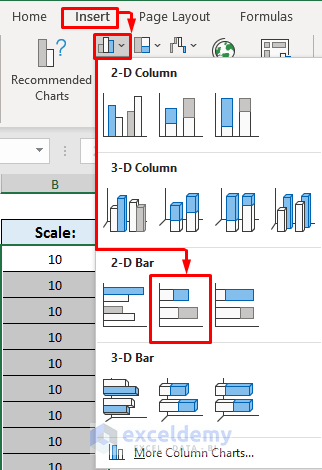
- A 2-D Bar Chart will appear on the Excel sheet.
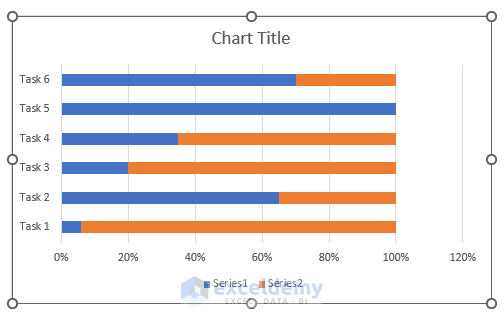
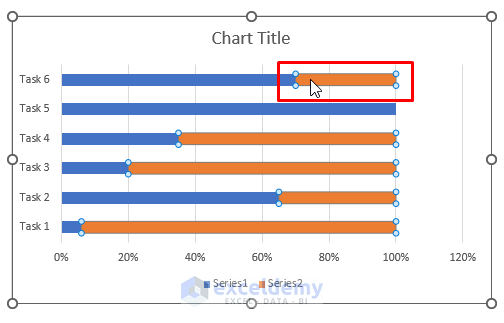
- Click on the orange part of a bar like the picture below.
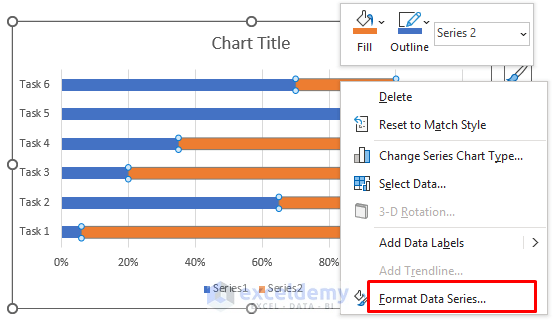
- Right-click on the orange part. A drop-down menu will appear.
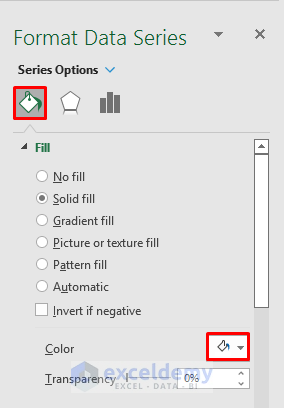
- Select Format Data Series from there.
- Open the Format Data Series settings on the right side of the sheet.
- Click the Fill icon and fill the bar with a Solid White Color.
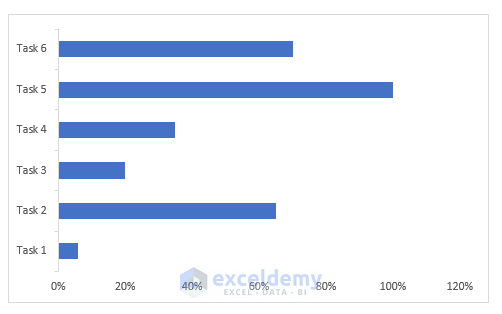
- After changing the color of the orange part to white, the progress bars will be like the one below.
- Click on the plus (+) icon and deselect Chart Title, Gridlines, and Legend.
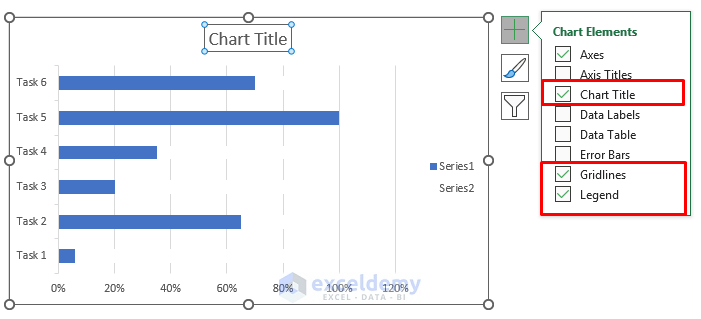
- The progress bars will look more understandable.
- To test the progress bars, we changed the value of Cell C5 to 80%.
- The progress bar of Task 1 will change like the picture below.
Method 2 – Make Progress Bar Based on Another Cell with Conditional Formatting
STEPS:
- Select Cell E5 and type the formula below:
=1-D5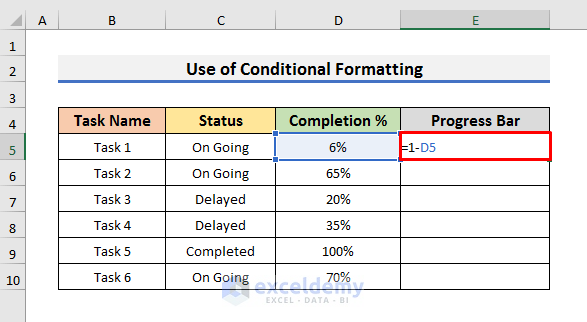
- Hit Enter to see the result.
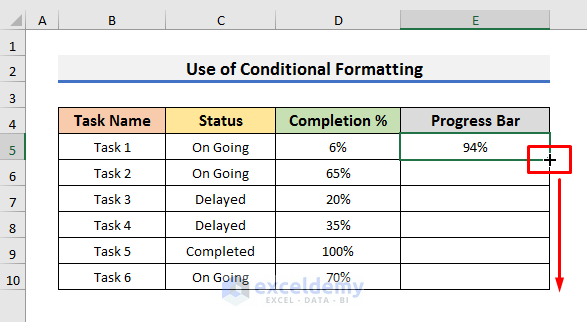
- Use the Fill Handle to copy the formula down.
- Select Cell E5 to E10.
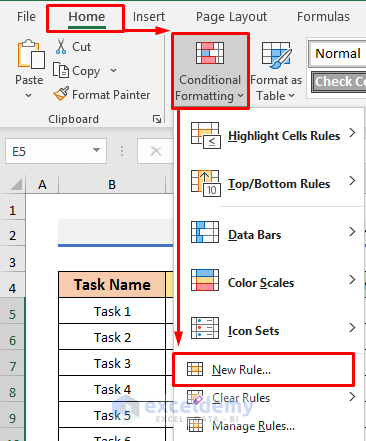
- Navigate to the Home tab and select Conditional Formatting. A drop-down menu will appear.
- Select New Rule from there. It will open the New Formatting Rule window.

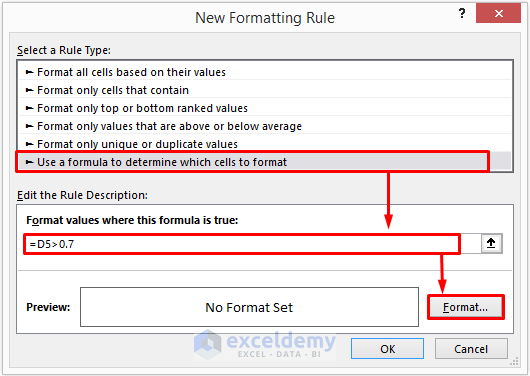
- Select Use a formula to determine which cells to format and type the formula below:
=D5<0.5- Click on Format to open the Format Cells window.
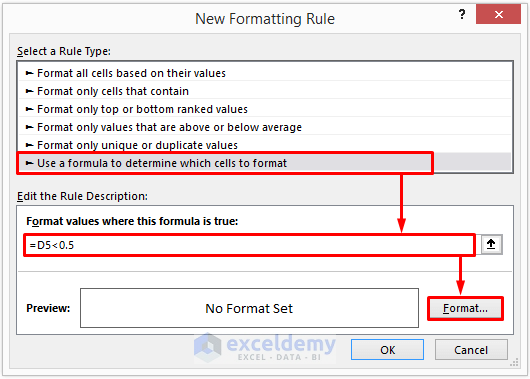
Here, the formula denotes if the value of Cell D5 is less than 50%, then, it will apply the formatting.
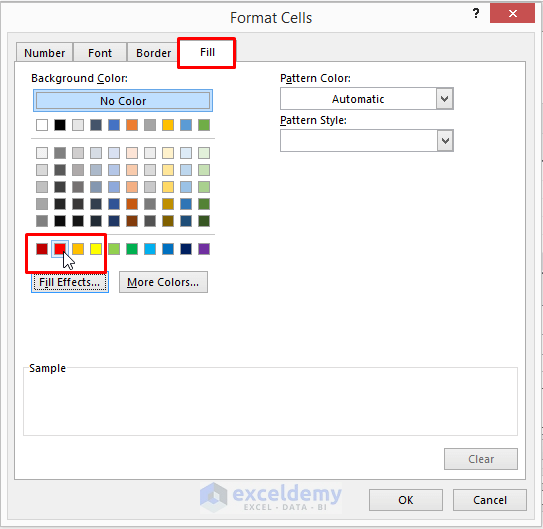
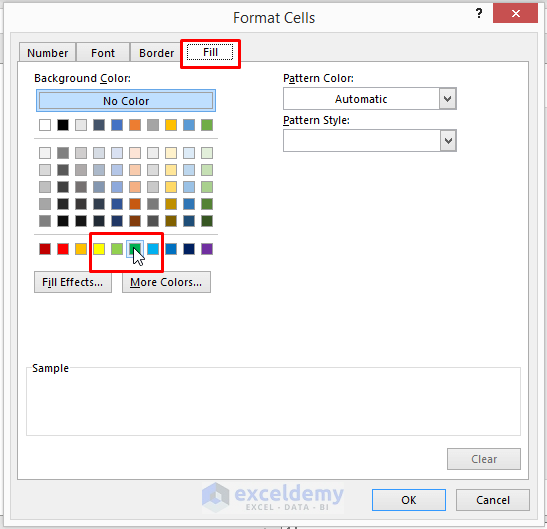
- In the Format Cells window, select Fill and choose a background color according to your choice.
- We selected the Red color.
- Click OK to proceed.
- Select Cell E5 to E10.
- Go to the Home tab, select Conditional Formatting, and select New Rule.

- Select Use a formula to determine which cells to format but type the formula below:
=AND(D5>=0.5,D5<=0.70)- Click on Format.
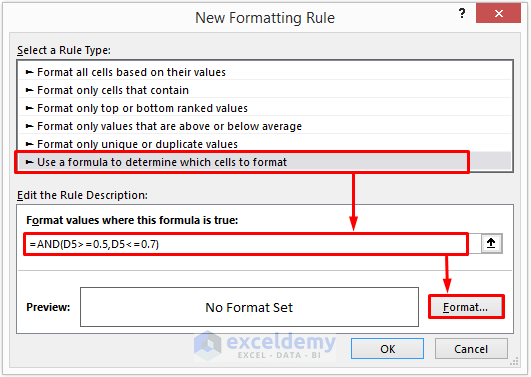
This formula indicates if the value of Cell D5 is between 50 % to 70 %, then, it will apply the formatting.
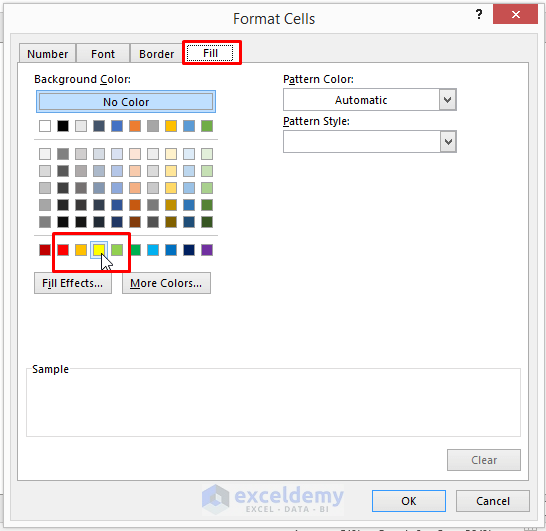
- Select Fill and choose Yellow as a background color in this case.
- Click OK to proceed.
- Select Cell E5 to E10 and go to the Home tab, select Conditional Formatting.
- Select the New Rule.
- Select Use a formula to determine which cells to format but type the formula below:
=D5>0.70- Click on Format.
The formula represents if the value of Cell D5 is greater than 70 %, then, it will apply the formatting.
- Select the Green color in the Fill tab.
- Select OK to proceed.
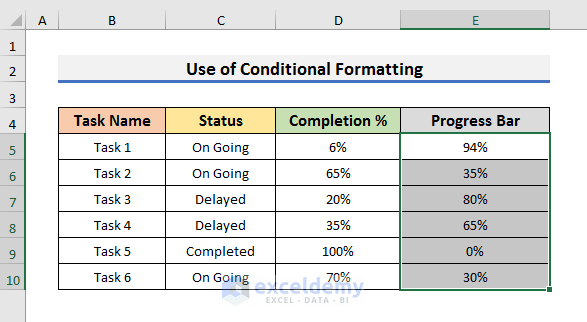
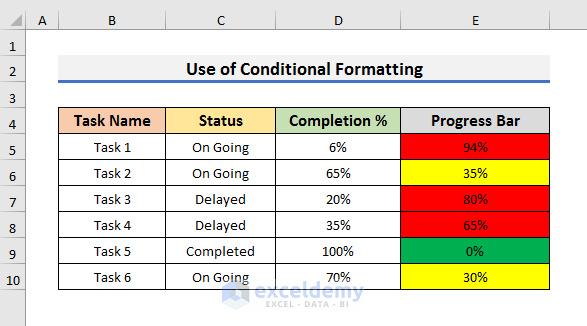
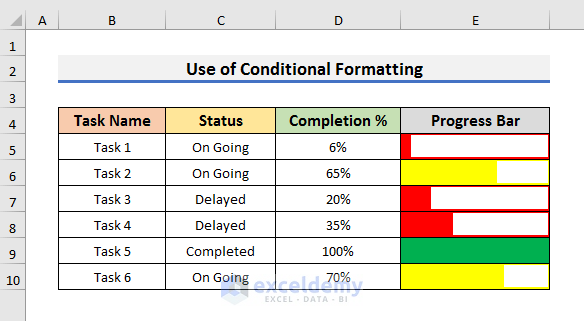
- After applying the 3 conditions, the dataset will look like the picture below.
- Go to the Home tab and select Conditional Formatting.
- Select New Rule from the drop-down menu.

- Select Format cells based on their values in the Formatting Rule window.
- Choose Data Bar and check Show Bar Only in the Format cells based on their values section.
- Select Number and type 0 in the Minimum box.
- Select Number and type 1 in the Maximum box.
- Select Solid Fill and white color in the Bar Appearance settings.
- Most importantly, select Right-to-Left in the Bar Direction.
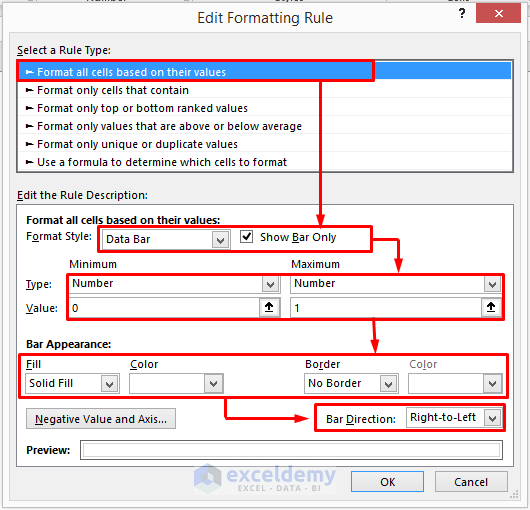
- Click OK to see results like the picture below.
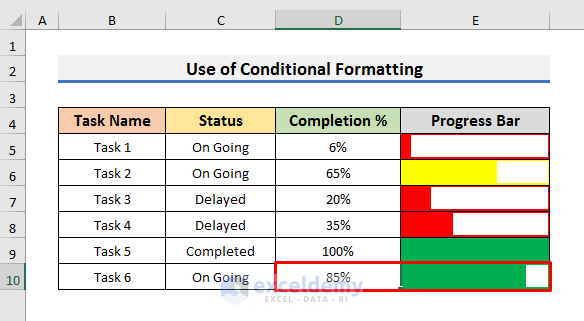
- Change the Value of Cell D5 to 85 %, the progress bar will also change according to the conditions.
Download Practice Book
You can download the practice book from here.
Related Articles
<< Go Back to Data Visualisation in Excel | Learn Excel
Get FREE Advanced Excel Exercises with Solutions!
