
Working with big data in Excel requires specialized approaches to ensure smooth, efficient, and accurate analysis. You can transform it into a powerful analysis engine with the right techniques.
In this tutorial, we’ll show you how to use Excel for big data along with techniques for handling and analyzing massive datasets.
Excel’s Limitations:
Excel has specific limits that affect big data handling:
- Worksheet limits: 1,048,576 rows × 16,384 columns.
- Memory constraints: 32-bit Excel is limited to 2GB of RAM usage.
- Calculation engine: Single-threaded for most operations.
- File size: Practical limit around 100MB for reasonable performance.
1. Importing Large Data with Power Query
Power Query excels at importing, transforming, and loading large datasets efficiently.
- Go to the Data tab >> select Get Data >> select From Text/CSV.
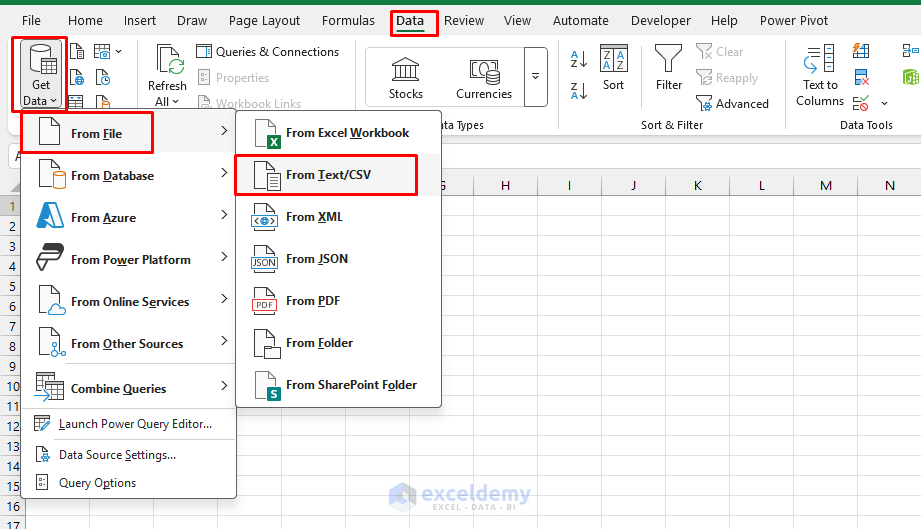
- Browse to the file location >> click Import.
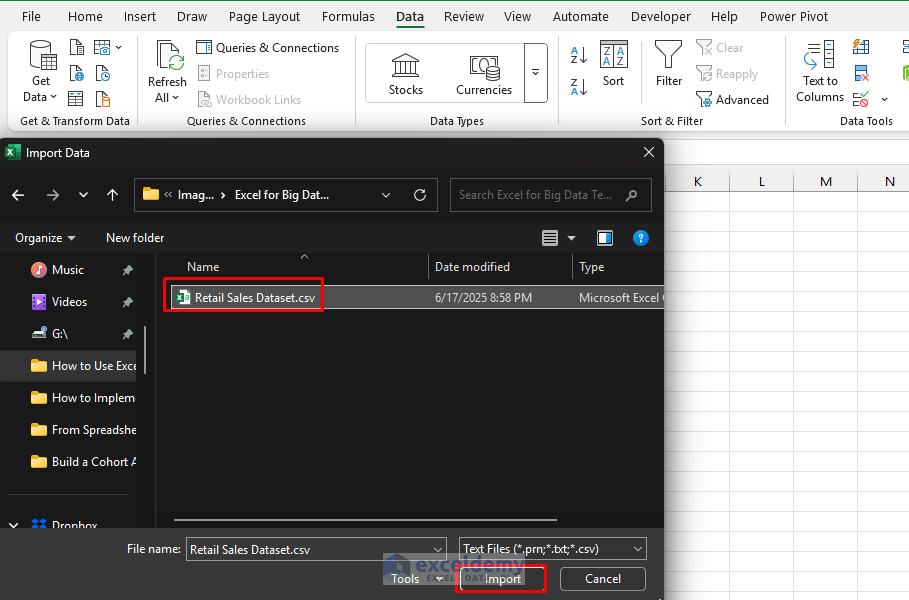
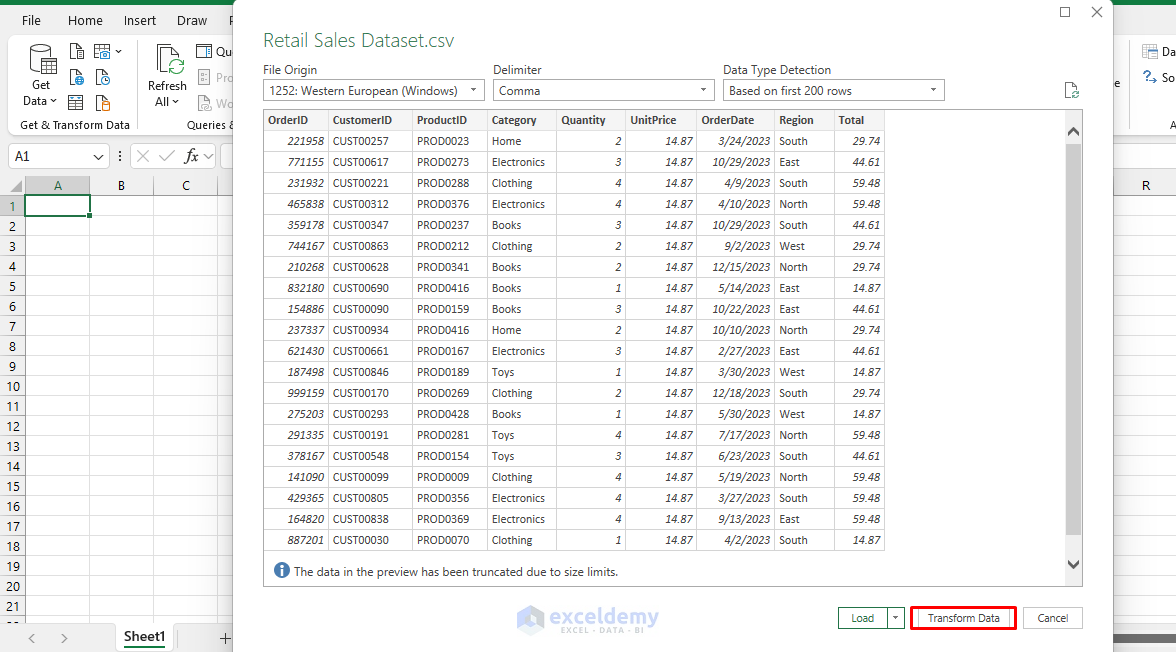
- In the Navigator pane >> select Transform Data.
- Load the data into Power Query Editor.
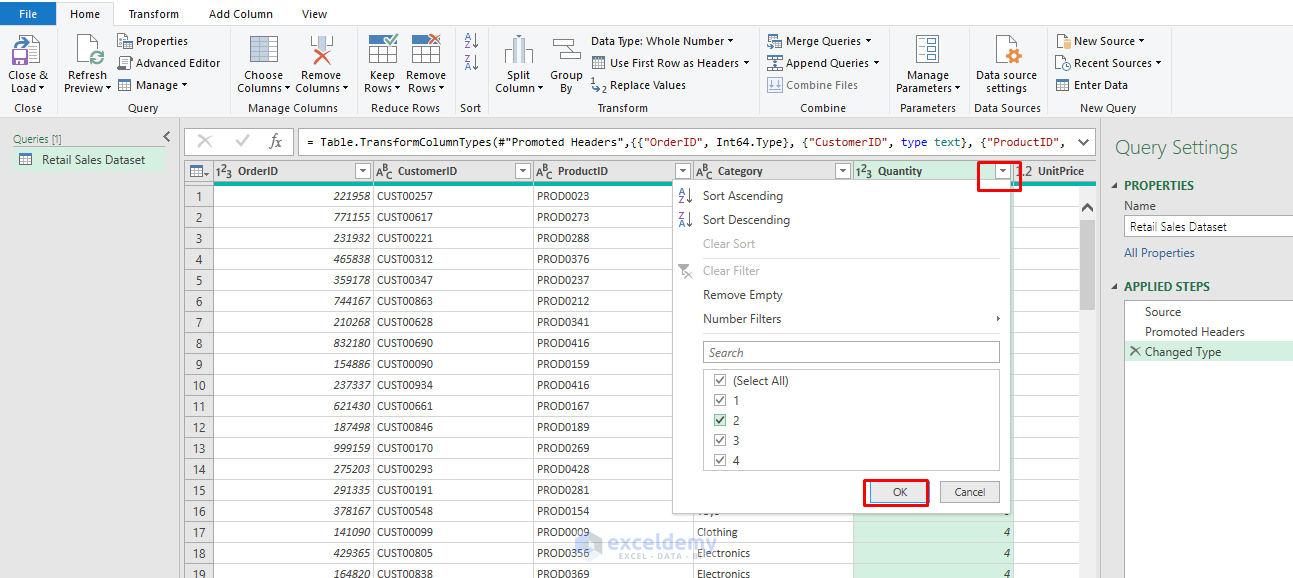
- Filter Rows Early:
- Remove unnecessary rows early to decrease data volume immediately.
- Filter by date (e.g., Month, Year, or Quarter).
- You can filter the quantity to analyze high-quantity sold products.
- Select the Drop-down icon and filter.
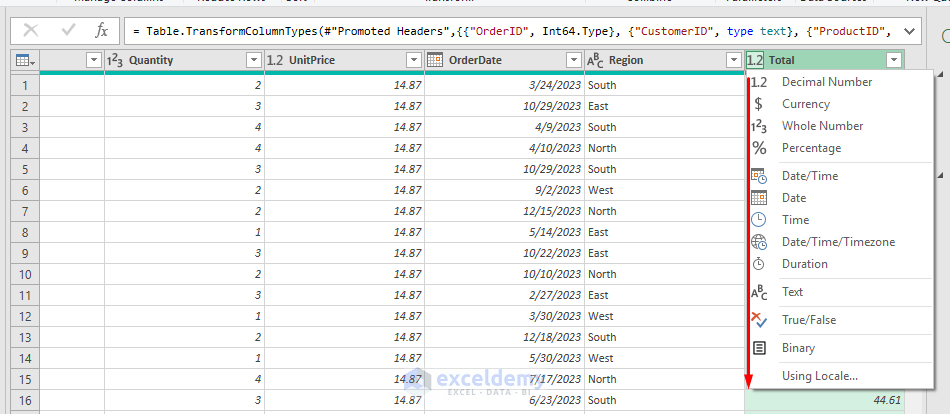
- Fix Data Types:
- Make sure numbers are stored as numbers, dates as dates, and text as text.
- This prevents errors and improves performance.
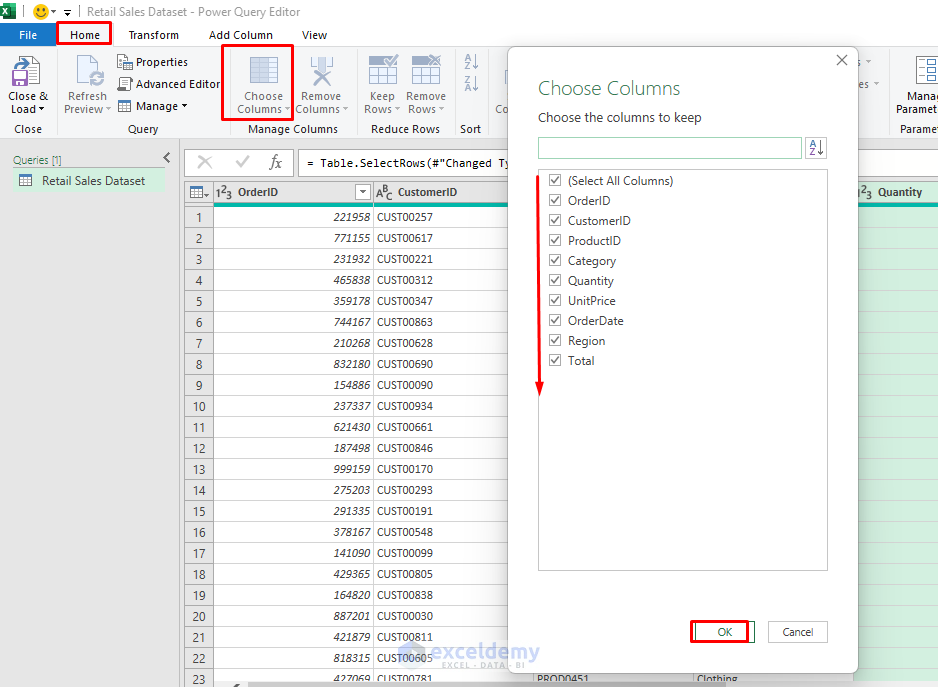
- Choose Columns Carefully:
- Import only the columns you need by selecting Choose Columns.
- Go to the Home tab >> select Choose Columns.
- Select your preferred columns.
- Click OK.
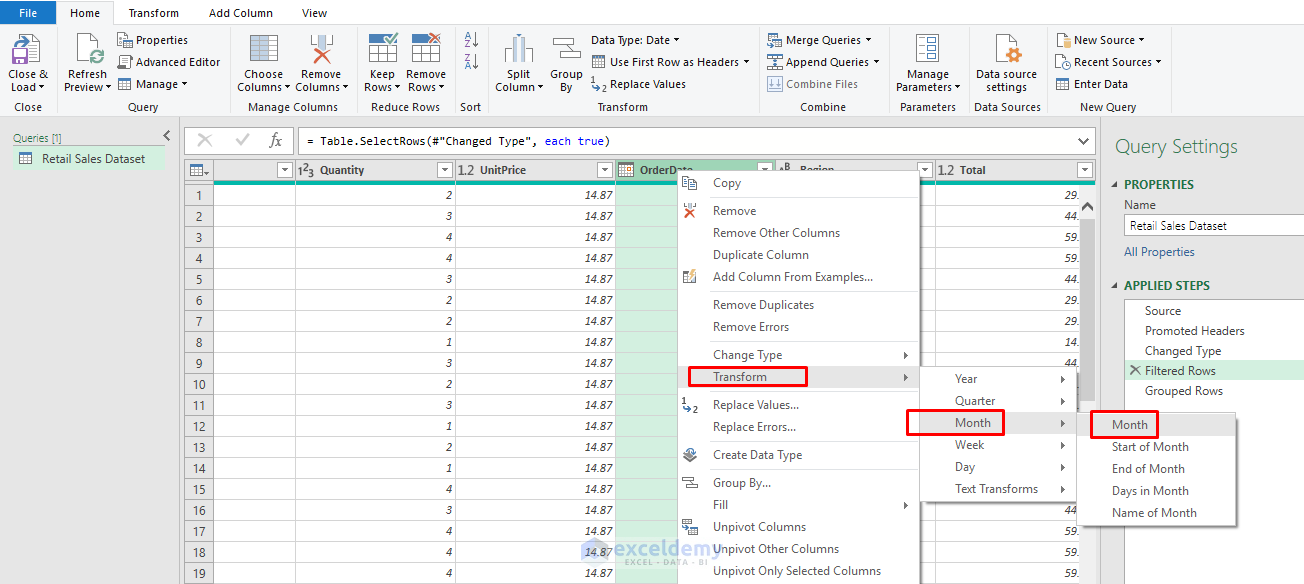
- Transform Date:
- Select the Date column.
- Right-click >> select Transform >> select Month >> select Month.
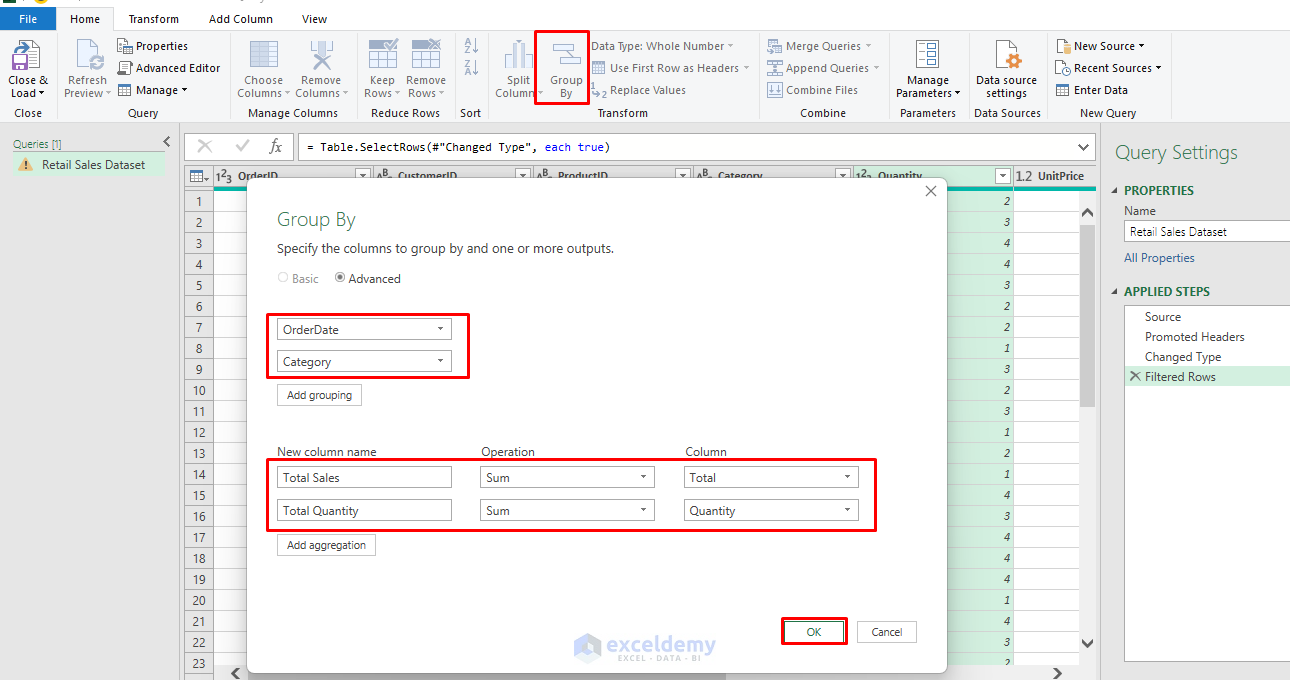
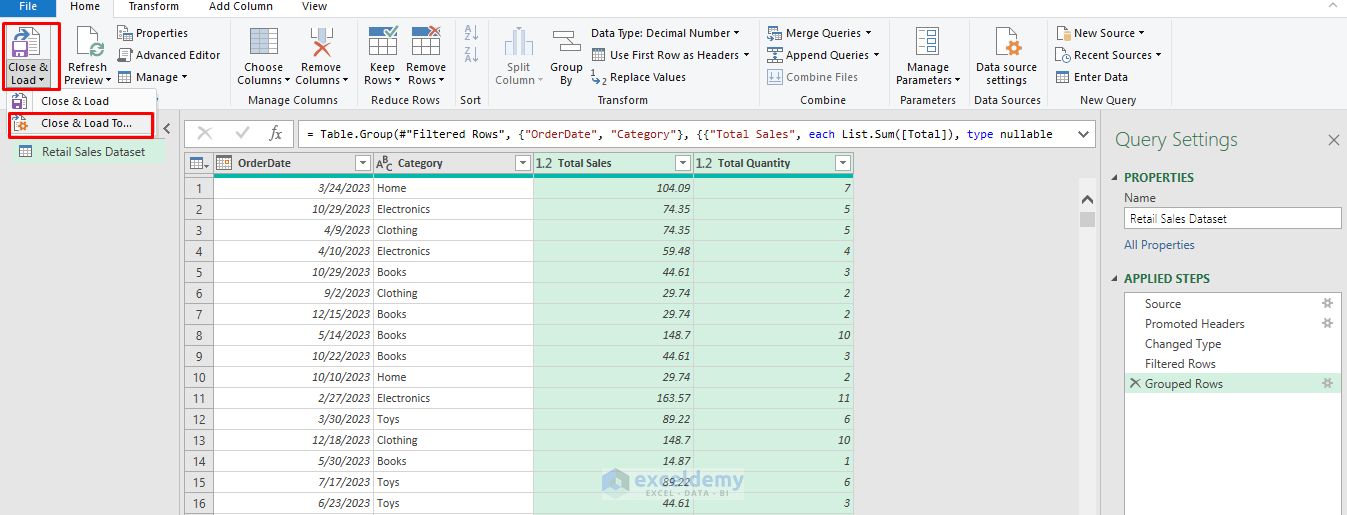
- Group Data:
- Go to the Home tab >> select Group By.
- Group by OrderDate (Month) and Category.
- Aggregate Total Sales and Total Quantity.
- Click OK.
2. Using Power Pivot and Data Model
Excel’s Data Model feature manages complex datasets efficiently.
- After transforming into Power Query,
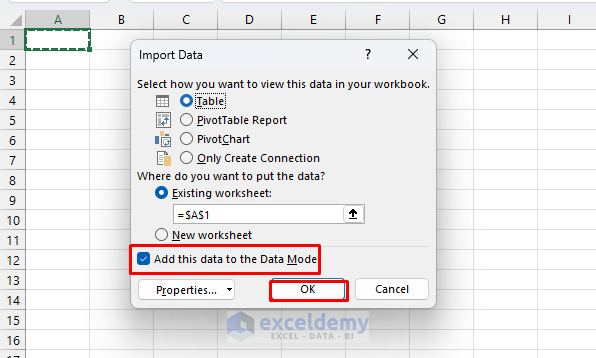
- Load data into Excel’s Data Model instead of directly into worksheets.
- Go to the Home tab >> select Close & Load >> select Load To.
- Select Add this data to Data Model >> click OK.
Enable it: If Power Pivot is not available in the ribbon.
- Go to the File tab >> select Options >> select Add-ins >> select COM Add-ins >> select Microsoft Power Pivot for Excel.
- Click OK.
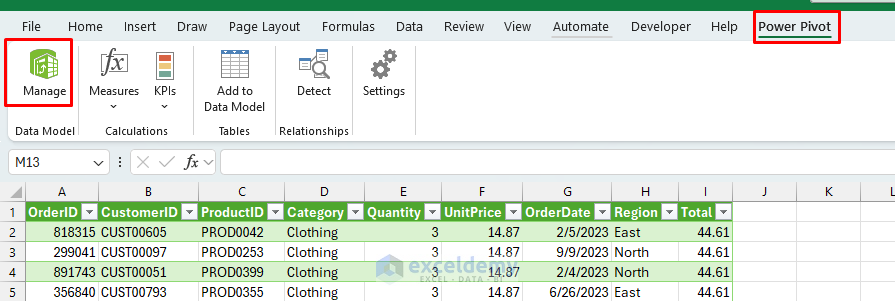
Open Power Pivot:
- Go to the Power Pivot tab >> select Manage.
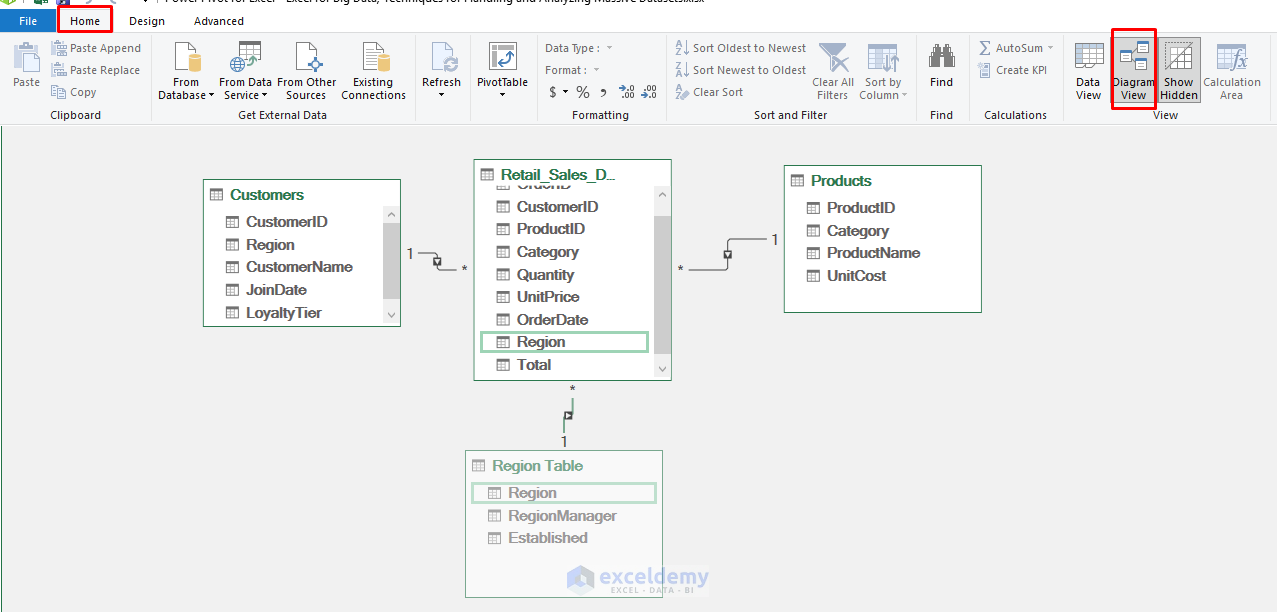
Create Relationships: If you have multiple tables like Products, Customers, Regions, etc.
- Import multiple related datasets into Power Pivot.
- Go to the Home tab >> select Diagram View to create efficient data models.
- Drag the connected fields to create the relationship.
Use DAX Formulas:
- DAX (Data Analysis Expressions) provides powerful measures for summarizing and analyzing data
- Define Measures with DAX:
TotalRevenue := SUM(Sales[Total])
AvgUnitPrice := AVERAGE(Sales[UnitPrice])
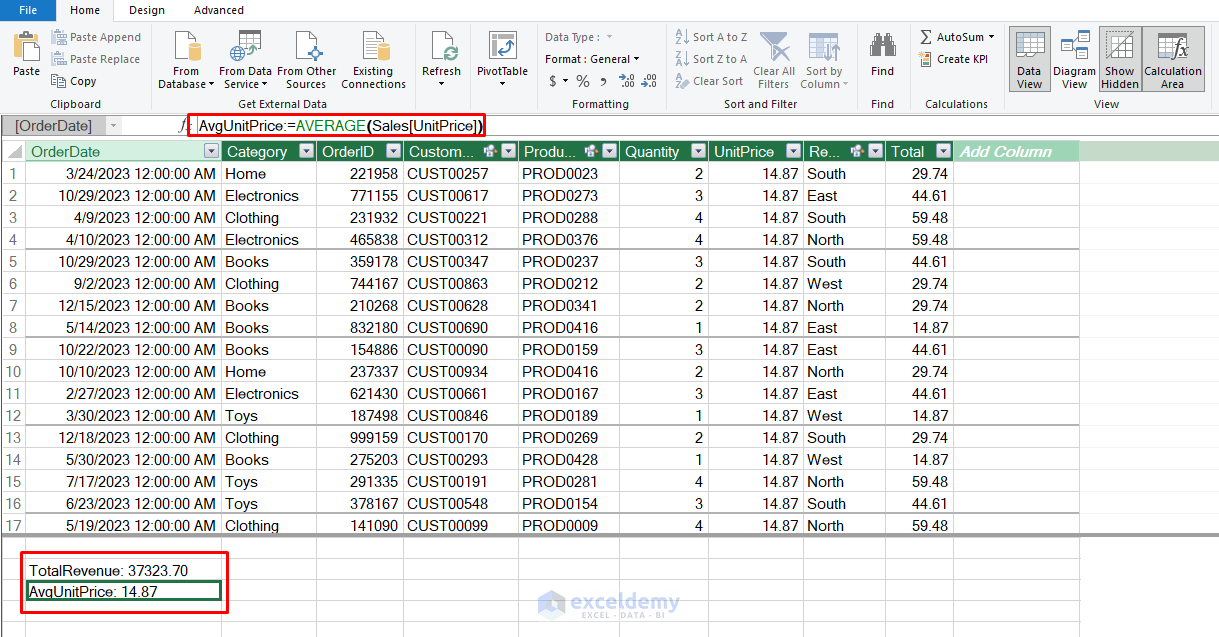
Benefits:
- Handle millions of rows.
- Create complex KPIs (e.g., YoY growth, category-wise margins).
- Integrate multiple datasets (Products, Customers).
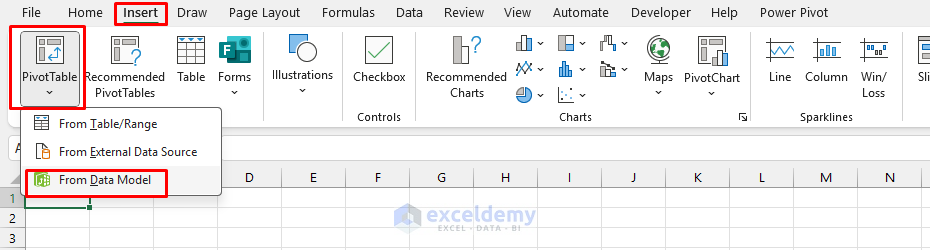
3. Building Interactive Dashboards
Use PivotTables connected to the Data Model.
- Go to the Insert >> select PivotTable >> select From Data Model.
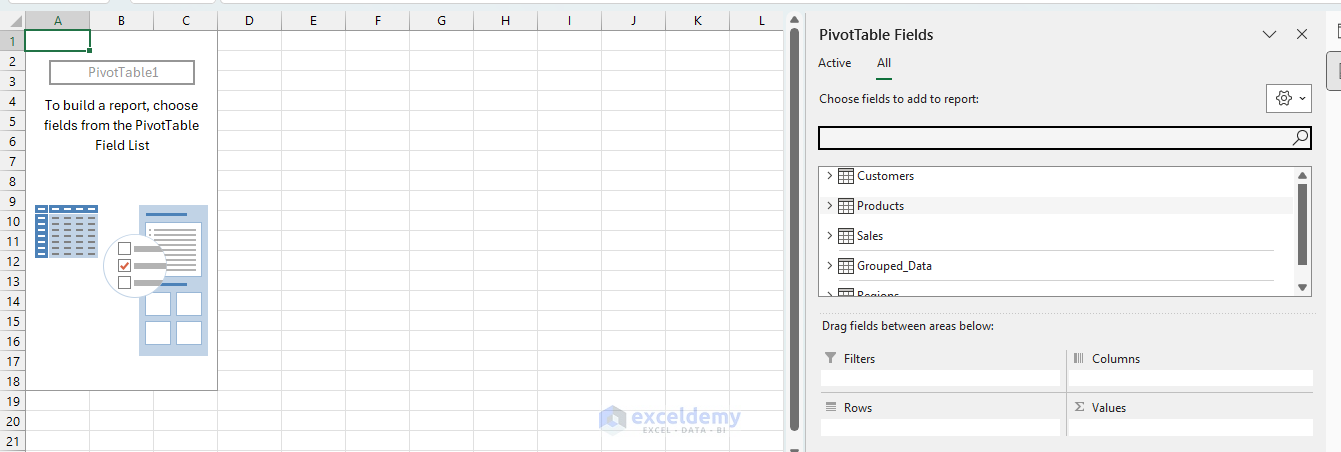
- You will get all the datasets in PivotTable Fields.
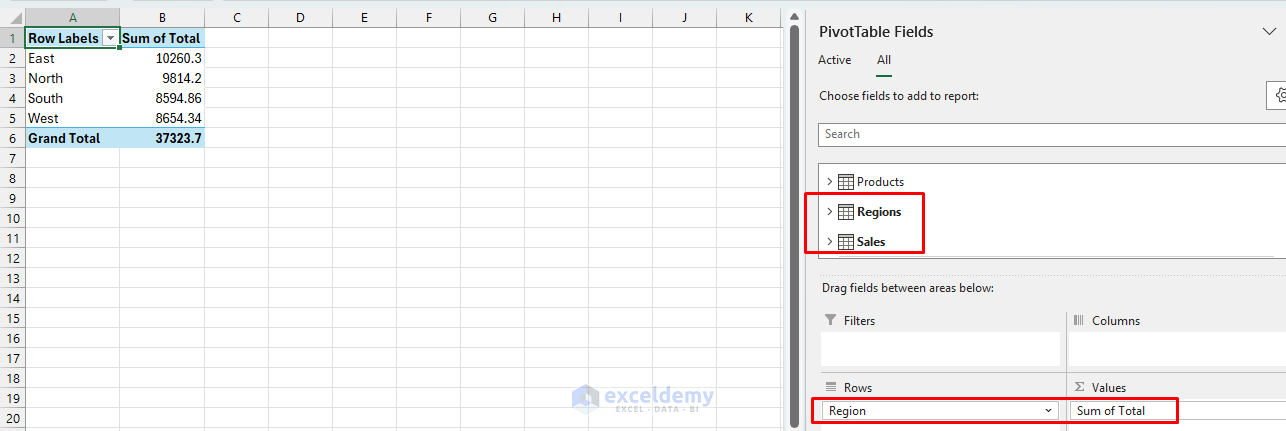
- Drag the Regions field from Regions to the Rows.
- Drag the Total field from Sales to Values.
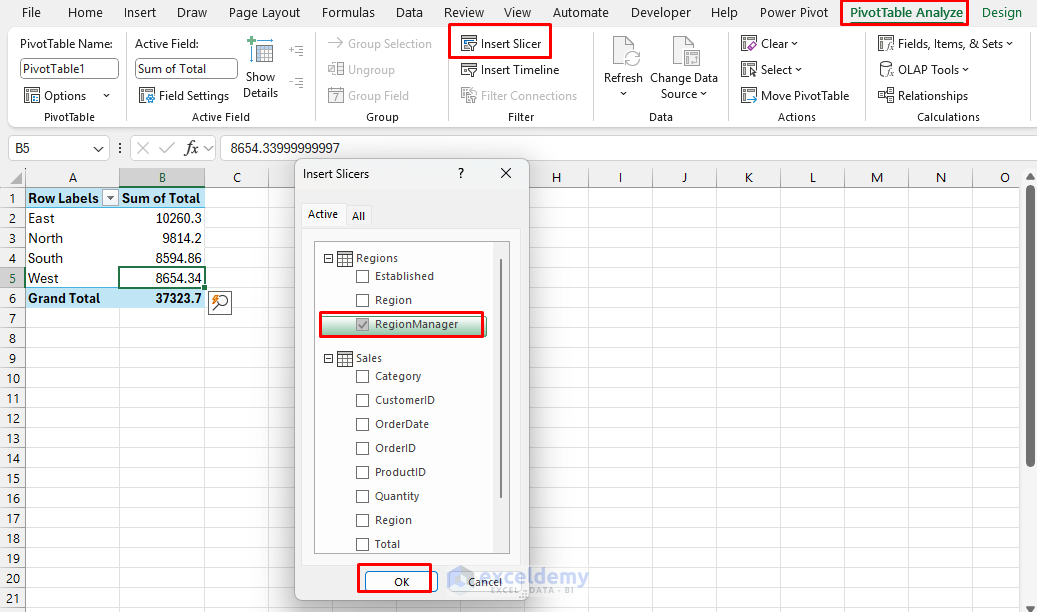
- Insert Slicers:
- Go to the PivotTable Analyze tab >> select Insert Slicer.
- Select any fields like RegionManager, Category, Month, etc.
- Click OK.
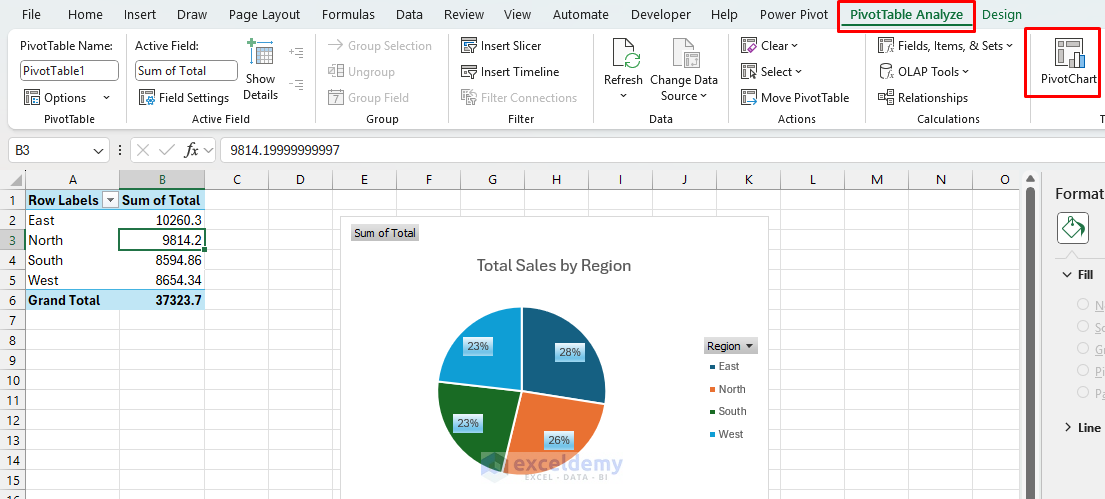
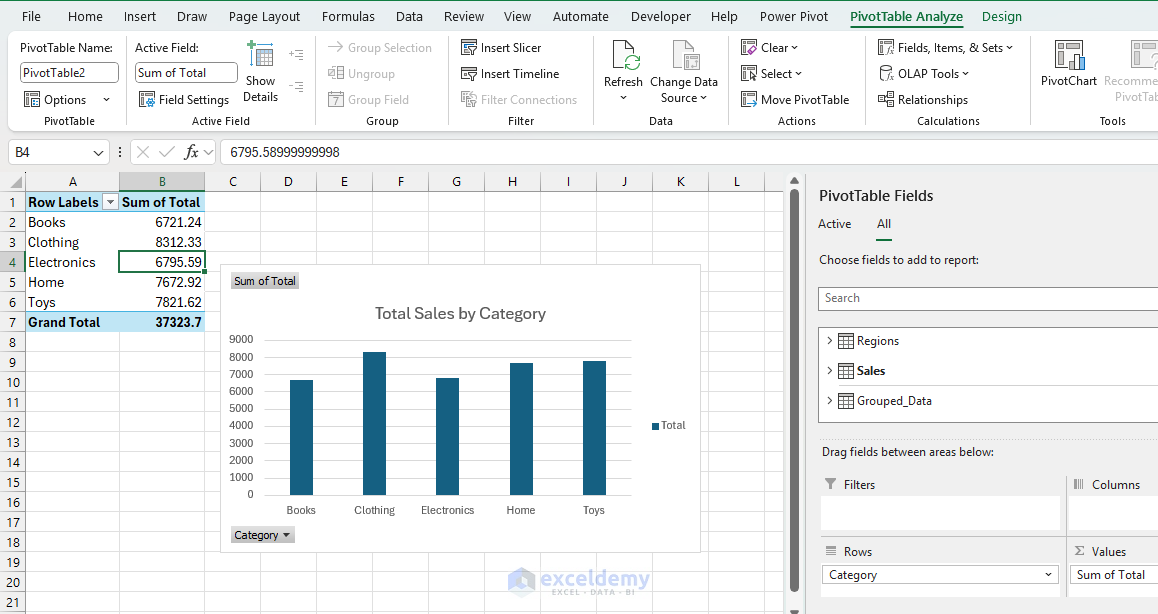
- Use PivotCharts:
- Go to the PivotTable Analyze tab >> select PivotChart >> select Pie chart.
- Click OK.
- Visualize regional performance.
- Visualize sales by category.
4. Optimizing Excel Performance
- Turn Off Automatic Calculations:
- Go to the Formulas tab >> select Calculation Options >> select Manual.
- Press F9 when you want to recalculate.
- Turn it back to Automatic when you’re done.
- Use Tables Instead of Ranges:
- Select your data.
- Go to the Insert tab >> select Table.
- Tables are faster and make formulas easier to write.
- Avoid Volatile Functions:
- These functions recalculate constantly and slow things down:
- NOW(), TODAY(), RAND(), INDIRECT().
- Use them sparingly or replace them with static values when possible.
- The 80/20 Rule: 80% of performance problems come from 20% of your data or formulas. Focus on finding and fixing the biggest bottlenecks first.
Best Practices for Big Data in Excel
| Technique | Why It Matters |
|---|---|
| Use Excel Binary Format (.xlsb) | Faster load/save, smaller file size |
| Minimize Volatile Functions | Avoid NOW(), OFFSET(), INDIRECT() for speed |
| Manual Calculation Mode | Prevents lag during edits |
| Split Raw vs. Summary Sheets | Keeps dashboards fast and clean |
| Query Folding (Power Query) | Pushes processing to the source for speed |
Go Beyond Excel
- Export to Power BI: Build on the Excel model for advanced interactivity.
- Use Python or R: Clean/process raw data externally if needed.
- Connect to SQL Databases: Use Power Query to pull only relevant data chunks.
Conclusion
Excel scales surprisingly well when used strategically. Power Query and Power Pivot provide the foundation for handling large datasets, while proper optimization and data modeling ensure sustainable performance. You can analyze tens or even hundreds of thousands of rows efficiently. In the end, working with big data in Excel will require a strategic approach combining the right tools and techniques.
Get FREE Advanced Excel Exercises with Solutions!
