
Excel is widely known for calculations and data analysis, but it can also serve as a versatile and lightweight CMS (Content Management System) for managing website content.
In this tutorial, we will show how to use Excel as a lightweight CMS for website content planning.
Why Use Excel as a CMS?
While platforms like WordPress offer full-scale CMS capabilities, Excel provides a lightweight, flexible, and accessible alternative, especially for small teams, bloggers, freelancers, and content strategists.
This guide walks you through building an integrated Excel system that manages:
- Content calendar & pipeline.
- Inventory of posts/pages.
- SEO metadata.
- Content performance tracking.
Step 1: Set up Your Workbook
- Open Excel.
- Create four sheets:
- Content Calendar
- Content Inventory
- SEO Metadata
- Performance Tracking
Let’s build each step by step.
Step 2: Content Calendar – Your Publishing Schedule
This sheet is your dashboard to manage and visualize upcoming and past content at a glance.
Convert to Table Format:
- Select the cell range.
- Go to the Insert tab >> select Table.
- Check My table has headers.
- Click OK.
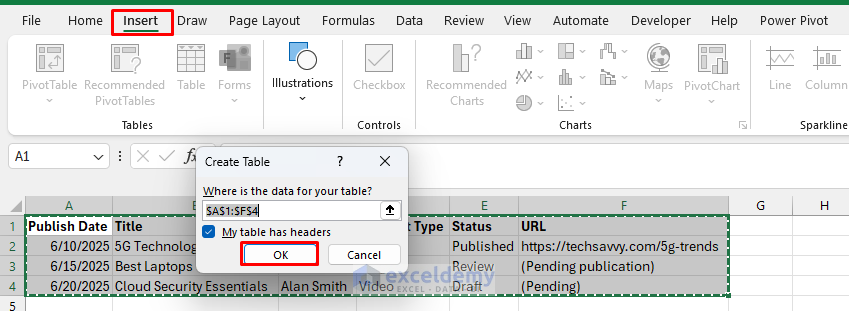
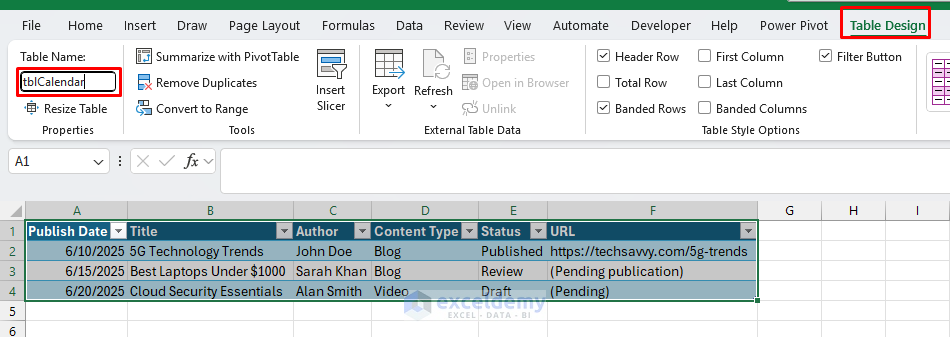
- Rename the table from Table1 to something meaningful:
- Go to the Table Design tab >> select Table Name >> insert (e.g., tblCalendar, tblSEO).
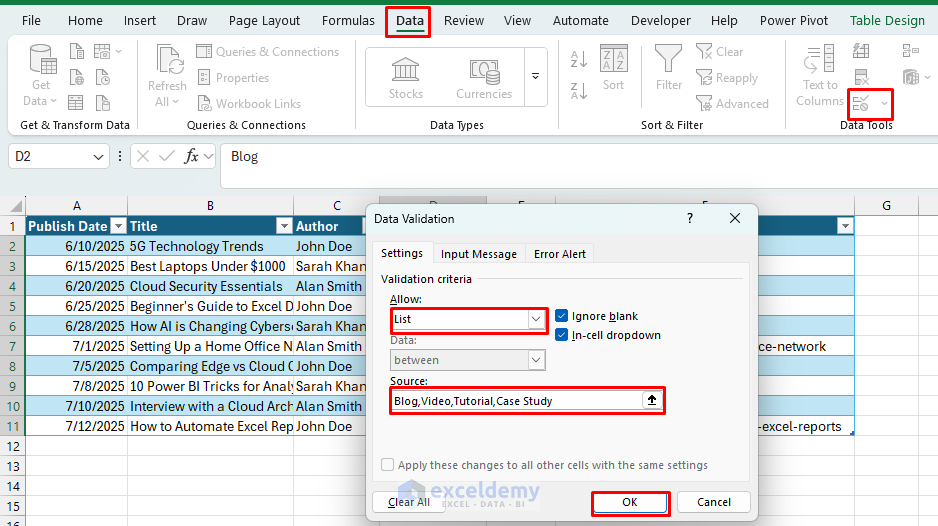
Ensure Data Consistency with Dropdowns:
To enforce consistent entries, apply dropdown lists:
- Select cells from the Content Type and Status columns.
- Go to the Data tab >> select Data Validation.
- In the Allow field >> select List.
- Enter lists:
- Content Type: Blog, Video, Tutorial, Case Study.
- Click OK.
-
- Status: Draft, In Review, Review, Published.
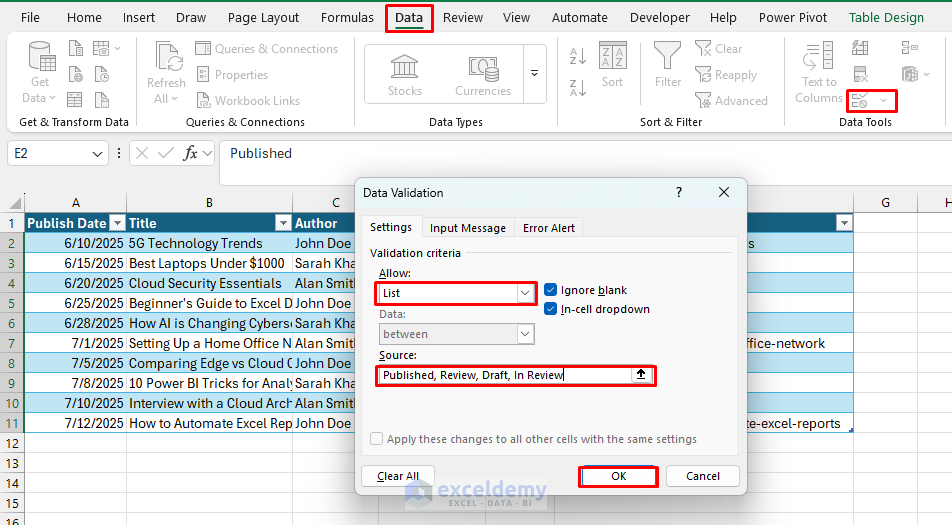
Now, each time you enter data, you select from predefined options, ensuring consistency.
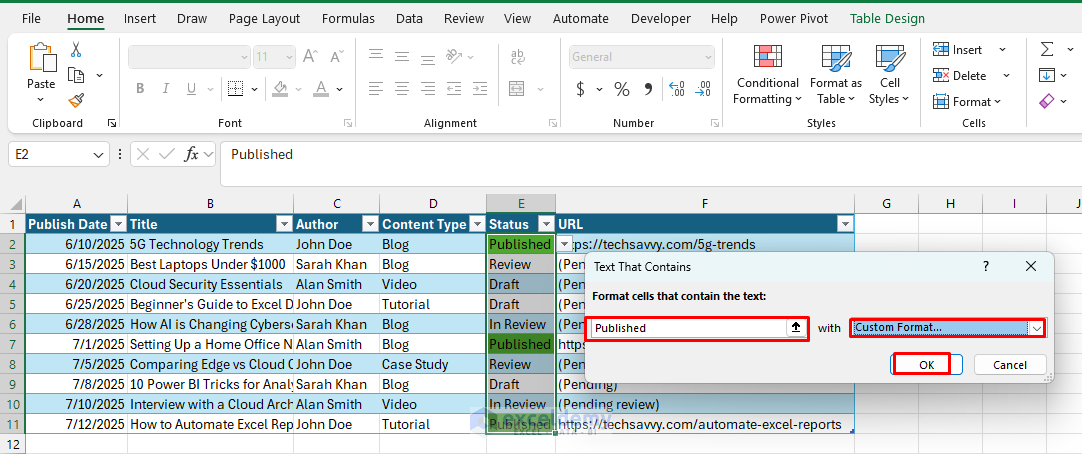
Visual Status Tracking Using Conditional Formatting:
To visualize content progress clearly, use conditional formatting:
- Highlight the Status column cells.
- Go to the Home tab >> select Conditional Formatting >> select Highlight Cells >> select Text that Contains.
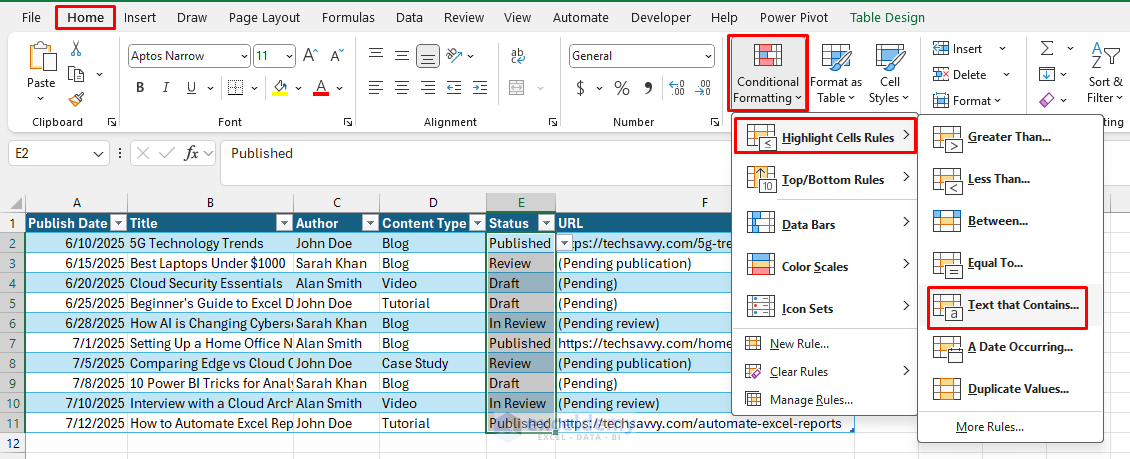
- Apply the following formats:
- Draft → Yellow.
- In Review → Orange.
- Review → Blue.
- Published → Green
Now, whenever you update the content status, Excel automatically applies the corresponding color.

Tip: This sheet links to Content Inventory, SEO Metadata, and Performance Tracking by Content ID.
Step 3: Content Inventory – Your Master Index
This sheet stores complete info for each content item, including external files.
Convert to Table Format:
- Select the cell range.
- Go to the Insert tab >> select Table.
- Check My table has headers.
- Click OK.

Tip: Use it as a lookup base for other sheets using formulas like VLOOKUP, XLOOKUP, or INDEX-MATCH.
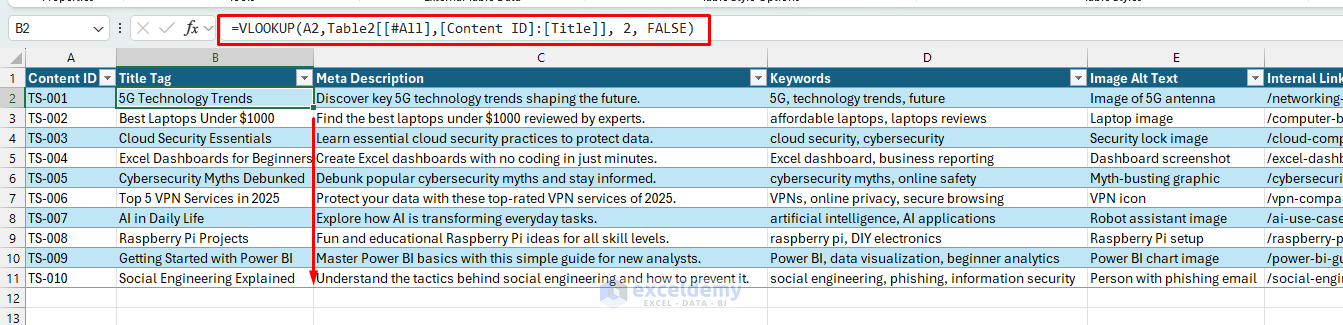
Step 4: SEO Metadata – Optimizing for Search Engines
This sheet tracks SEO elements, which are essential for ranking your content. You can automatically populate the Title on the SEO Metadata sheet from the Inventory sheet using the VLOOKUP function.
- Create a Table.
- Use the following formula to pull the Title from the Content Inventory sheet.
=VLOOKUP(A2,Table2[[#All],[Content ID]:[Title]], 2, FALSE)
This automatically fetches the content title using the Content ID from the inventory, saving manual entry.
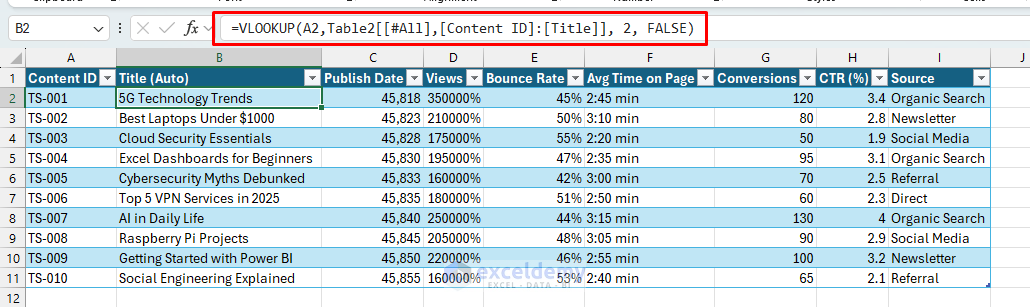
Step 5: Performance Tracking – Measure Content Success
This sheet gives insight into how your content performs over time, which is essential for optimization and strategy.
- Convert to Table Format.
- Data Entry Tips:
- Pull from Google Analytics / Matomo / Jetpack weekly.
- Use the following formula to automate the Title:
=VLOOKUP(A2,Table2[[#All],[Content ID]:[Title]], 2, FALSE)
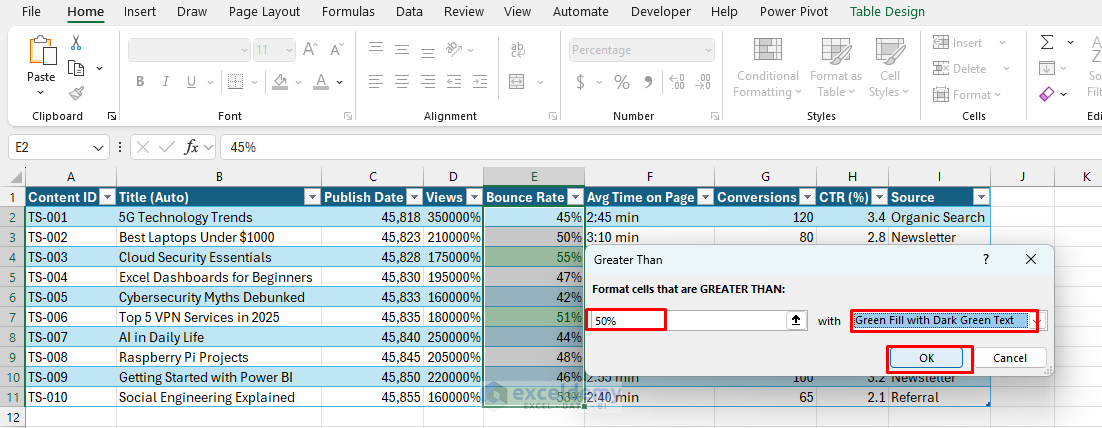
Use Conditional Formatting to Highlight:
- Go to the Home tab >> select Conditional Formatting >> select Highlight Cells >> select Greater Than/ Less Than.

-
- High Bounce Rate (>50%) → Red.
-
- Low Conversions (<90) → Red.

-
- Top Performers (>3000 views) → Green.

KPI Insights:
- Views: Shows engagement.
- Bounce Rate: Reflects content relevance.
- Avg Time on Page: Measures depth of reading.
- Conversions: Track content goals (downloads, purchases, signups).
- CTR: Click-through rates from newsletters, ads, or internal links.
- Source: Tells you where your traffic comes from.
Tip: You can use this to rank your best-performing content, spot underperformers, and identify which sources drive results.
Step 6: Analytics and Reporting
Pivot Tables for Content Analysis:
Create pivot tables to analyze your content:
- Select your data range.
- Go to the Insert tab >> select PivotTable.
- Select location: New Worksheet.
- Click OK.

- Drag fields to analyze patterns:
- Rows: Content Type, Author.
- Columns: Status.
- Values: Count of Status.

This helps you see productivity patterns, content type distribution, and bottlenecks in your workflow.
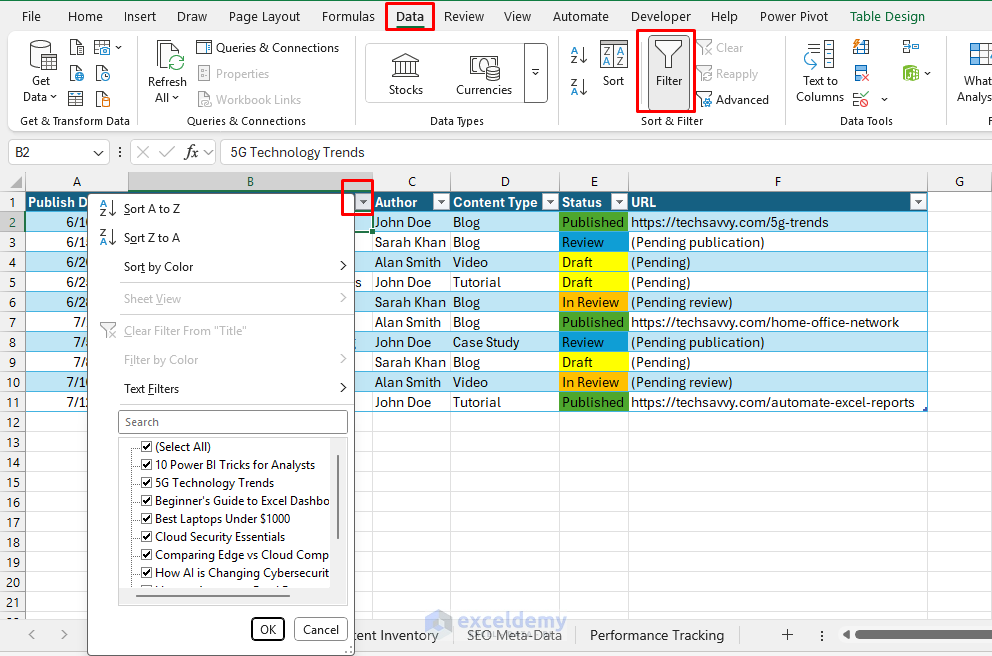
Using Filters and Slicers:
Set up dynamic filters to quickly find content:
- Select your data range.
- Go to the Data tab >> select Filter.
- Or use the dropdown arrows from table headers to filter by any criteria.
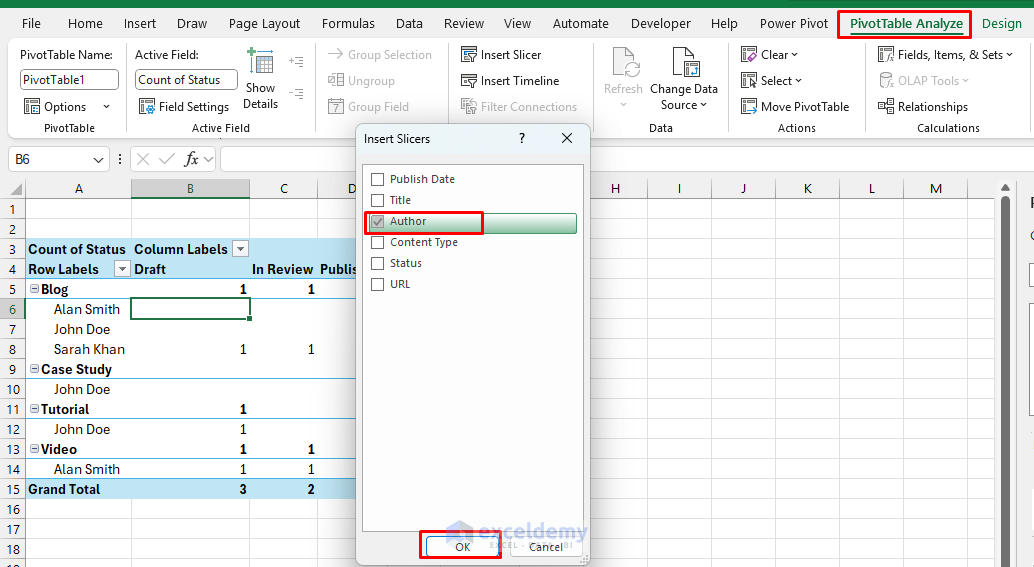
For more Advanced Filtering, add Slicers:
- Select your data range.
- Go to the Insert tab >> select Slicer.
- Or, go to the PivotTable Analyze tab >> select Slicer.
- Choose fields like Author from the Slicer.
- Click OK.
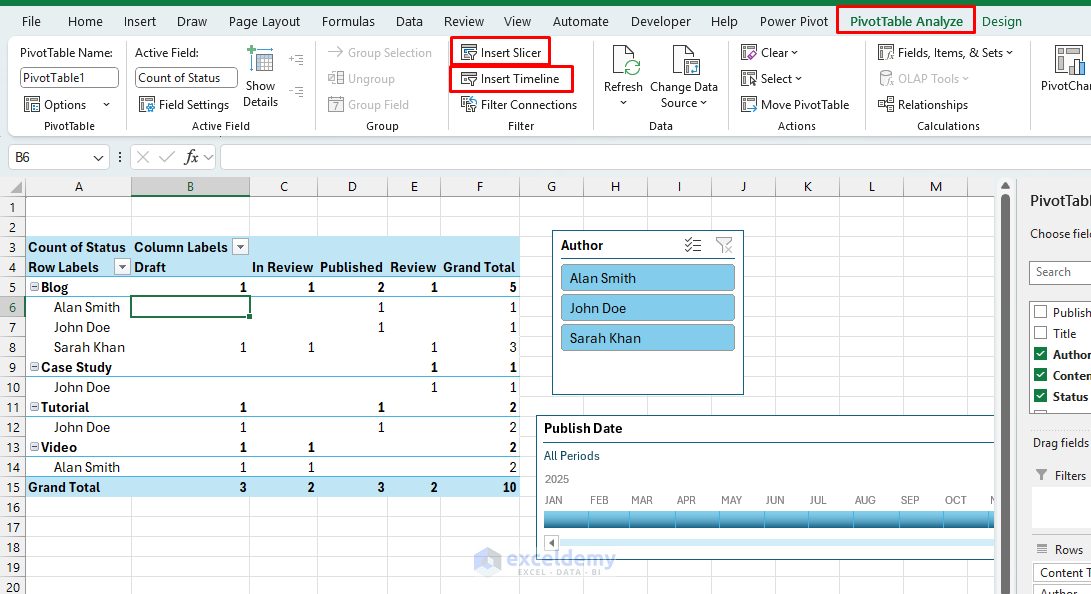
-
- Choose Publish Date from the Timeline.
- Use visual buttons to filter your view instantly.
Add Chart:
- Add Charts in the Performance sheet to visualize traffic growth or bounce rate trends.
- Go to the Insert tab >> select Combo chart >> select Line as secondary axis.
- Click OK.

Conclusion
Excel may not replace enterprise CMS systems, but for small teams, freelance writers, or early-stage startups, it offers a lightweight, highly adaptable solution to plan, track, and optimize your content. By following the above steps, you can create a lightweight CMS for website content planning. Excel CMS provides structure without complexity, clarity without cost, and control without a steep learning curve. You can explore Excel’s advanced features to make it more dynamic and interactive.
Get FREE Advanced Excel Exercises with Solutions!
