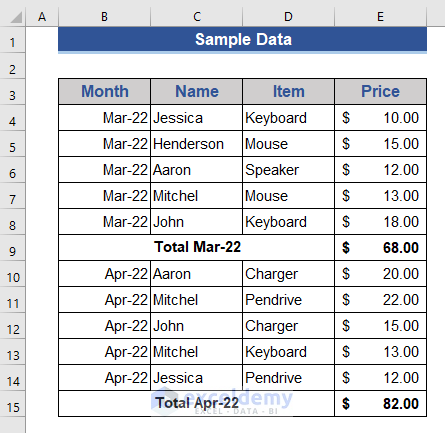
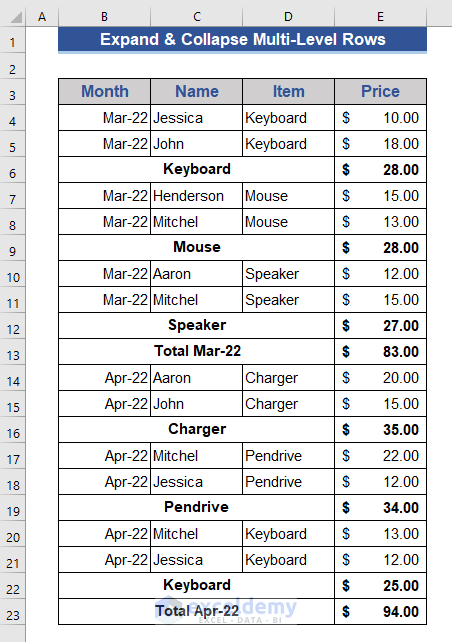
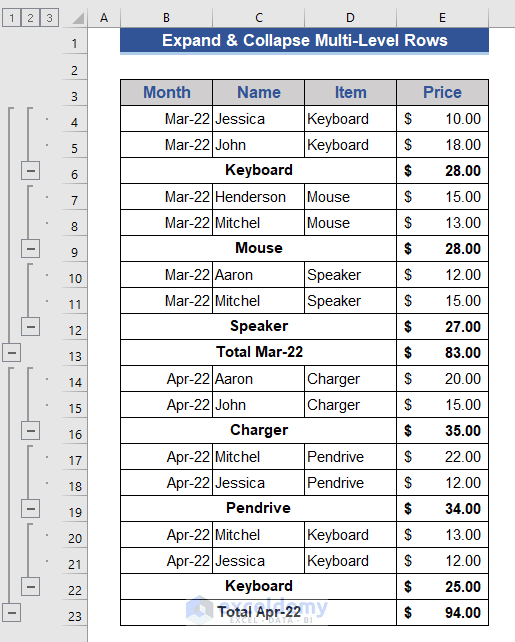
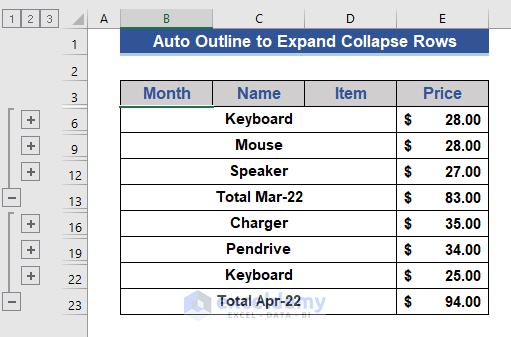
The following dataset contains the sales for the months of March and April of 2022.
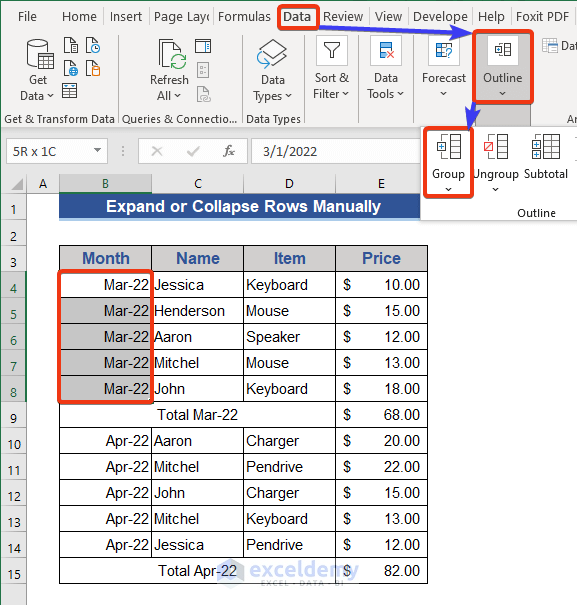
Method 1 -Using the Group Feature to Expand or Collapse Rows Manually
Steps:
- Select all cells in March 22.
- In the Data tab, choose the Outline group.
- Select Group.
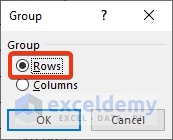
- The Group window will open.
- Choose Rows and click OK.
Look at the left side of the dataset.
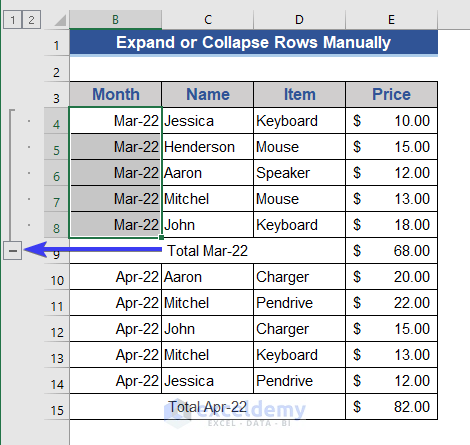
- A minus sign is displayed. If you click it, the dataset will collapse and a plus sign will be displayed.
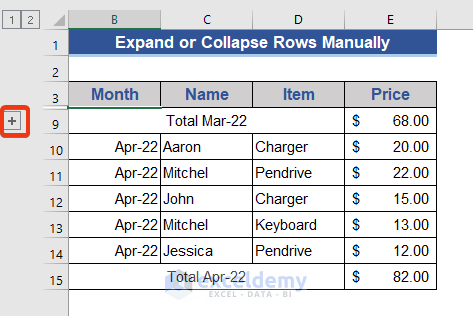
To expand the dataset, click the plus sign.
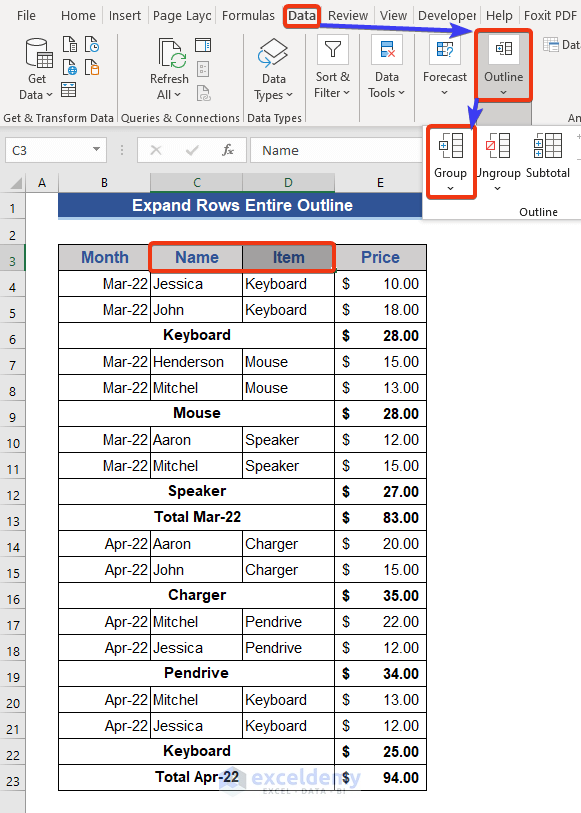
Method 2 – Expanding and Collapsing Multi-Level Rows in Excel
Steps:
- Select 2 items in March.
- In the Data tab, choose Outline.
- Select Group.
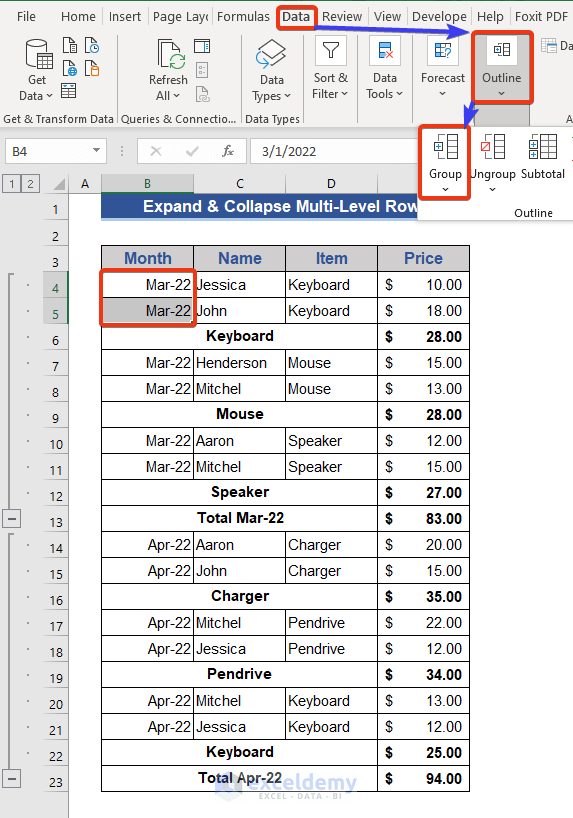
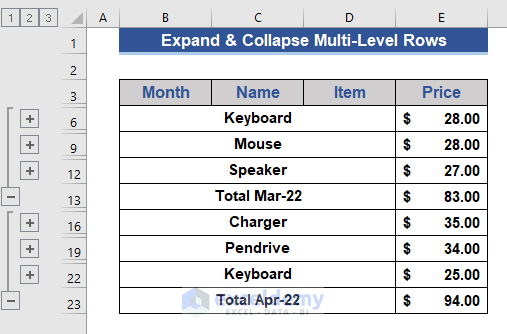
A minus sign is displayed on the left side.
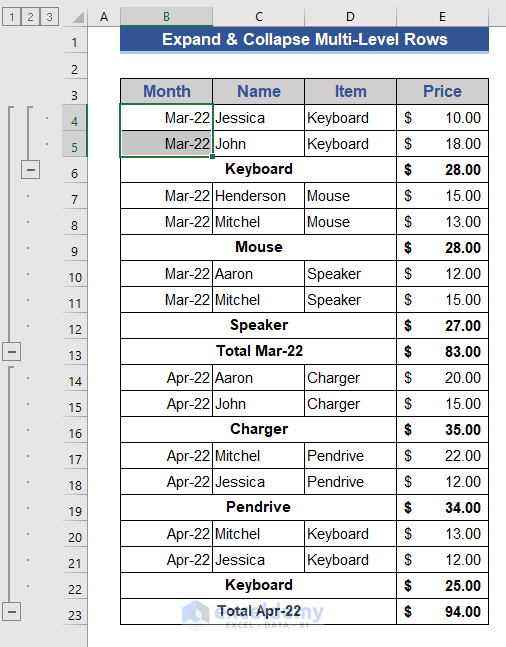
The dataset can be collapsed.
- Grouping can also be applied to other data:
- Collapse the dataset to see multi-level grouped data.
Read More: How to Create Collapsible Rows in Excel
Method 3 – Applying the Auto Outline Command
Steps:
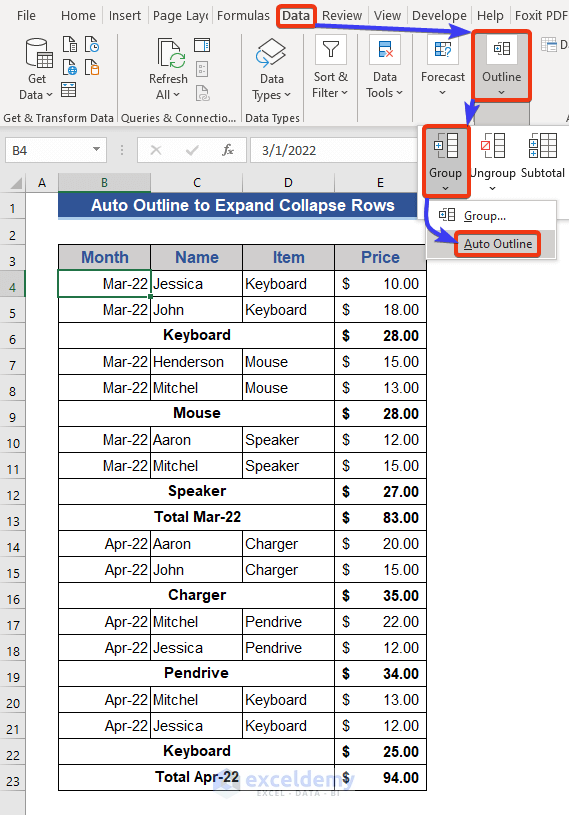
- Select a cell in the dataset.
- In the Data tab, select Outline.
- In Group, choose Auto Outline.
This is the output.
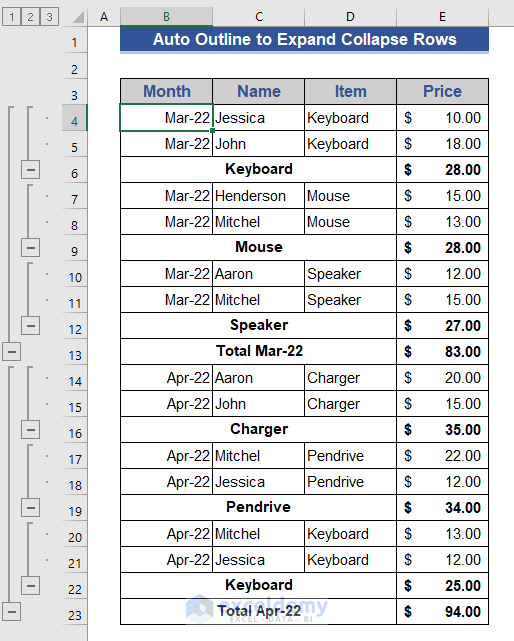
- Collapse the dataset by pressing the minus sign.
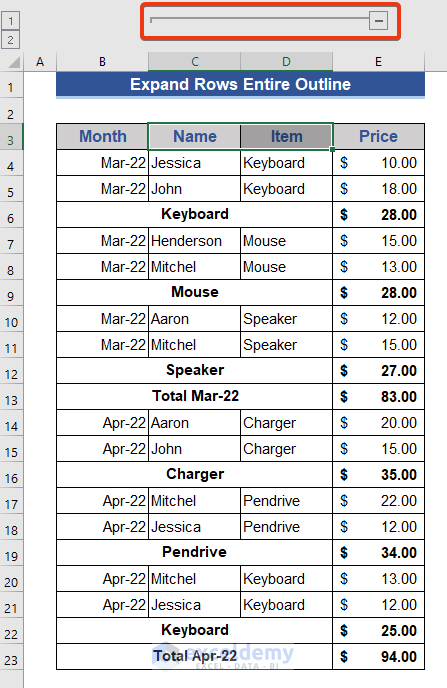
Method 4 – Expanding Rows with the Entire Outline
Steps:
- Select a cell.
- In the Data tab, choose Outline.
- Select Show Detail.
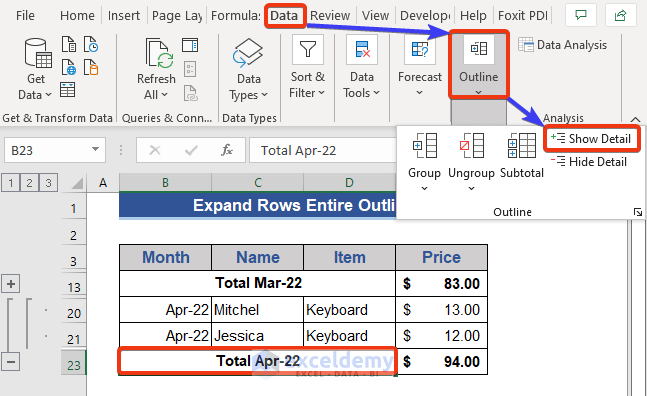
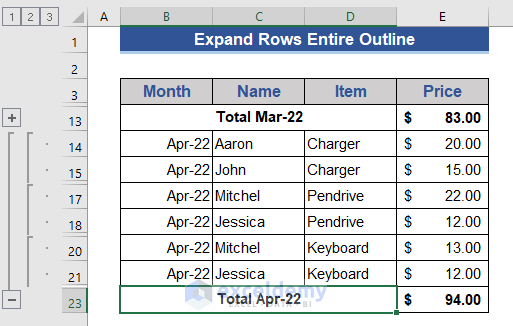
This is the output.
How to Expand and Collapse Columns with the Plus Sign
Steps:
- Go to the Data tab.
- In Group, select Outline.
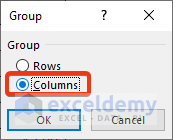
- The Group window will open. Choose Columns and press OK.
A minus sign appears at the top of the column.
- Click the minus sign and the column will collapse.
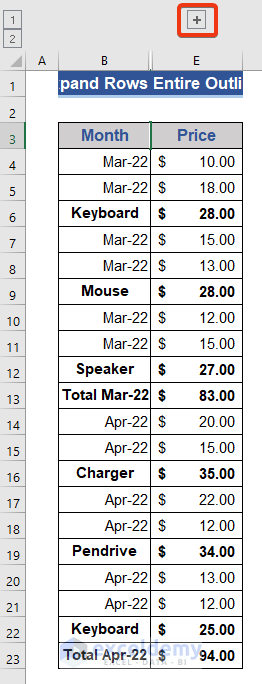
A plus sign is displayed. By pressing it, columns will expand.
Download Practice Workbook
Related Articles
- How to Resize All Rows in Excel
- How to Color Alternate Rows in Excel
- How to Copy Every Nth Row in Excel
- How to Lock Rows in Excel
- Create Rows within a Cell in Excel
<< Go Back to Rows in Excel | Learn Excel
Get FREE Advanced Excel Exercises with Solutions!
