To demonstrate our methods, we’ll use a sample dataset containing Date, Region, and Sales. and calculate the average Sales within a certain date range.

Method 1 – Using the AVERAGEIFS Function
AVERAGEIFS is the most commonly used formula for calculating the average if within a date range.
Let’s calculate the average sales between the dates 22/03/2022 and 29/03/2022.
Steps:
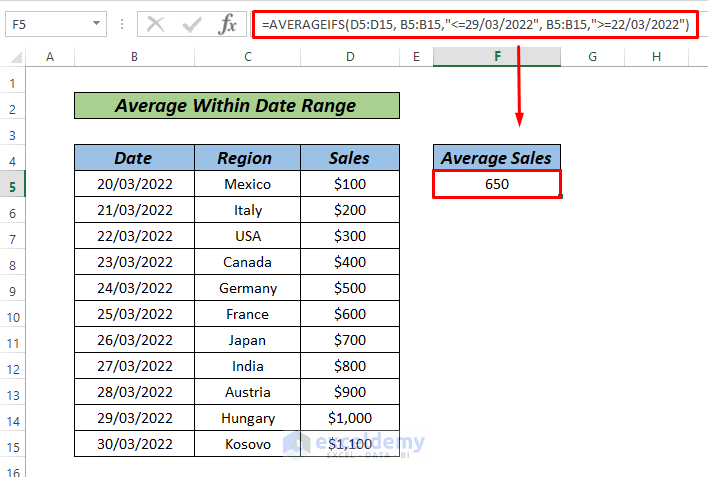
- In cell F5 enter the following formula:
=AVERAGEIFS(D5:D15, B5:B15,"<=29/03/2022", B5:B15,">=22/03/2022")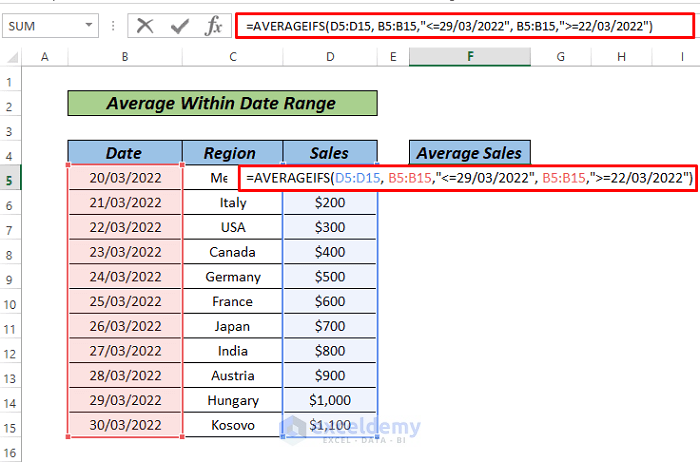
- Press ENTER to return the result.
Read More: How to Use IF Formula for Date Range in Excel
Method 2 – Using the AVERAGE Function
Let’s calculate the average sales from 20/03/2022 to 28/03/2022 using AVERAGE in conjunction with IF.
Steps:
- In cell F5 enter the following formula:
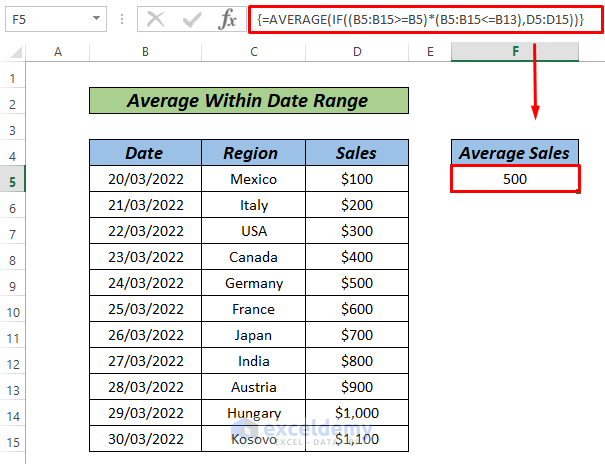
=AVERAGE(IF((B5:B15>=B5)*(B5:B15<=B13),D5:D15))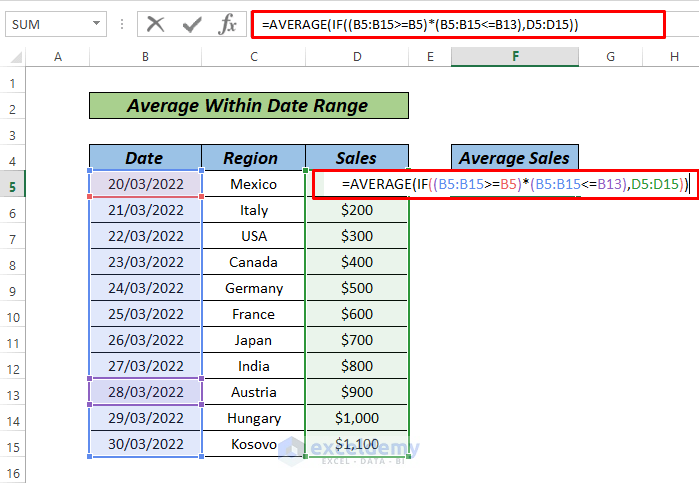
- Press CTRL+SHIFT+ENTER to return the result (ENTER in Excel 365)
Formula Breakdown
- IF((B5:B15>=B5)*(B5:B15<=B13),D5:D15) returns {100;200;300;400;500;600;700;800;900;FALSE;FALSE}
- This is the array of all the Sales values within our specified range.
- AVERAGE({100;200;300;400;500;600;700;800;900;FALSE;FALSE}) returns 500.
Read More: How to Pull Data from a Date Range in Excel
Method 3 – Using the SUMPRODUCT Function
Let’s calculate the average of sales between 21/03/2022 and 28/03/2022 using the SUMPRODUCT Function.
Steps:
- In cell F5 enter the following formula:
=SUMPRODUCT(--(B5:B15>=B6),--(B5:B15<B14),D5:D15)/SUMPRODUCT(--(B5:B15>=B6),--(B5:B15<B14))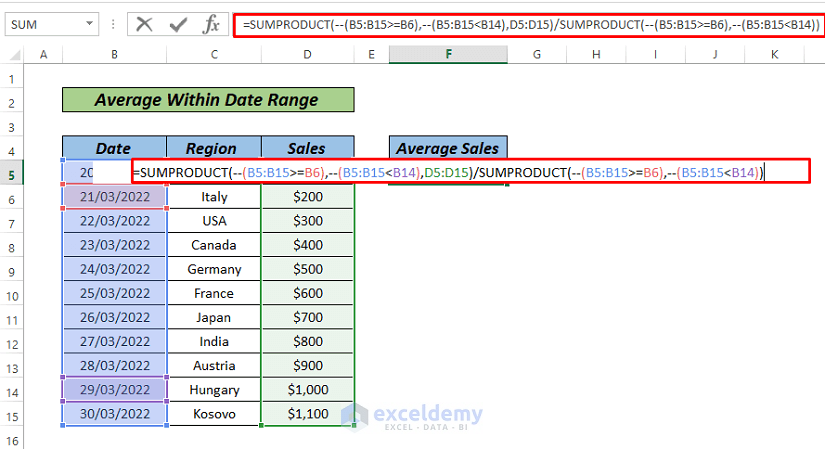
- Press ENTER to return the result.

Formula Breakdown
- SUMPRODUCT(–(B5:B15>=B6),–(B5:B15<B14),D5:D15) returns 4400 (Total Sales Value).
- SUMPRODUCT(–(B5:B15>=B6),–(B5:B15<B14)) returns 8 (Total Number of Sales).
- Total Sales Value / Total Number of Sales = Average Sales Value.
Download Practice Workbook
Related Articles
- VLOOKUP Date Range and Return Value in Excel
- How to Find Max Date in Range with Criteria in Excel
- How to Use Formula for Past Due Date in Excel
<< Go Back to Date Range | Date-Time in Excel | Learn Excel
Get FREE Advanced Excel Exercises with Solutions!

Hi! This is helpful but I am interested to see if you could do average sales in a time period and a county. So let’s say, I want to find the average sales in May in each country. Could you help me with a formula for that?
Hi MKM,
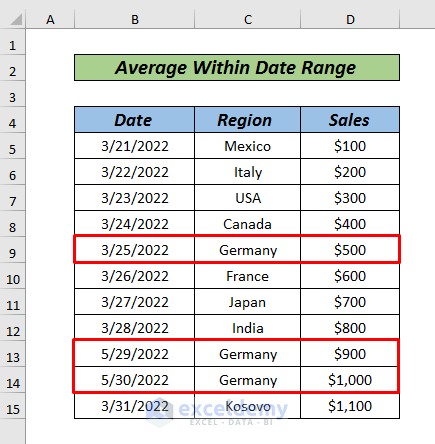
Thanks for your comment. To answer your question, we can use the dataset below. It contains 3 rows of sales for Germany. The first sale happened in March and the other two sales happened in May. From this dataset, we can easily calculate the average sales for May in Germany.
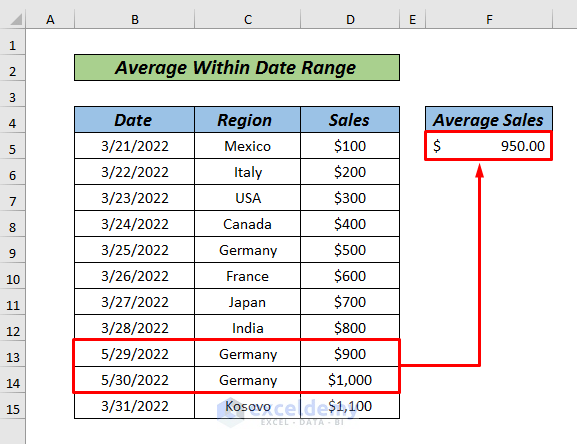
To calculate the average sales for May in Germany, select Cell F5 and type the formula below:
=AVERAGEIFS(D5:D15, B5:B15,”<=5/31/2022", B5:B15,">=5/01/2022″,C5:C15,”Germany”)
Press Enter to see the result.
I hope this will help you to solve your problem. Please let us know your queries if you face any issues.
Thanks.