Pivot Tables allow you to summarize and organize data quickly and efficiently, in order to identify patterns, trends, and other key insights. One can quickly structure and re-structure the Pivot Table, by dragging and dropping fields from the data.
Let’s get started with an example to demonstrate the kinds of insights, Pivot Tables can provide.
Introduction
At its most basic level, a dream is a sequence of images, ideas, fragments of stories, and sensations that occur while one is sleeping. One dreams most often during the REM (rapid eye movement) stage of sleep.
The exact purpose of dreaming has not been discovered yet. Sigmund Freud thought that dreams represented hidden desires or repressed memories. Some, believe dreams are just a by-product of neural processes occurring while one is sleeping, while others believe that dreams serve an important function.
There are a number of theories in the field of psychology and neuroscience, concerning the purpose of dreams. The threat simulation hypothesis regards dreams as a state where one can rehearse threatening situations, to prepare one for real-life dangers. Another theory regards dreams as having the ability to influence how one feels during the day, either it has an effect on the mood of the individual or on physiological functions. For example, if one has a nightmare the night before, the rest of the day, one would be in a bad mood.
Research has provided some interesting observations about the dream state. People tend to have pleasant dreams if nice smells are wafted at them while sleeping. Some people are lucid while they are dreaming, in other words, they are in control of themselves and can control what is happening in the dream and their responses. Children with ADHD have been observed to also experience symptoms of this condition in their dreams. Hypnotic suggestion can cause people to incorporate snakes and spiders in their dreams and this is thus a technique used to treat phobias sometimes.
Ancient Egyptians believed that people who dreamed vivid dreams were blessed and people during those times, would go to special sanctuaries with “dream beds” in the hope of receiving instructions or blessings during dreams.
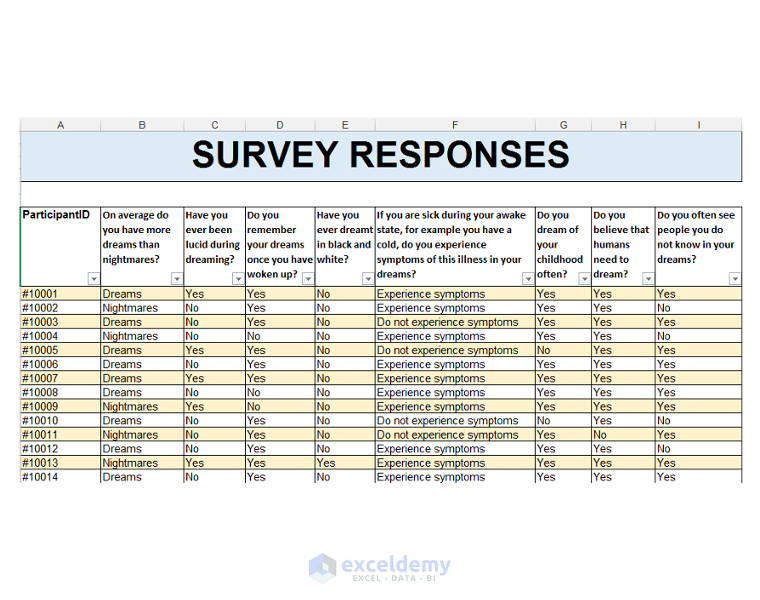
At a hypothetical university, a psychology major is doing an assignment on dreaming. The assignment involves interviewing a range of participants and giving them the following survey questions:
1) On average do you have more dreams than nightmares?
2) Have you ever been lucid during dreaming?
3) Do you remember your dreams once you have woken up?
4) Have you ever dreamt in black and white?
5) If you are sick during your awake state, for example, you have a cold, do you experience symptoms of this illness in your dreams?
6) Do you dream of your childhood often?
7) Do you believe that humans need to dream?
8) Do you often see people you do not know in your dreams?
The student has interviewed 270 people, so a Pivot Table would be ideal to summarize the data and gain insights. The data must be set up in a proper table or table-like range, for a Pivot Table to work properly. The psychology student has set up the data in an Excel Table.
The Source Data is shown below:
Read More: How to Drill Down in Excel Without Pivot Table
Creating the Pivot Table for Data Analysis
1) Make sure you are currently in a cell of the actual table, in other words, one of the cells of the table must be the active cell.
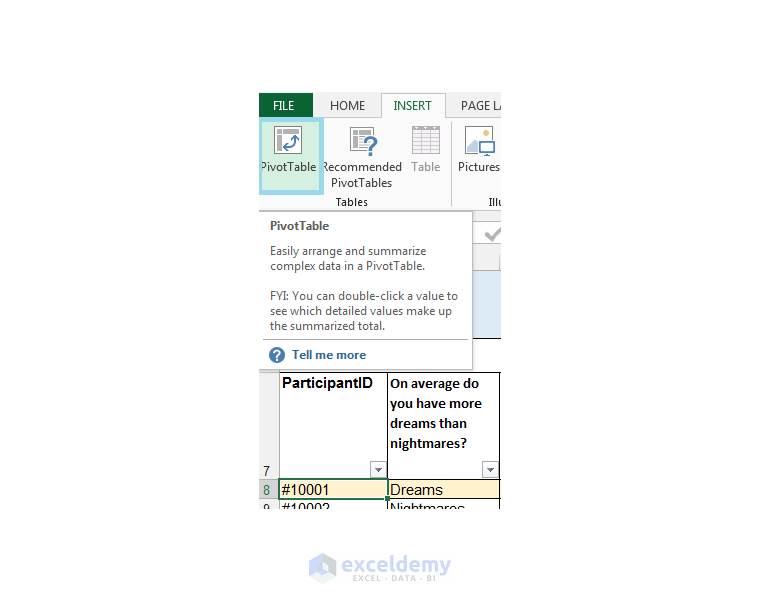
2) Go to the Insert tab.
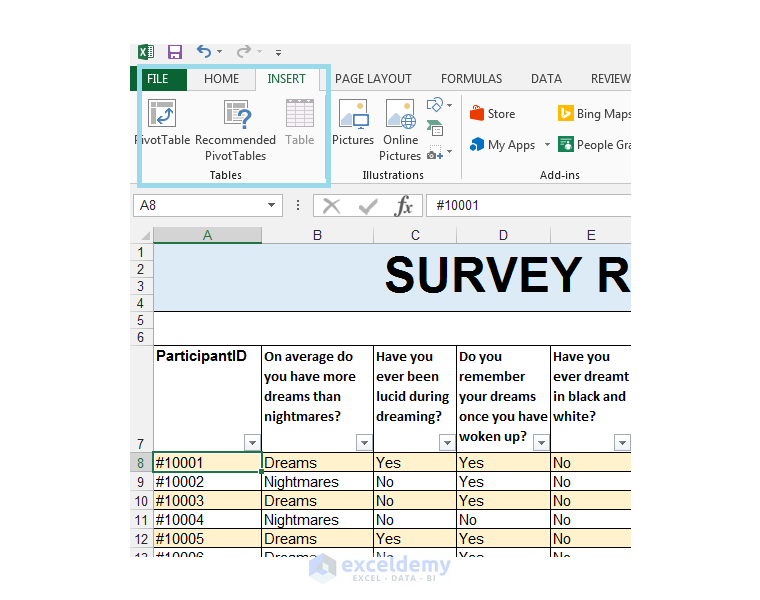
3) Click on PivotTable.
4) The Create PivotTable dialog box pops up. The table is already detected automatically by Excel. If for some reason, Excel does not select the correct range or table automatically, you can select the correct range manually. The default option is for the Pivot Table to be placed on a new worksheet, which for this example, you can leave as is.
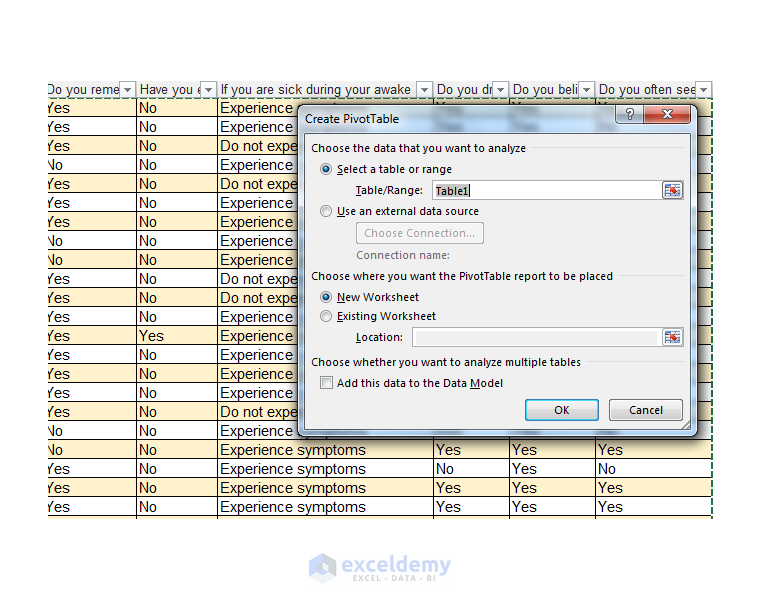
5) You should see the following as shown below. We are now ready to add fields to our Pivot Table.

6) We can now add fields to our Pivot Table, using the PivotTable Fields panel.
7) We add fields by dragging them to either the Columns, Rows, Filters, or ∑ Values sections of the PivotTable Fields dialog box.
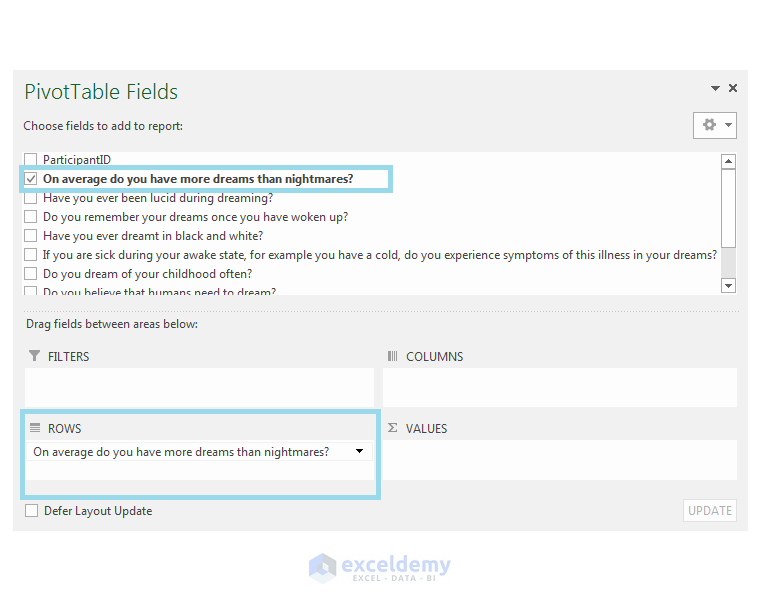
8) We are going to drag the On average do you have more dreams than nightmares? field to the Rows section, by dragging it to the Rows section as shown below.
9) We will drag the same field to the ∑ Values sections of the PivotTable Fields dialog box.
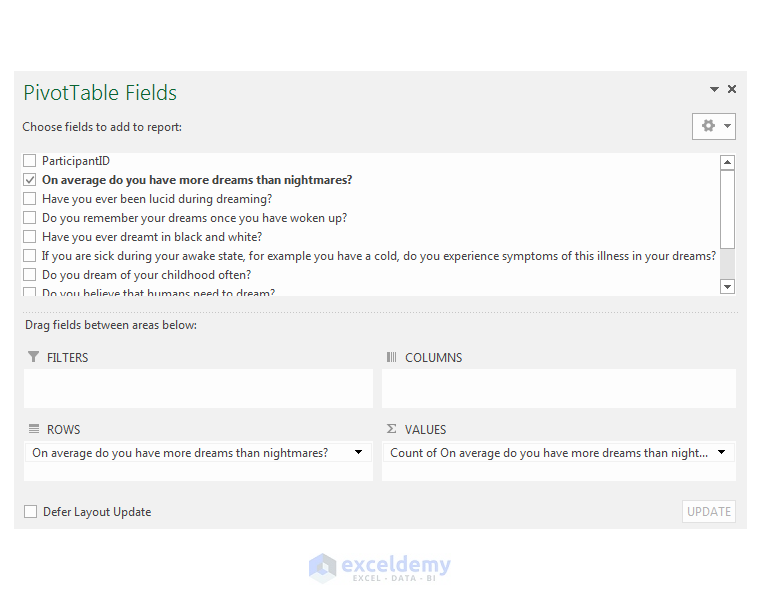
10) Since the text we are dealing with, Excel does a COUNT automatically in the ∑ Values section. If one is dealing with numbers, Excel does a SUM as the default option in the ∑ Values section.
11) The Pivot Table should now be updated as shown below, with the fields we added.

12) We already have our first observation using our Pivot Table, namely that most of the participants experienced more dreams on average than nightmares.
13) We can now change the Report Layout for this particular table to something a little bit more intuitive.
14) With a cell in the Pivot Table selected, in order to activate the context-sensitive PIVOTTABLE TOOLS option, select the Design Tab.
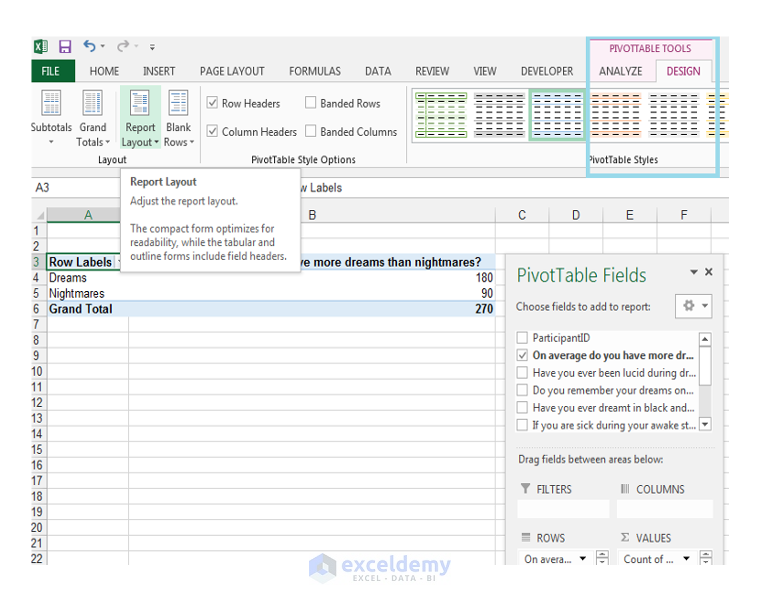
15) Select the drop-down arrow next to Report Layout in the Layout group.
16) Select Show in Outline Form.

17) We should now have the Report Layout shown below.

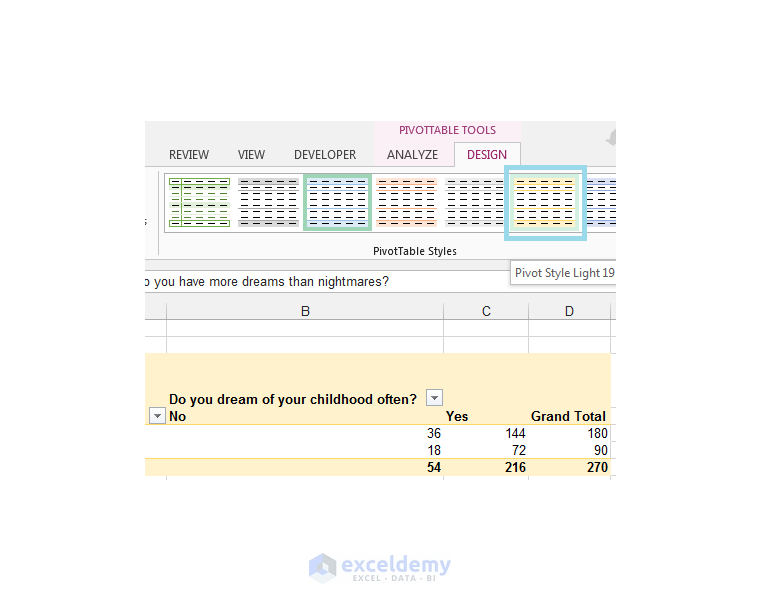
18) We are now going to add the Do you dream of your childhood often? field to the Columns section of the Pivot Table Fields dialog box, by clicking on it and dragging it as shown.
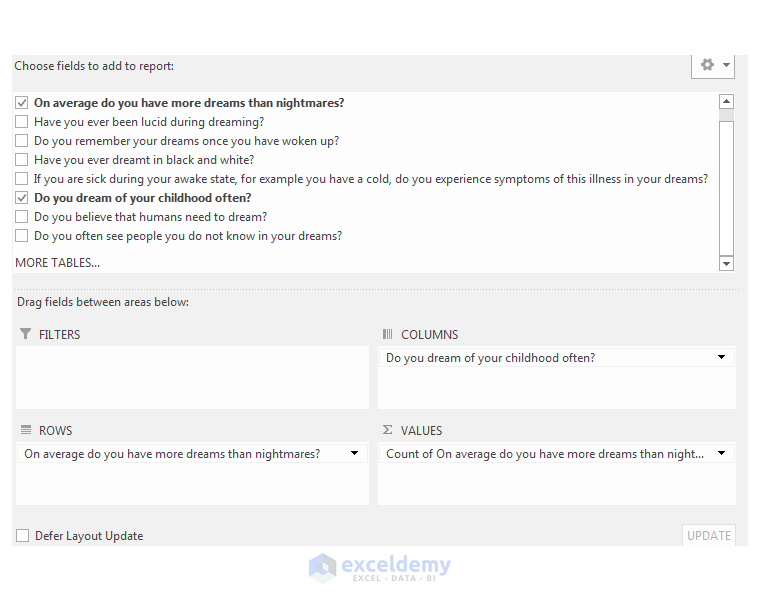
19) The Pivot Table should be updated as shown below.
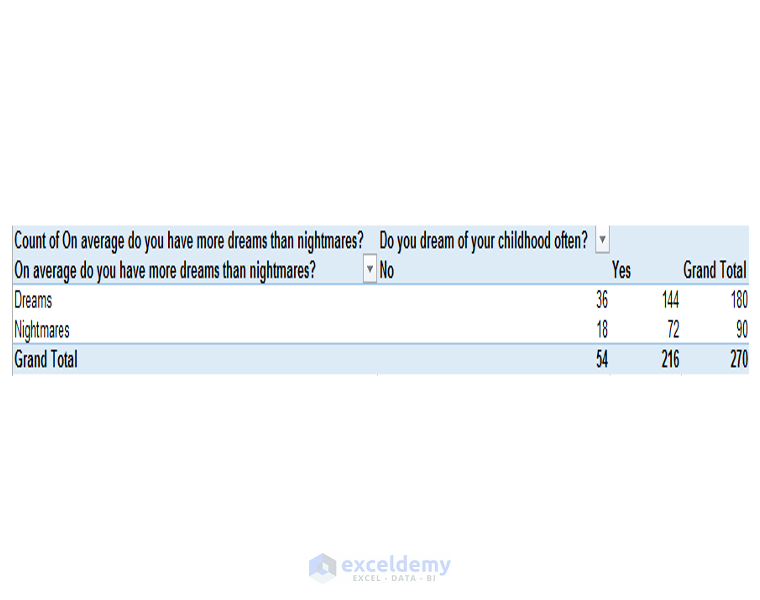
20) We can now make some preliminary observations from these results. We can see that dreams of childhood were a common theme in both the dreams and nightmares groups. The majority of participants often dreamed of their childhoods, whether the setting was a dream or a nightmare.
21) We now are going to tidy the Pivot Table up a little bit.
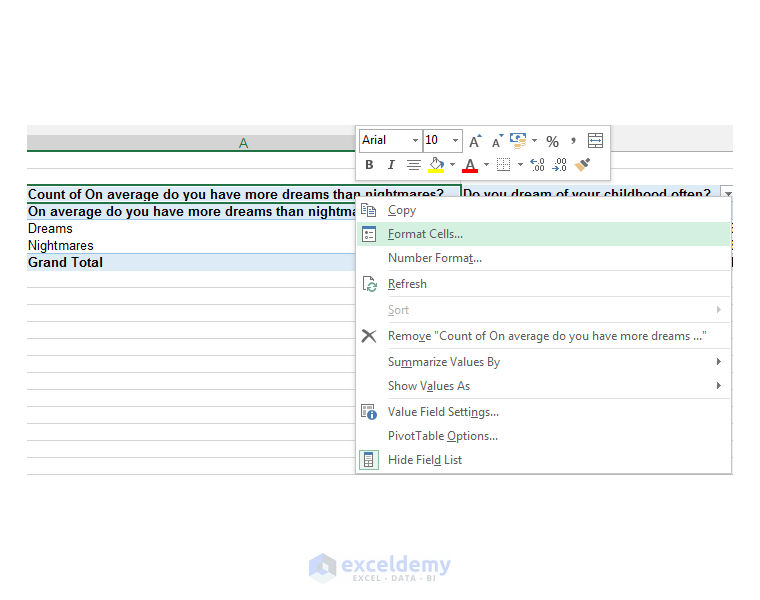
22) We are going to use custom formatting on the Count of On average do you have more dreams than nightmares? cell in the Pivot Table.
23) Right-click this cell, and choose Format Cells.
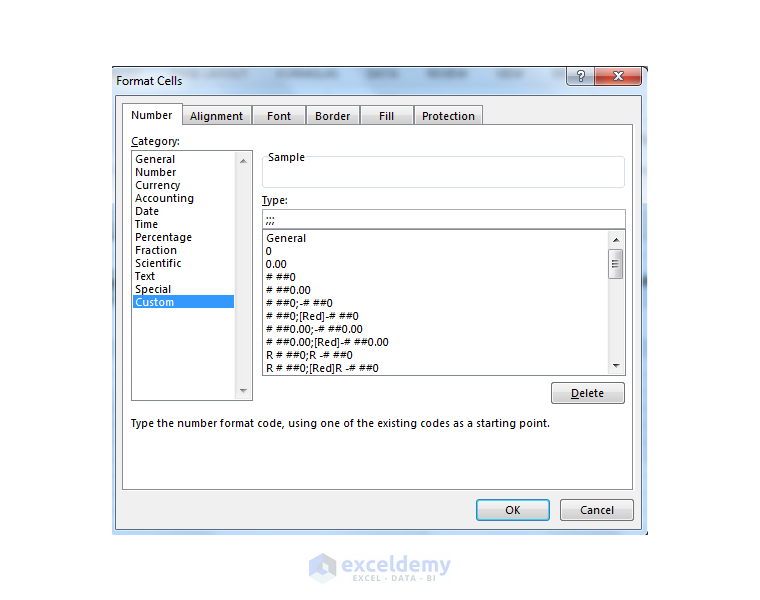
24) Choose Custom from the list of options in the Format Cells dialog box.

25) Instead of general, type three semi-colons and click Ok.
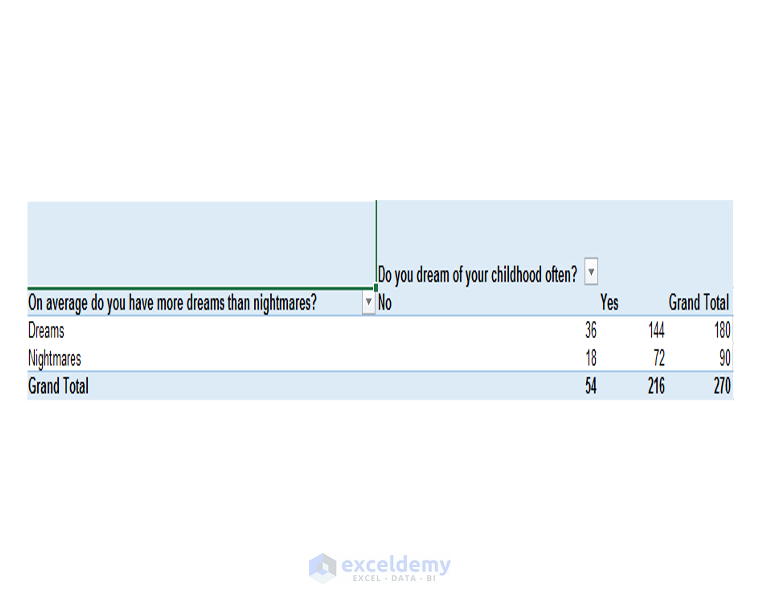
26) Now that the heading is still there, but not visible as shown below. This is a handy way to hide headings that may be confusing without changing the Pivot Table structure.
27) Now with a cell in the Pivot Table still selected, go to the Design tab, in the PivotTable Styles group, select Pivot Table Style Light 19, to apply this style to the Pivot Table.
28) In the PivotTable Style Options group, check the Banded Rows option.

29) The Pivot Table should now have the following style applied. Thus, we create a Pivot Table for meaningful data analysis.

Read More: How to Compare Two Pivot Tables in Excel
Download Working File
Conclusion
The Pivot Table is ideal for data analysis, presenting large amounts of data from reports, surveys, and tables in a professional format that delivers insights. There are many Pivot Table features and calculations that one can access. Please feel free to comment and tell us if you use Pivot Table for data analysis and insights.
Mini-task for the widget
Please feel free to participate and answer these questions for the Pivot Table widget on dreaming that we are going to put up on our site:
1) How long is the length of a standard dream of yours? (Give a rough estimation in minutes)
2) On average do you have more dreams than nightmares?
3) Have you ever been lucid during dreaming?
4) Do you remember your dreams once you have woken up?
5) Have you ever dreamt in black and white?
6) If you are sick during your awake state, for example, you have a cold, do you experience symptoms of this illness in your dreams?
7) Do you dream of your childhood often?
8) Do you believe that humans need to dream?
9) Do you often see people you do not know in your dreams?
We are going to make a Pivot Table from our commentator’s responses and pin this on the website.
<< Go Back to Pivot Table Analyze | Pivot Table in Excel | Learn Excel
Get FREE Advanced Excel Exercises with Solutions!
