What Does “Drill Down” Mean in Excel?
Drilling down refers to delving into something thoroughly. In Excel, drilling down allows you to seamlessly transition from a summarized perspective to a more detailed examination of the data set. Typically, when dealing with extensive data sets, we utilize Pivot Tables and Subtotal functionalities to condense the data based on various criteria.
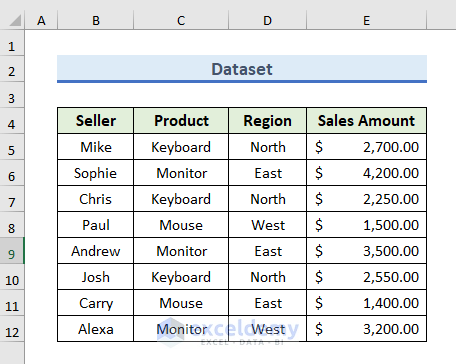
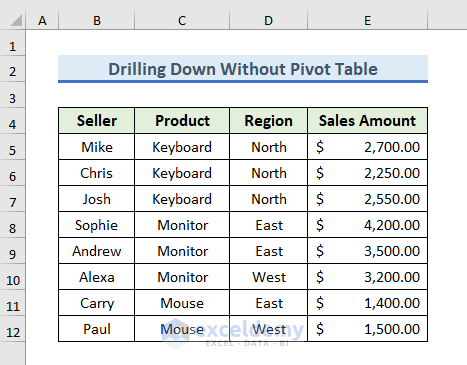
To illustrate this process, let’s consider a data set containing sales information for multiple sellers. We’ll organize the data, employing the Subtotal feature to ascertain the total sales for each product and region. Subsequently, we’ll drill down from the summarized view, utilizing the Subtotal feature instead of a Pivot Table.
Step 1 – Prepare Your Dataset
- Ensure your dataset is ready and select any cell within it.
Step 2 – Sort Your Data
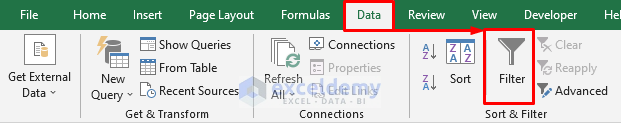
- Go to the Data tab and choose Filter from the Sort & Filter group.
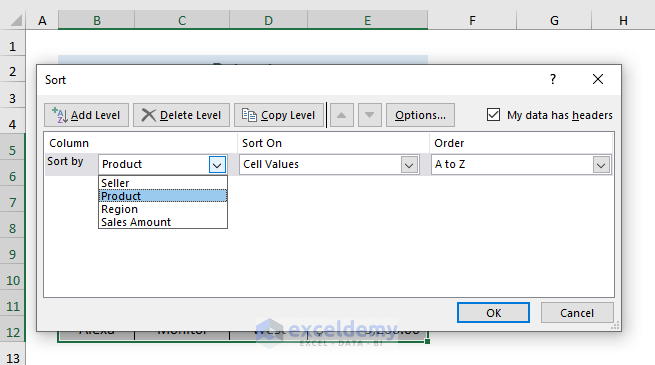
- In the Sort window, sort the data by the Product column in ascending order (select Product, Cell Values, and A to Z).
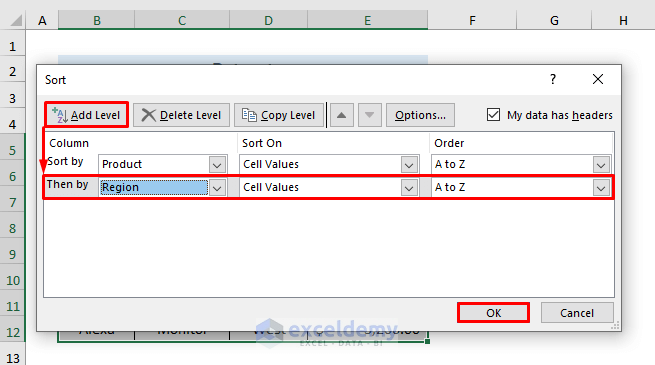
- Add another level by selecting Add Level.
- Sort the data by the Region column (select Region in the Then by field of the new level and select Cell Values and A to Z).
- Click OK to apply the sorting.
- The dataset will look like this:
Read More: How to Compare Two Pivot Tables in Excel
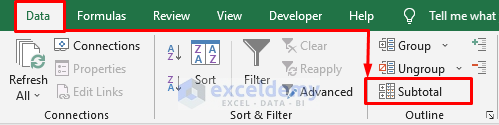
Step 3 – Add Subtotal
- Still in the Data tab, select Subtotal from the Outline group.
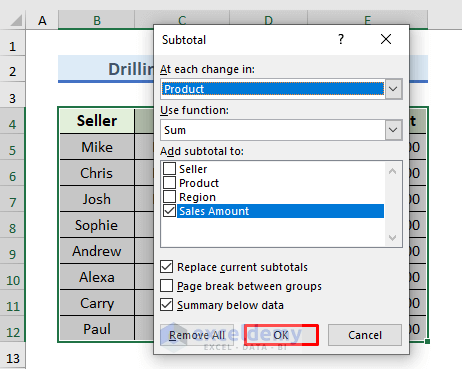
- In the Subtotal window:
- Choose Product in the At each change in field (since we have grouped by product).
- Use the Sum function to calculate total sales.
- Select Sales Amount to display the sales amount for each group.
- Check Replace current subtotals and Summary below data.
- Click OK to add the first subtotal.
-
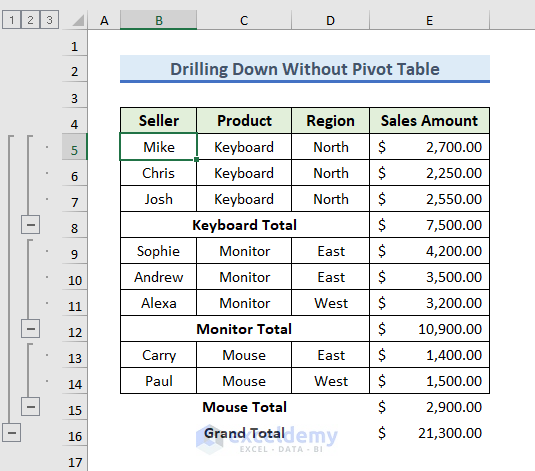
- We have successfully added the first Subtotal of the dataset.
- We can observe the Sales Amount based on Products.
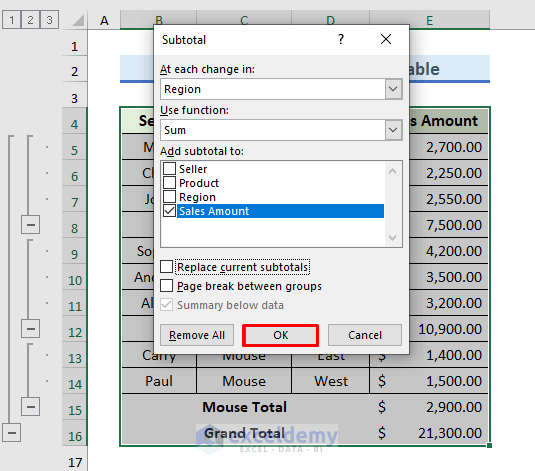
- Second Subtotal:
- Again, select Subtotal from the Data tab.
- Choose Region in the At each change in field.
- Select Sum and Sales Amount.
- Deselect Replace current subtotals.
- Click OK to add the second subtotal.
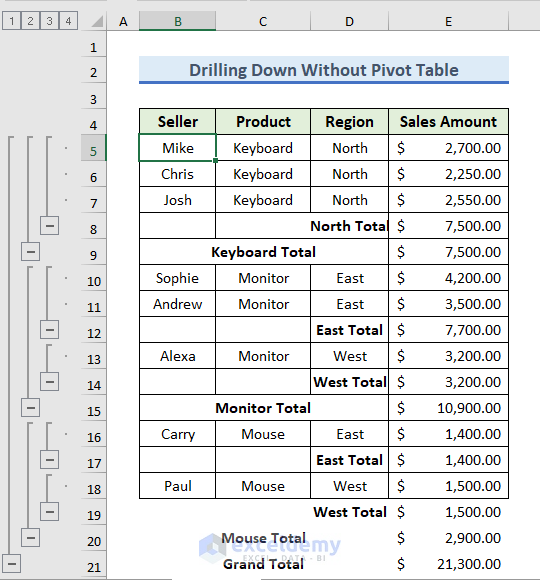
-
- We can observe the Sales Amount based on Products and Region.
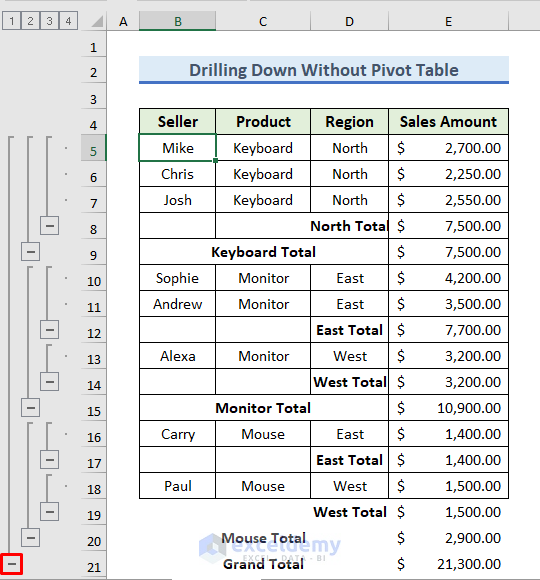
Step 4 – Drill Down Using Plus (+) Icon
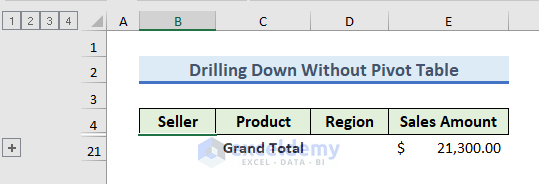
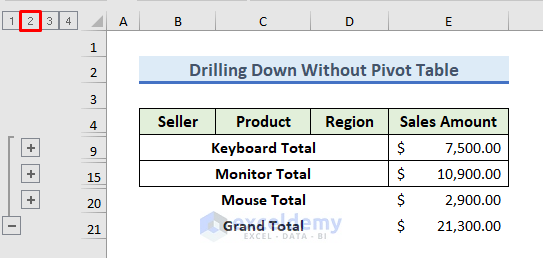
- To view the summary only, click the “–” icon or the tab labeled 1 (Grand Total).
- For the second layer summary, click the tab labeled 2.
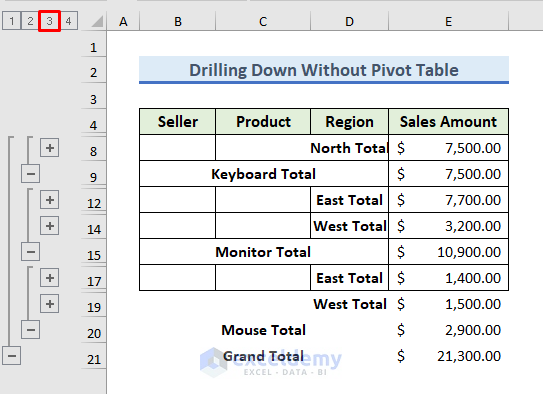
- To drill down further, click the tab labeled 3 for the third layer summary.
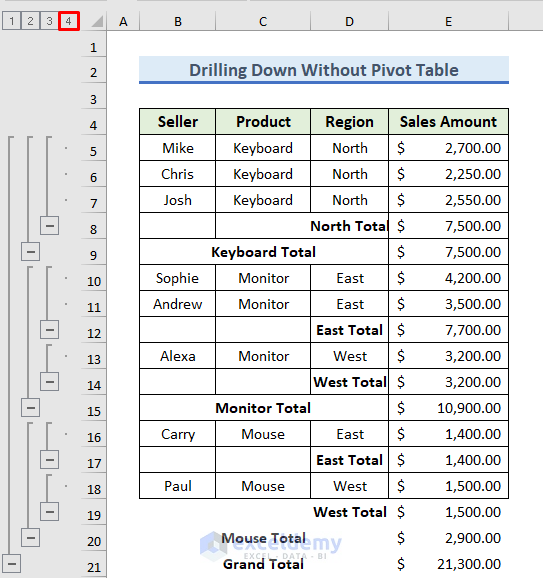
- Return to the original dataset by clicking the tab labeled 1.
Download Practice Workbook
You can download the practice workbook from here:
<< Go Back to Pivot Table in Excel | Learn Excel
Get FREE Advanced Excel Exercises with Solutions!
