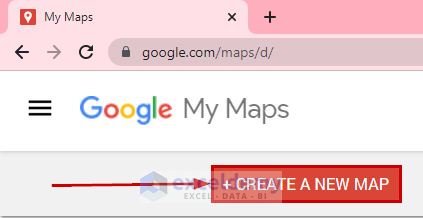
Step 1 – Access Google My Maps
- Visit the Google My Maps website.
- Click Create a New Map to begin customizing your territories.
Step 2 – Set Up Layers for Your Map
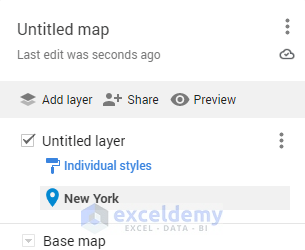
- Use the search box to find a specific location (e.g., New York City).
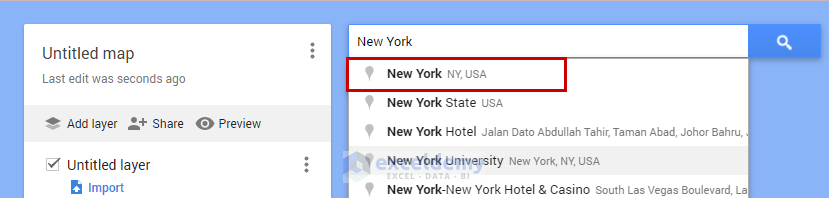
- Click on the city to view it on the map.
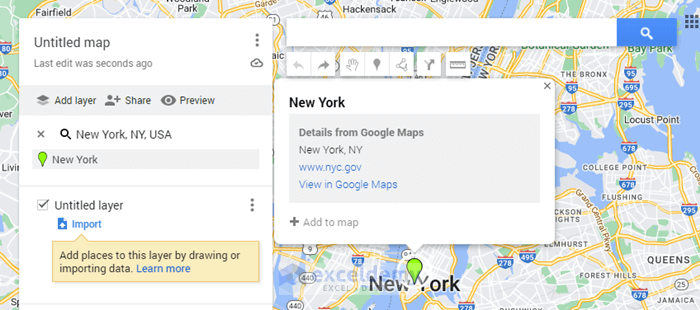
- Remove any existing green indicators by clicking the plus (+) sign.
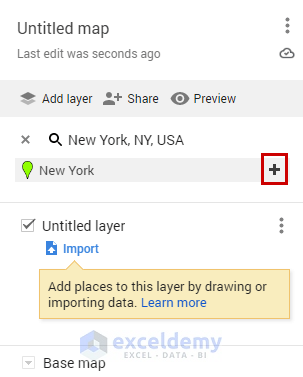
- The blue location icon will now represent your chosen area.
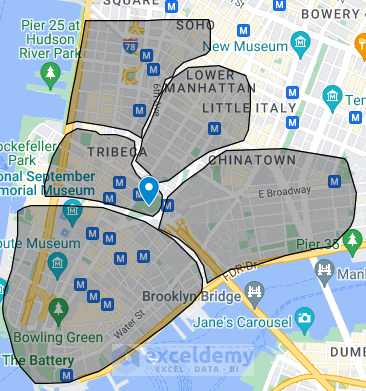
Step 3 – Define Custom Territories
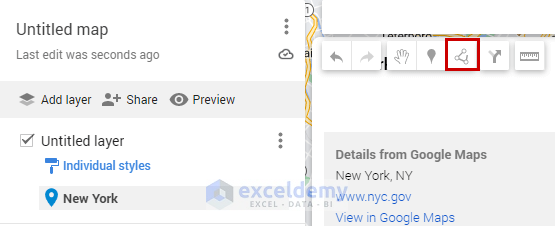
- Under the Search Bar, locate the Draw a line option.
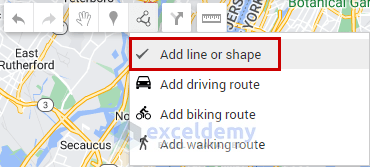
- Choose Add line or shape from the drop-down menu.
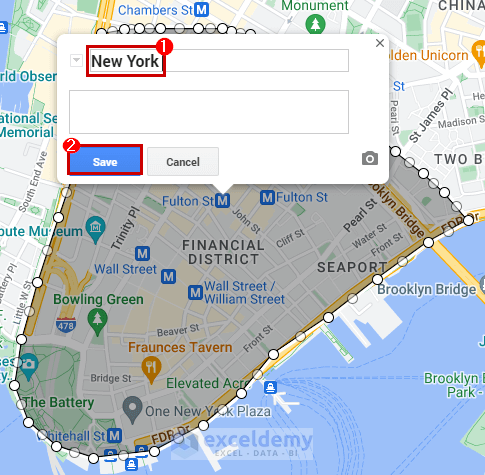
- Use the cursor to draw polygons by connecting angular positions.
- Title each customized region (e.g., New York).
- Zoom in for accuracy.
- Save your work.
- Follow the earlier step to continue creating and titling all the customized regions.
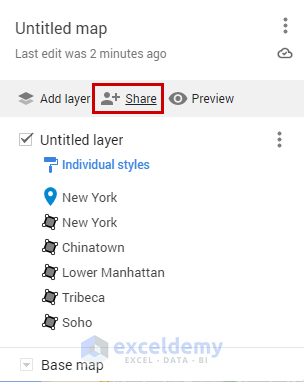
Step 4 – Share Your Created Map
- Click Share.
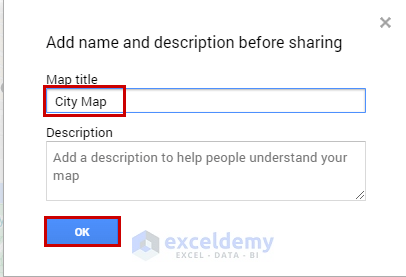
- Add names and descriptions.
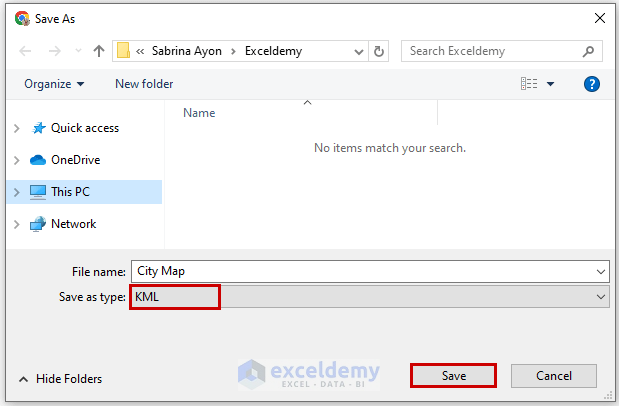
- Specify the map title (e.g., City Map).
- Click OK.
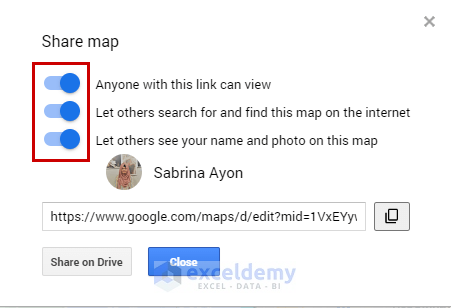
- Enable sharing options.
- Click Close to complete the process.
Read More: How to Enable 3D Maps in Excel
Step 5 – Export KML File for Custom Regions in 3D Maps
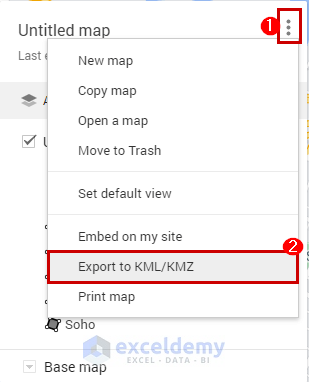
- Click on the three dots located on the right side of the Untitled map.
- From the vertical menu, select Export to KML/KMZ.
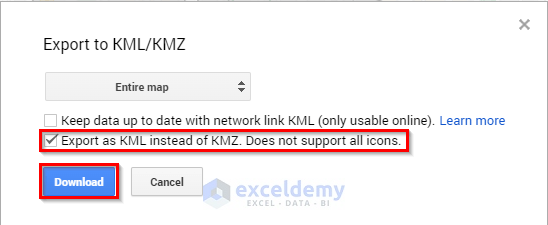
- In the download window, ensure you choose Export as KML (instead of KMZ) to maintain compatibility with custom regions in Excel 3D maps.
- Click the Download button.
- Save the file to your desired folder.
Step 6 – Open 3D Maps in Excel
- Access your Excel workbook.
- Open a blank sheet.
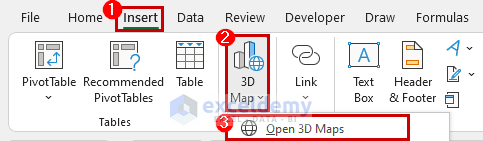
- Go to the Insert tab on the ribbon.
- Under the Tour category, click the 3D Maps drop-down menu and select Open 3D Maps.
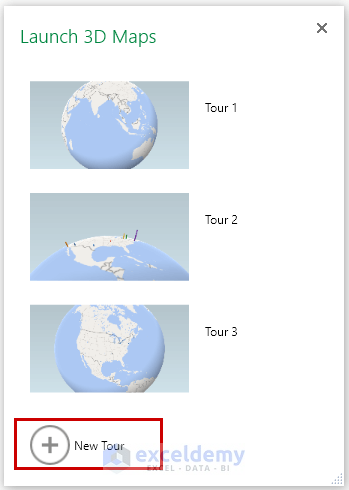
- The Launch 3D Maps dialog box will appear.
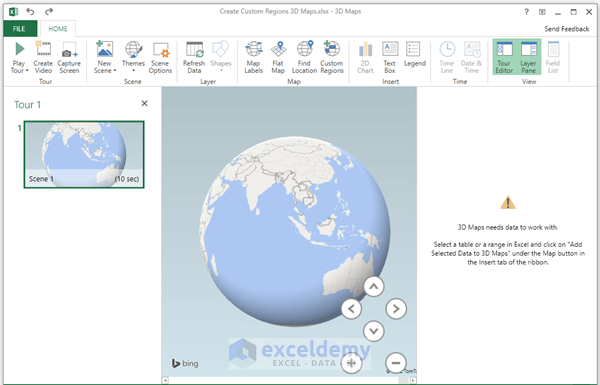
- Click New Tour to display the workbook 3D Maps window.
Read More: How to Change Data Source of Excel 3D Maps
Step 7 – Create Custom Regions
- In the 3D Maps window, go to the Home tab on the ribbon.
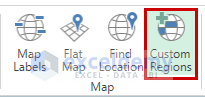
- Click the Custom Regions menu within the Map group.
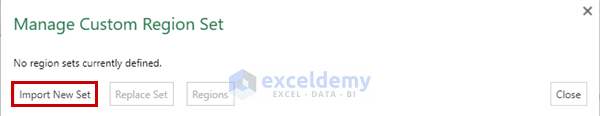
- The Manage Custom Region Set dialog box will appear.
- Click Import New Set.
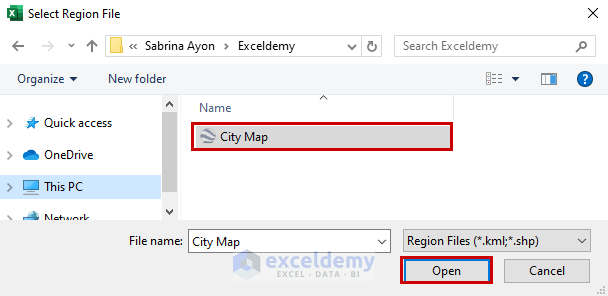
- Navigate to the folder where your spreadsheet data is saved.
- Select the KML file created using Google My Maps and click Open.
- Or instead of clicking on the Open button, you can select the file and double-click on the file to import it to create the map.
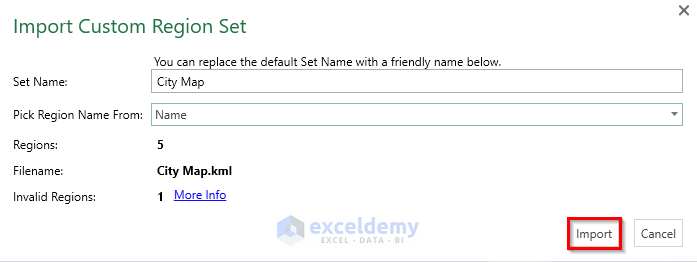
- The Import Custom Region Set window will pop up.
- Click Import.
- Return to Custom Regions and choose the City Map region set.
- Click Regions.
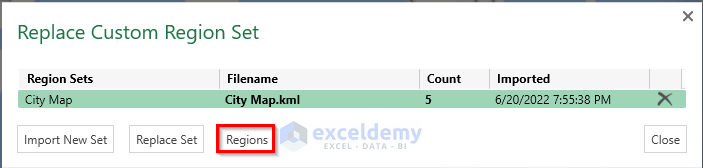
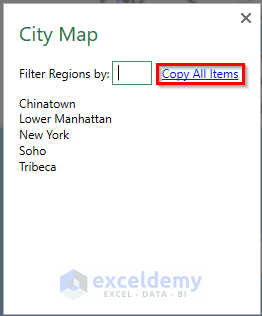
- The City Map window will appear.
- Click Copy All Items.
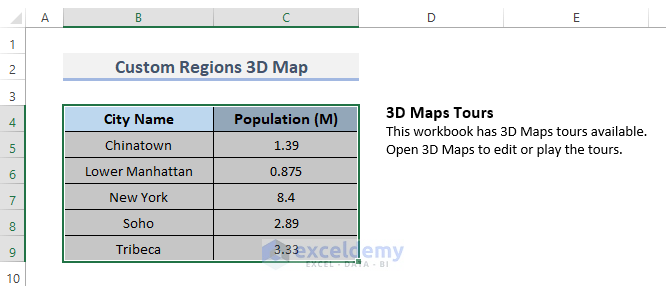
Step 8 – Prepare Your Excel Workbook
- Paste the copied data from the City Map into your Excel workbook.
- Add a title, headings, and include the population column as needed.
- Highlight the entire dataset.
Step 9 – Generate 3D Visualization with Customized Data
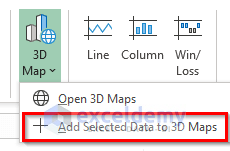
- Go to the Insert tab on the ribbon.
- Under the Tour group, click the 3D Maps drop-down menu.
- Select Add Selected Data to 3D Maps (ensure the data is selected).
- You’ll be taken back to the 3D Maps window.
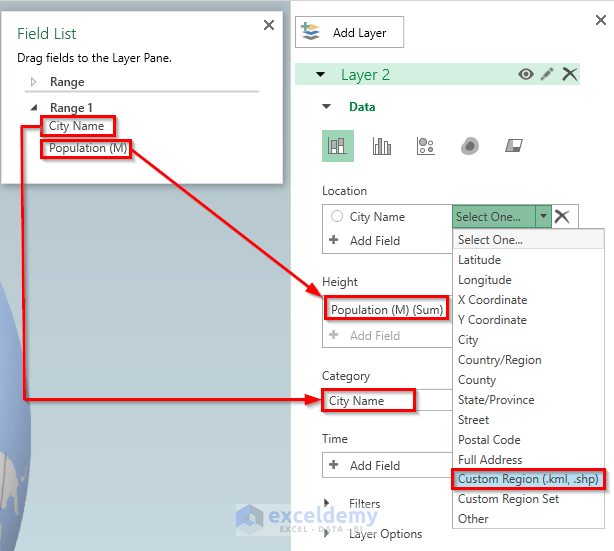
- Drag the Population (M) from the Field List (Range1) to the height section of the map.
- Similarly, drag City Name as the category for your map.
- In the Location option, choose Custom Region (.kml, .shp).
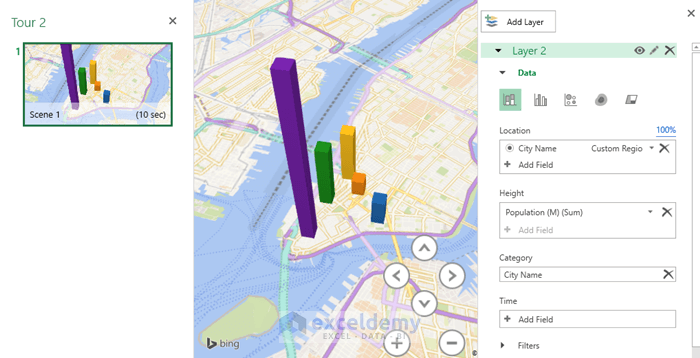
Final Output
You’ll now be able to view custom regions in Excel 3D maps. Feel free to adjust color and opacity settings as needed.
Download Practice Workbook
You can download the practice workbook from here:
Related Articles
<< Go Back to Excel Power Map | Learn Excel
Get FREE Advanced Excel Exercises with Solutions!

I tried following along until I got to the part where I need to set my regions. The REGIONS button is missing. What do I do?
Hello, DEMI!
Please follow step 7, you will surely get the Regions button. If you miss any of those steps you won’t get the result. Follow each instruction step by step hopefully, you will find the Regions button.
https://www.exceldemy.com/create-custom-regions-in-excel-3d-maps/#Step_7_Create_Custom_Regions
Good Luck!