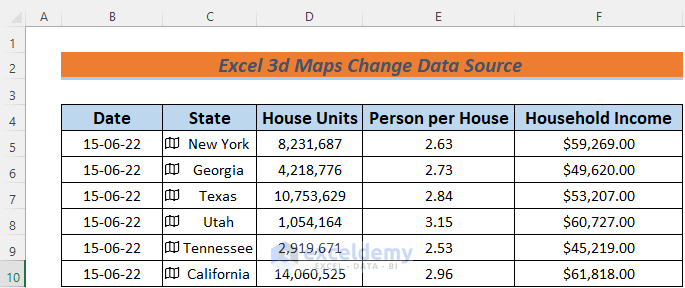
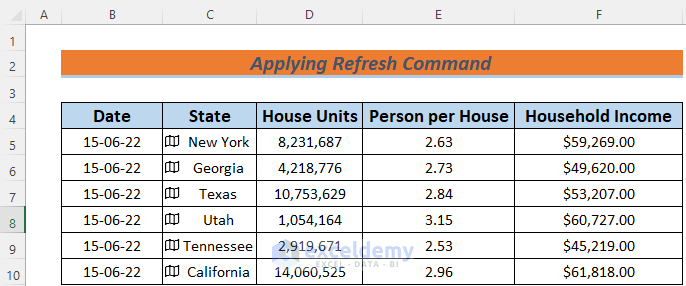
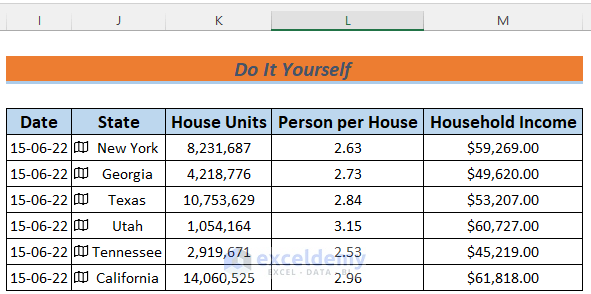
We have a sample dataset with information about housing in different U.S. States.
Method 1 – Applying the Refresh Command to Change the Data Source of Excel 3D Maps
Steps:
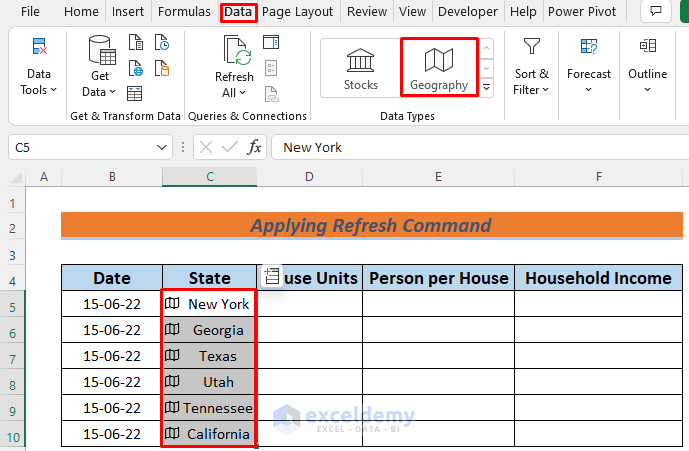
- Convert the States into Geography.
- Insert today’s date with the help of the TODAY Function:
=TODAY()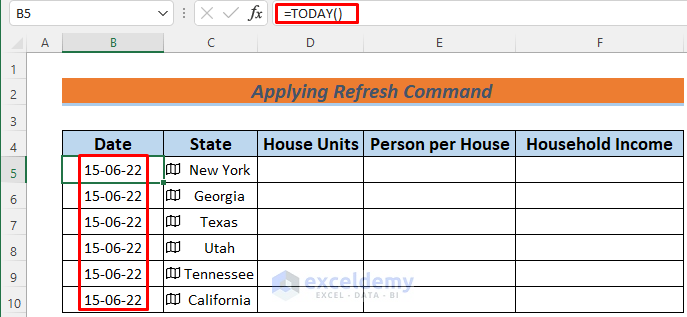
- Using the marked icon, select the data to insert them.
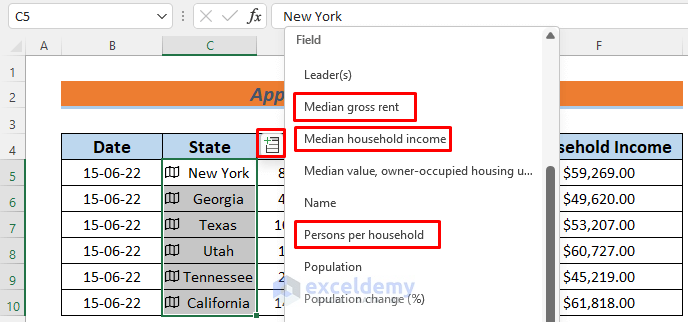
Your dataset now looks like the following picture.
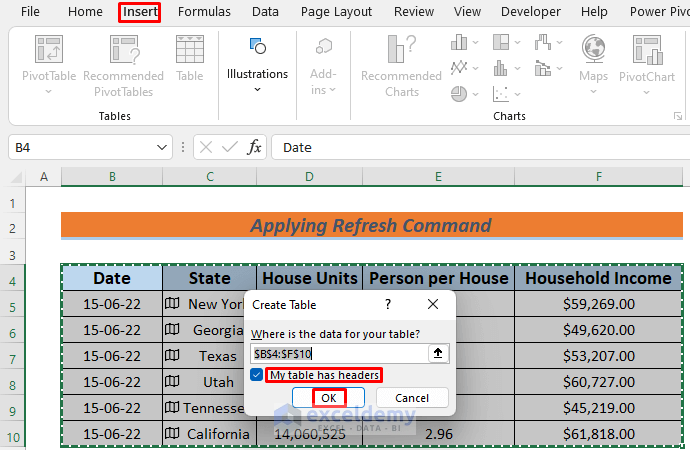
- Select the range B4:F10.
- Go to Insert and choose Table.
- Make sure you select My table has headers.
- Click OK.
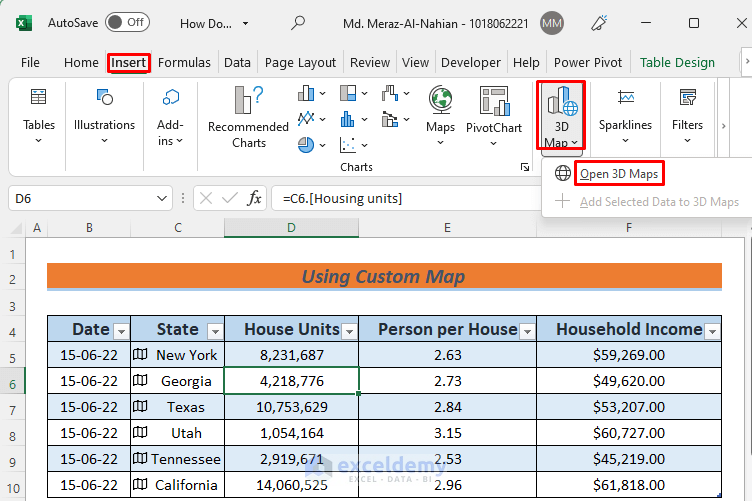
- Select any cell of your table.
- Go to Insert, then select 3D Map and choose Open 3D Map.
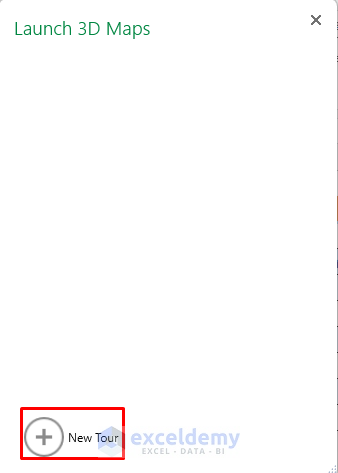
- The Launch 3D Maps window will appear.
- Select New Tour.
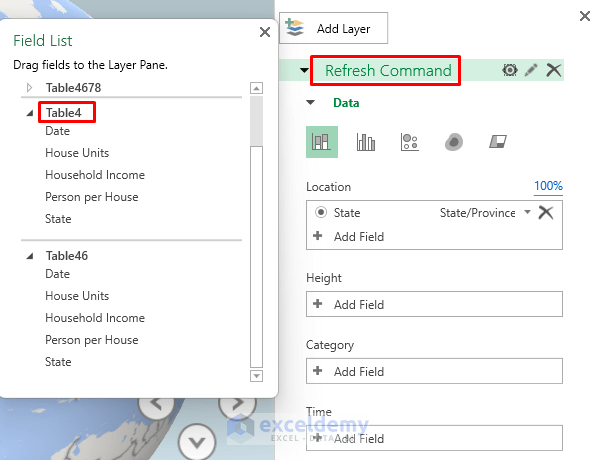
- The 3D Map window will show up. Rename the Layer if you want. We named this layer Refresh Command.
- We are working on Table4, so we will be using the data from this table.
- Drag the Date to the Time Field.
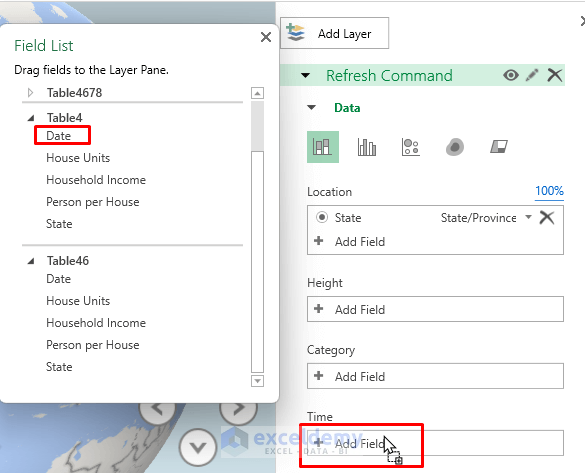
- Drag other necessary headers to other fields in the same way.
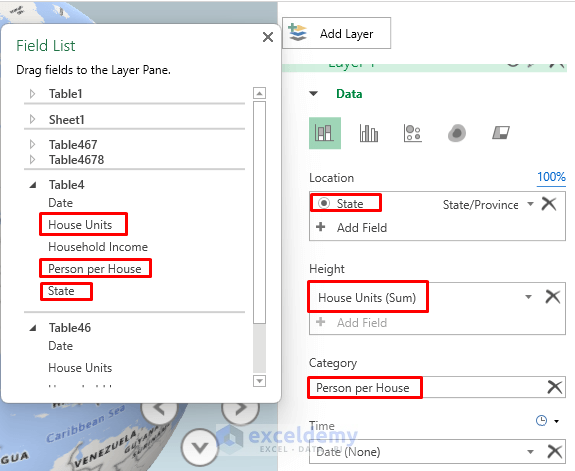
- You can see the Category data in the legend which is Person per House.
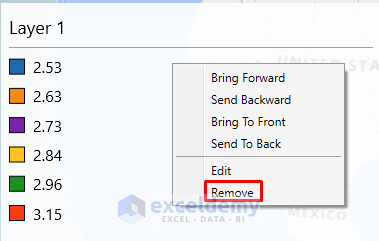
- The legend can be removed.
- You will see the data according to the States in your 3D Map.
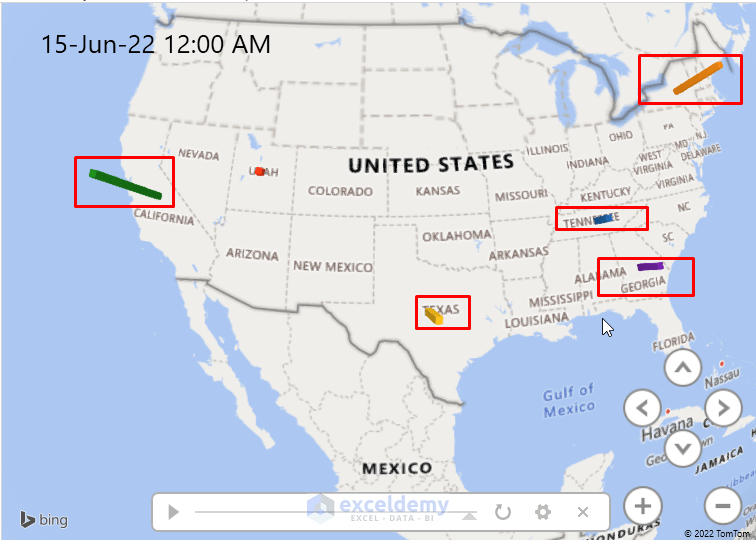
- To change the data source with time, select the Home Tab of the 3D Map window and click Refresh.
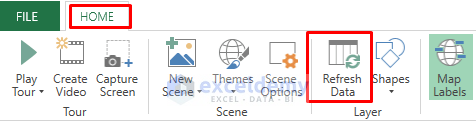
This will update the data of your 3D Map. You may not see any changes in a short period.
Read More: How to Enable 3D Maps in Excel
Method 2 – Using Custom 3D Maps to Change the Data Source in Excel
Steps:
- Convert your data into a table and launch a 3D Map tour like in Method 1.
- In the Home Tab of the 3D Map window, from New Scene, select New Custom Map.
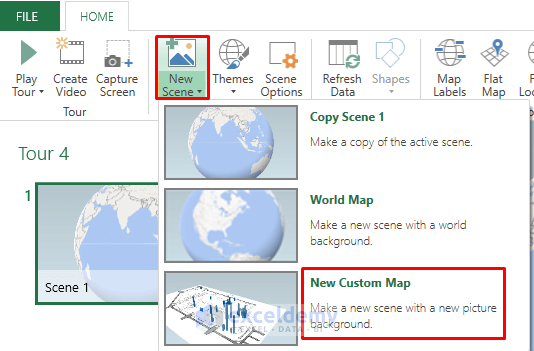
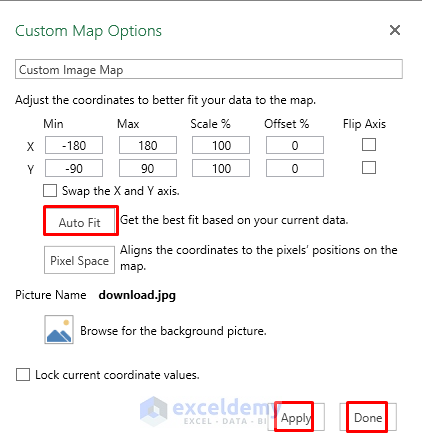
- Name your Custom Map and browse for the image you want to upload as your map.
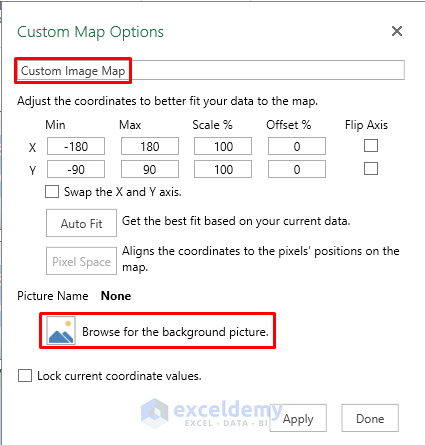
- Select Auto Fit and click on Apply and Done.
- Select Field List. We are working on Table 46 now, so we chose this.
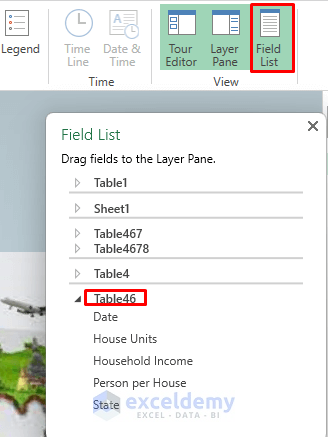
- Add the necessary headers in the Fields of your Map Layer as we did in Method 1.
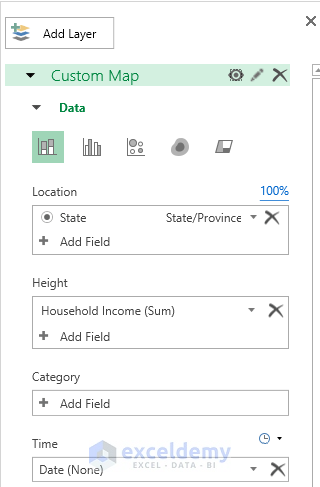
- You will see the added data in fields appear on the Custom Map.

- Click on the Refresh command like in Method 1.
Read More: How to Create Custom Regions in Excel 3D Maps
Practice Section
We’re giving you the dataset of this article so that you can practice these methods on your own.
Download the Practice Workbook
Related Articles
<< Go Back to Excel Power Map | Learn Excel
Get FREE Advanced Excel Exercises with Solutions!
