Watch Video – Create a Timeline with Dates in Excel
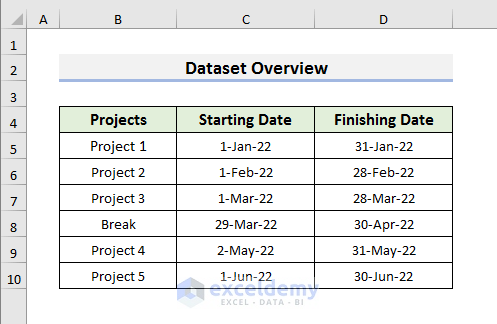
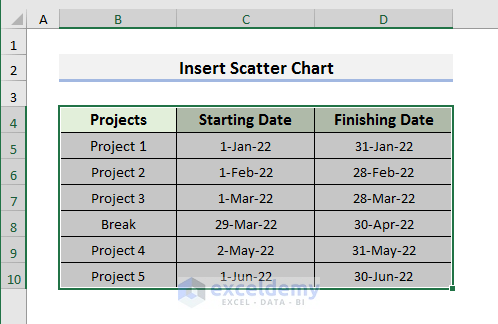
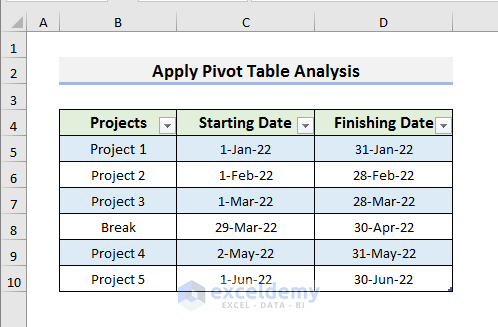
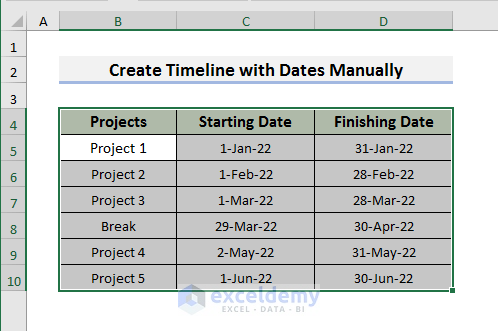
The dataset below contains information about a company’s projects. It contains the Starting Date and the Finishing Date of each project. We will try to create a timeline using this dataset.
Method 1 – Generating a Timeline with Dates Using SmartArt in Excel
STEPS:
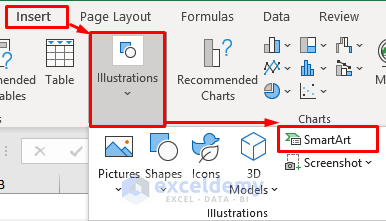
- Select Insert, and select Illustrations. A drop-down menu will open.
- Select SmartArt from the drop-down menu. It will open the SmartArt Graphic window.
- Select Process, and select the Basic Timeline icon.
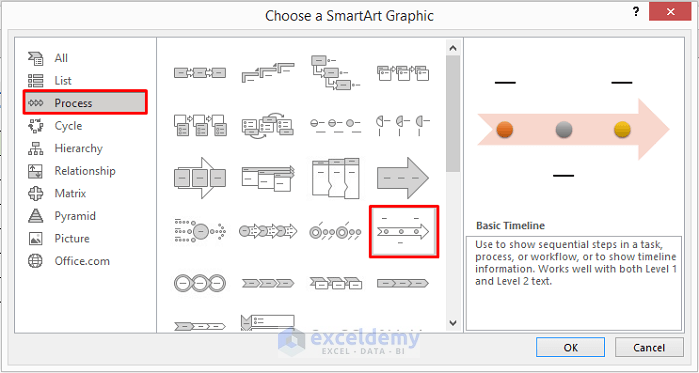
- Click OK to proceed.
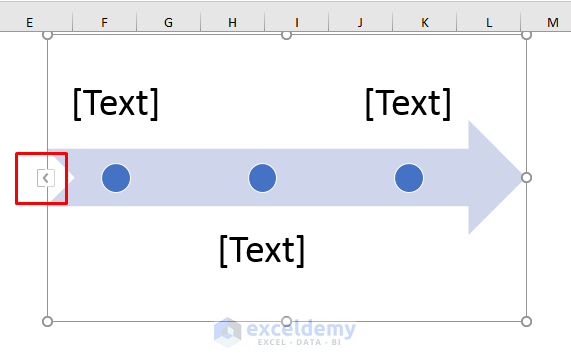
- The timeline will appear on the worksheet.
- Select the less than (<) symbol.
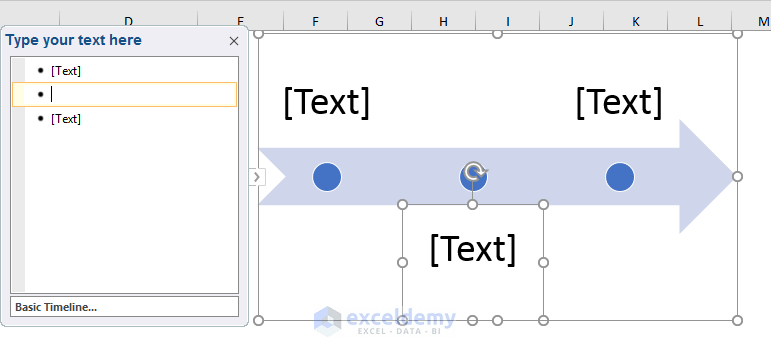
- A new box will appear.
- Press Enter to add more solid circles to the timeline. To complete the timeline, we need a total of 6 solid circles.
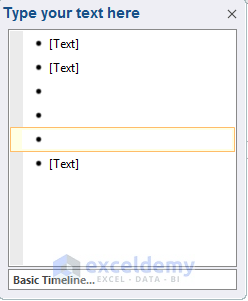
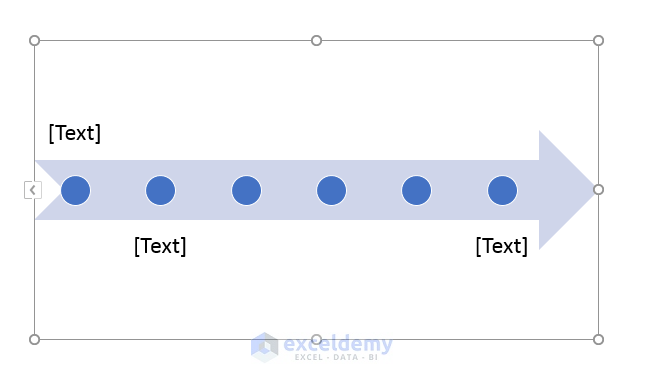
- After adding the solid circles, the timeline will look like the picture below.
- Enter your text in the ‘Type your text here’ in order.
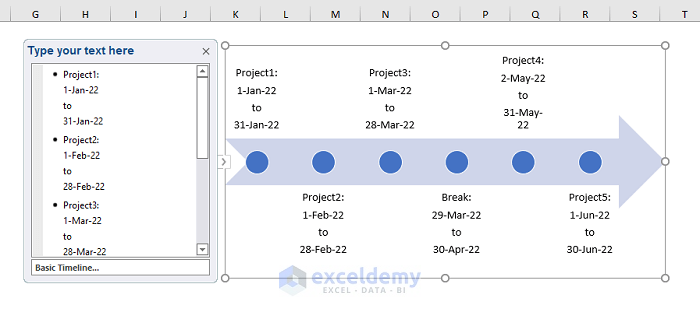
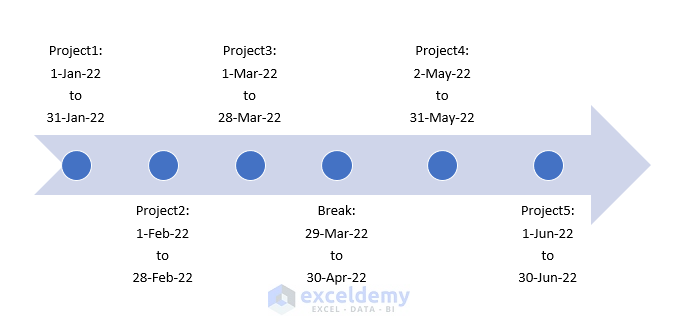
- Click anywhere in the sheet to see a timeline with dates like the picture below.
Read More: How to Create a Project Timeline in Excel
Method 2 – Inserting a Scatter Chart to Create a Timeline with Dates
STEPS:
- Select any dataset cell and press Ctrl + A to select all the used cells.
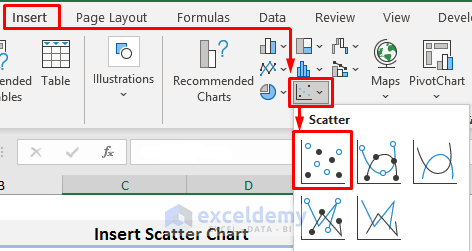
- Go to the Insert tab and select the Scatter Chart icon. A drop-down menu will open.
- Select the first icon from the drop-down menu.
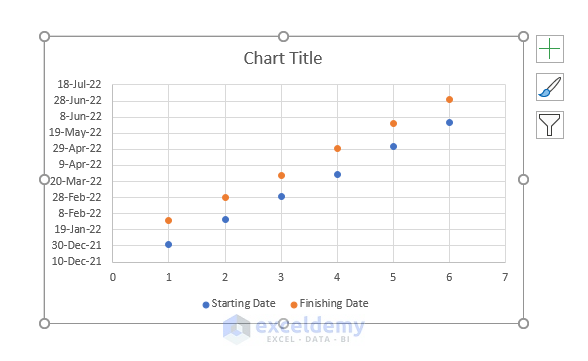
- You will see a plot on your worksheet, like the picture below.
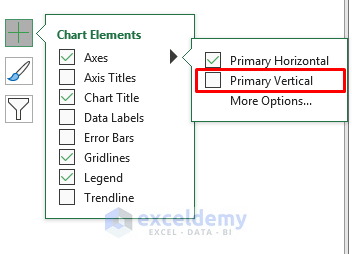
- Click on the plus (+) sign.
- Select Axis, and deselect Primary Vertical.
- Click on the plus (+) sign.
- Select Axis Titles and deselect Gridlines.
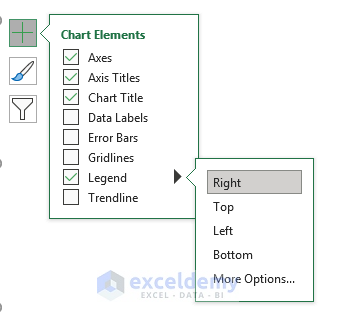
- Select Legend >> Right.
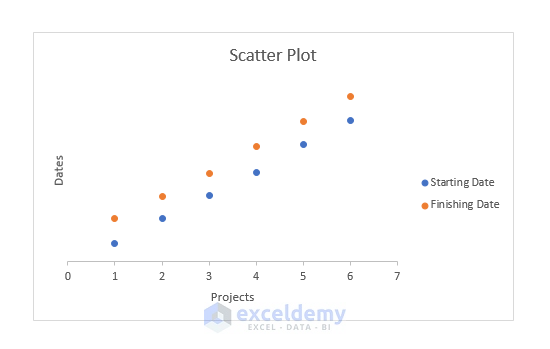
- Change the titles and make the graph more understandable.
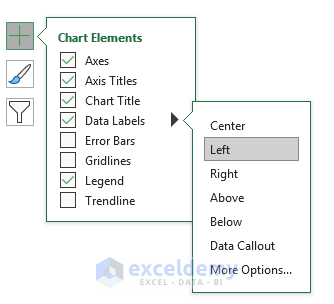
- Click on the plus (+) icon and select Data Labels > Left.
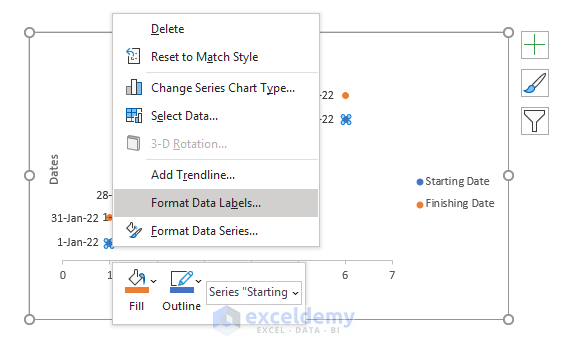
- Click on a starting date point and right-click on it. A menu will open.
- Select Format Data Labels.
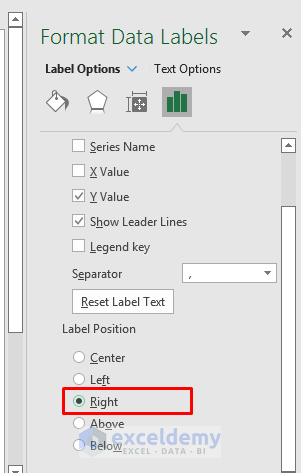
- The Format Data Labels option will appear on the right side of the screen.
- Select Right in the Label Position category.
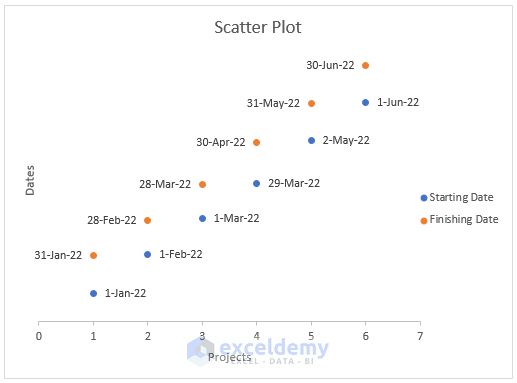
- You will see a timeline with dates like the screenshot below.
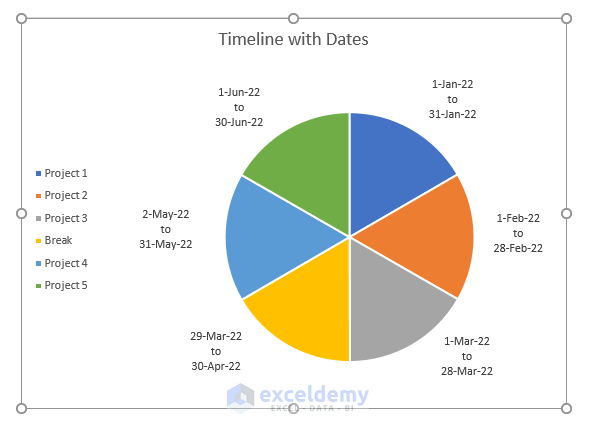
- You can also use the Pie Charts to create a timeline like below.
Read More: Create a Timeline in Excel with Milestones
Method 3 – Applying an Excel Pivot Table Analysis to Make Timeline with Dates
STEPS:
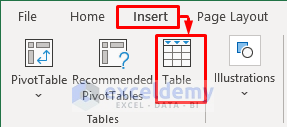
- Select a cell in your dataset and select Insert >> Table.
- Alternatively, you can press Ctrl + T.
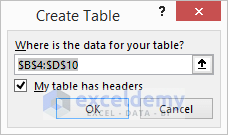
- Click OK in the Create Table dialog box. Make sure you select the ‘My table has headers’ box.
- Your table will be like the picture below.
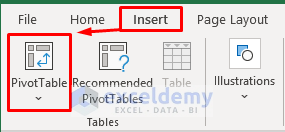
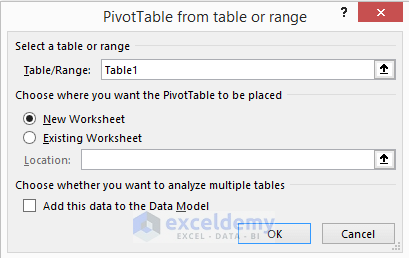
- Select Insert >> PivotTable.
- A dialog box will pop up. Click OK to proceed.
- The PivotTable Fields will appear on the right side of a new sheet.
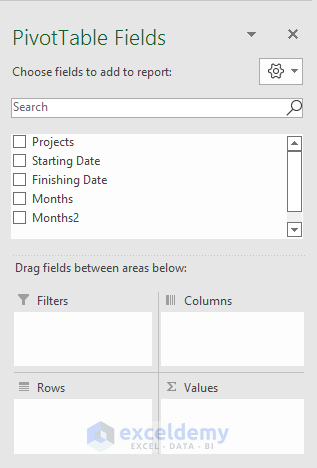
- Select Projects, Starting Date, Finishing Date, Months, & Months2.
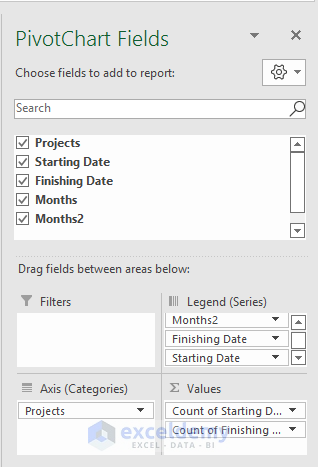
- Drag the Months, Months2, Starting Date, and Finishing Date fields in the Legend (Series) box.
- Drag the Starting Date and Finishing Date fields in the Values box.
- Make sure the Projects field is in the Axis (Categories) box.
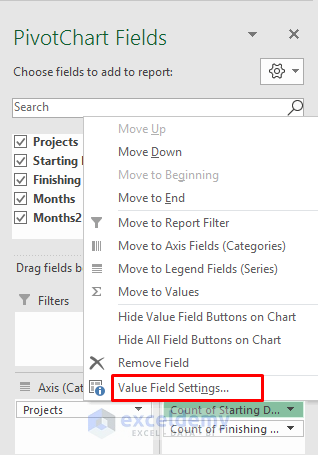
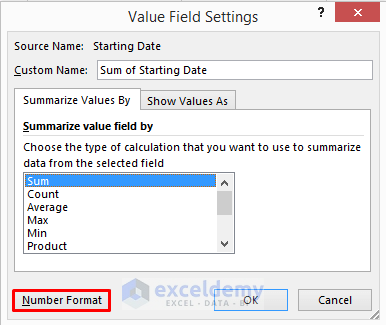
- Right-click on the Count of Starting Date and select Value Field Settings.
- In the Value Field Settings window, select Sum and select Number Format. It will open the Format Cells window.
- In the Format Cells window, select Date and select the 14-Mar-12 format.
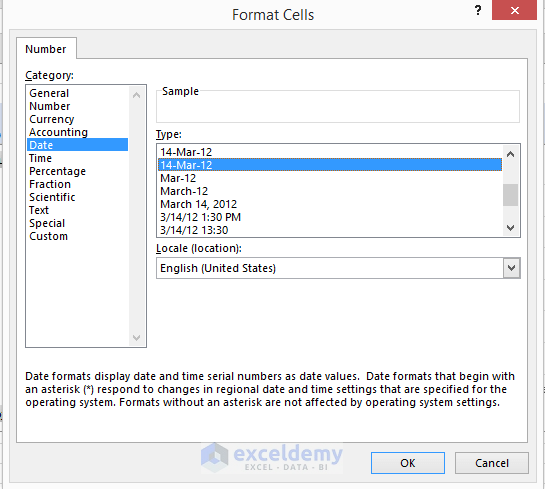
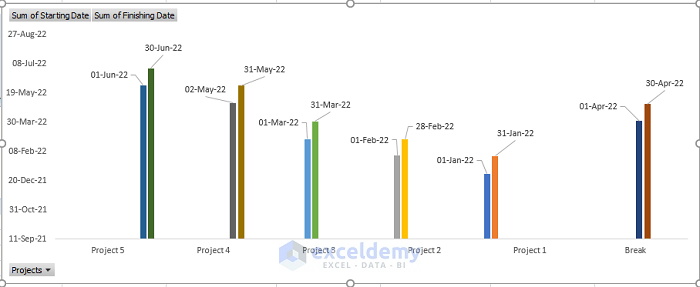
- Click OK to see results like the picture below.
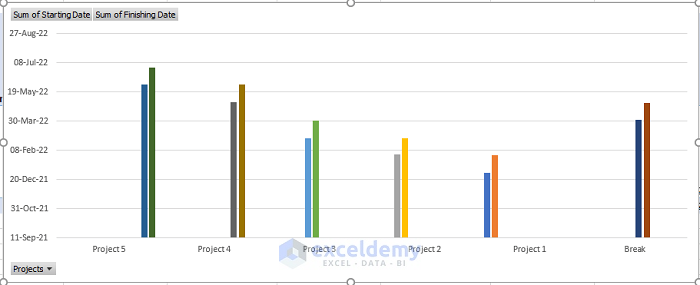
- Click on the plus (+) icon and select Data Labels.
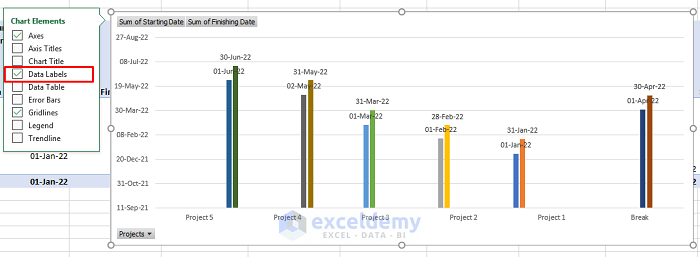
- Change the position of the Data Labels to make them more readable.
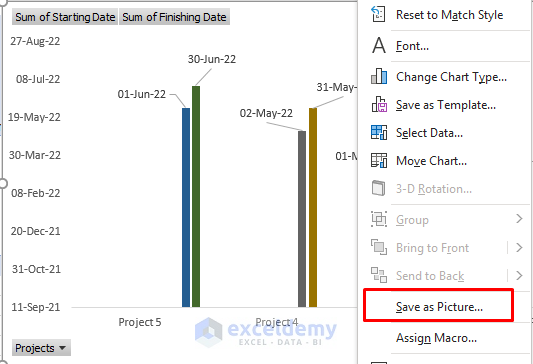
- To save the timeline as a picture, right-click on the graph and select Save as Picture.
Method 4 – Creating a Timeline with Dates Manually in Excel
STEPS:
- Select a cell in the dataset and press Ctrl + A to select all the used cells.
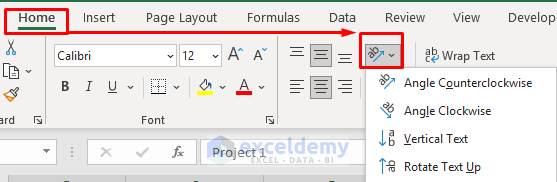
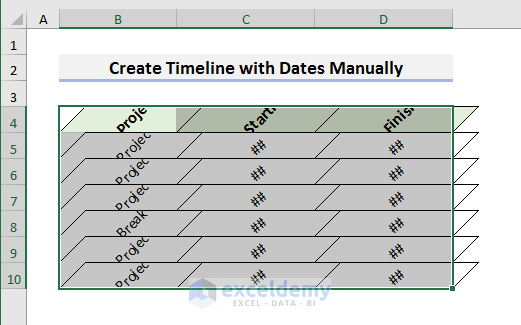
- Go to the Home tab and select the Orientation icon. A drop-down menu will appear.
- Select Angle Counterclockwise.
- The dataset will look like the picture below.
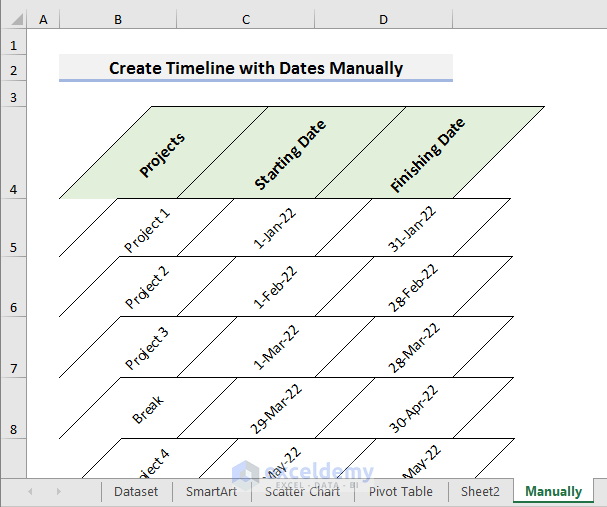
- Now, autofit the rows.
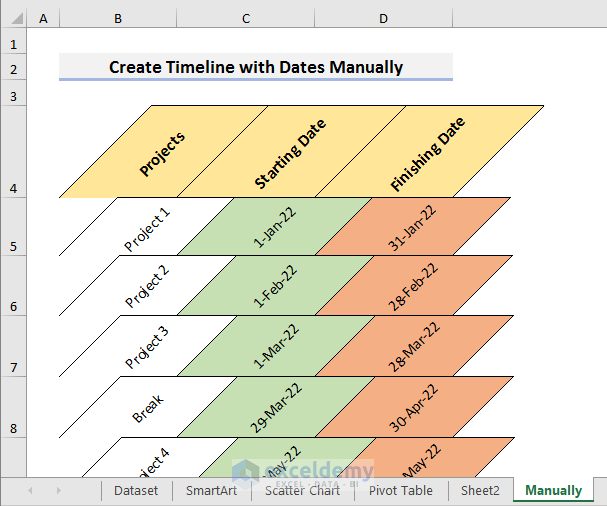
- Add some colors to make the timeline more presentable.
Read More: How to Create a Timeline Chart in Excel
Things to Remember
When you are trying to create a timeline with dates in Excel, remember some things.
- In Method-1, choose the SmartArt Graphic according to your needs.
- You can use different types of charts instead of ‘Scatter Charts’ in Method-2.
- In Method-3, you may not get the timeline in chronological order sometimes.
Download the practice book here.
<< Go Back to Timeline in Excel | Learn Excel
Get FREE Advanced Excel Exercises with Solutions!
