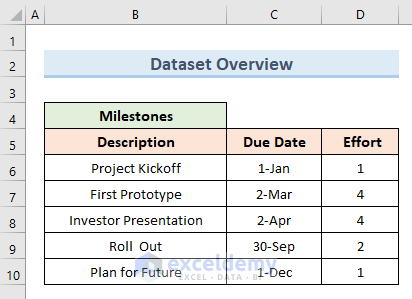
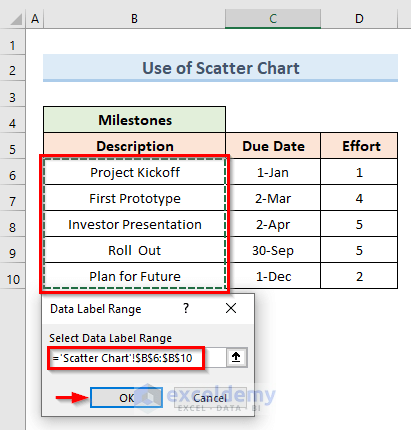
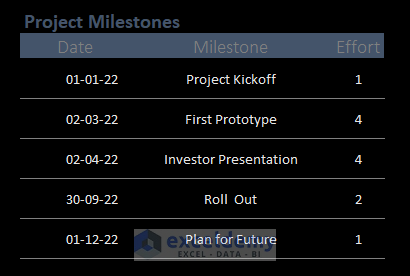
We will use the following dataset, which contains Milestones and metrics of the Effort of a project.
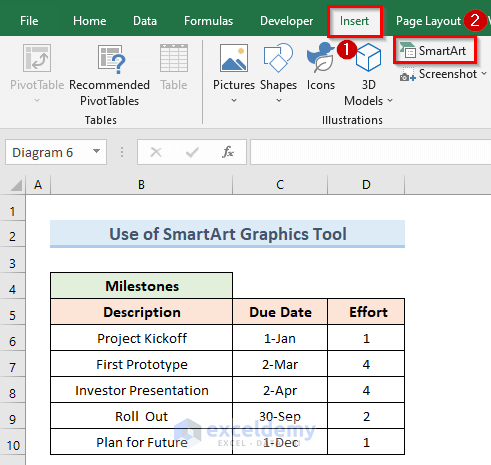
Method 1 – Use the SmartArt Graphics Tool to Create a Project Timeline in Excel
Steps:
- Go to the Insert tab.
- Select the option SmartArt from the ribbon.
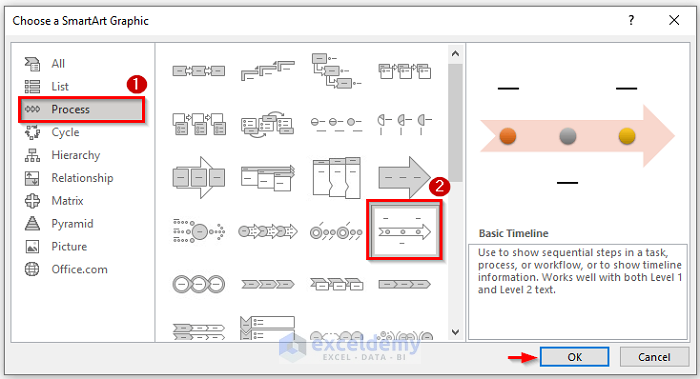
- This will open a new dialogue box.
- Choose the Process tab.
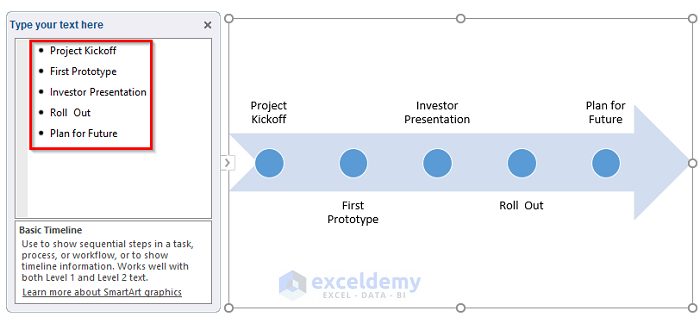
- Find the Basic Timeline chart and click on it.
- A new dialogue box will show up.
- Click on the arrow icon from the timeline chart.
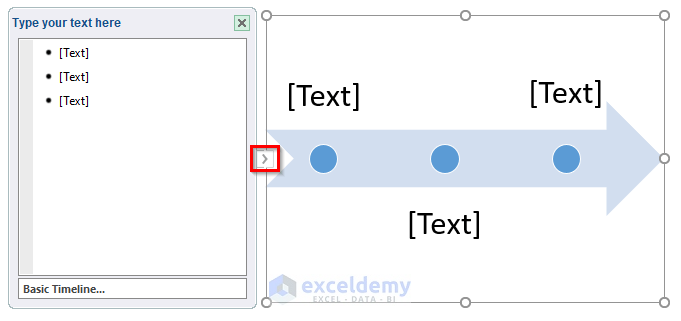
- Insert Timeline data in the text box. We can also insert data into the timeline directly.
- We get results similar to the following image.
Read More: How to Create a Timeline with Dates in Excel
Method 2 – Utilize a Scatter Plot Chart to Create a Project Timeline
Steps:
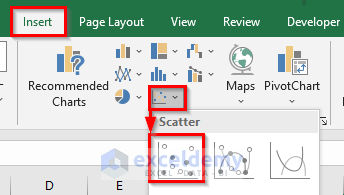
- Go to the Insert tab.
- Click on the Scatter chart.
- Select the chart type that you want to input.
- This will insert a blank scatter chart into the worksheet.
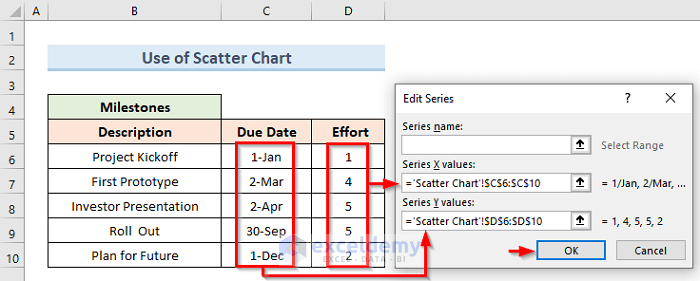
- Right-click on the scatter chart and choose the option Select Data.
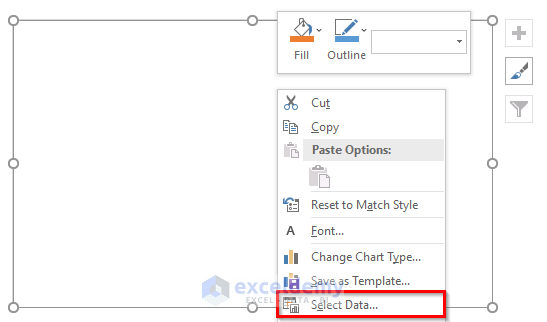
- We get a new window named Select Data Source.
- Click on the Add button from the Legend Entries (Series).
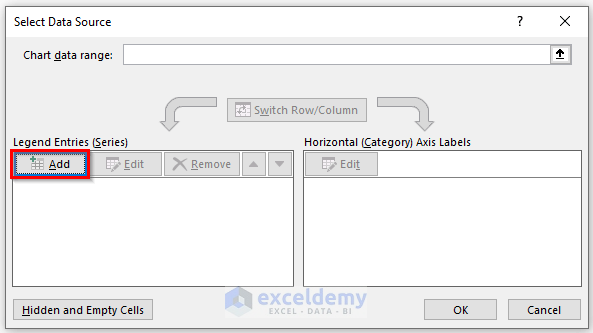
- Put the Due Date and Effort ranges into Series X values and Series Y values, respectively.
- Click on OK.
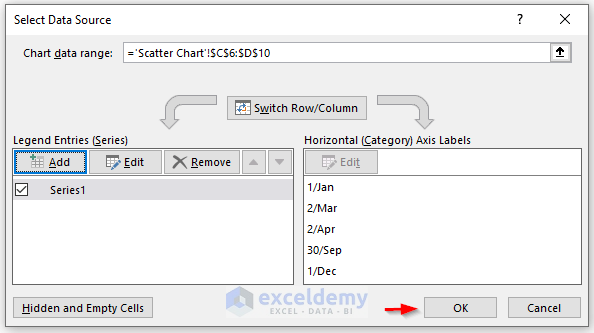
- Excel goes back to the Select Data Source dialogue box.
- Click OK.
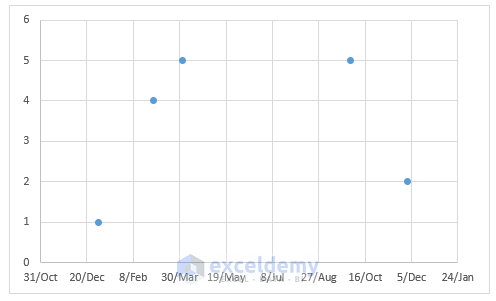
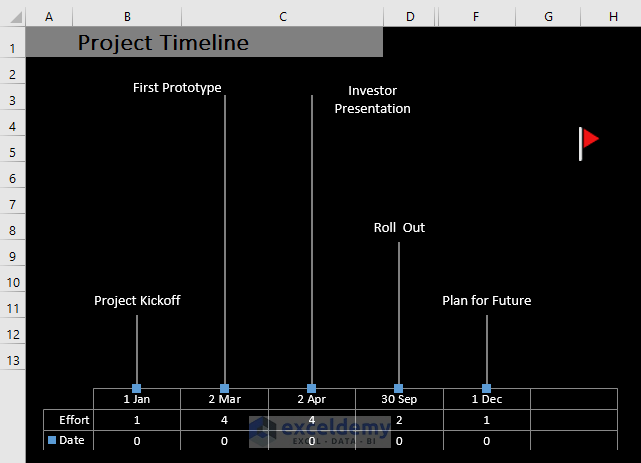
- You’ll get a scatter chart like the following image.
- Check the option Error Bars in the Chart Elements to show the Timeline markers.
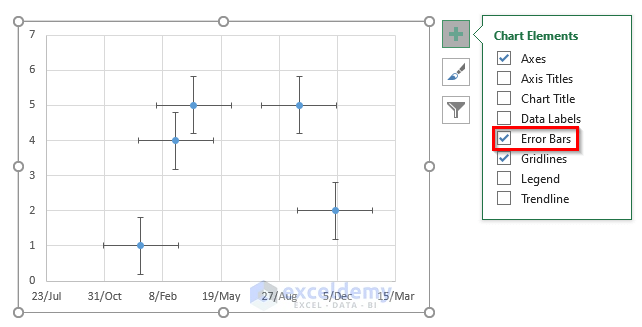
- Click on Chart Elements, then select Error Bars and More Options.
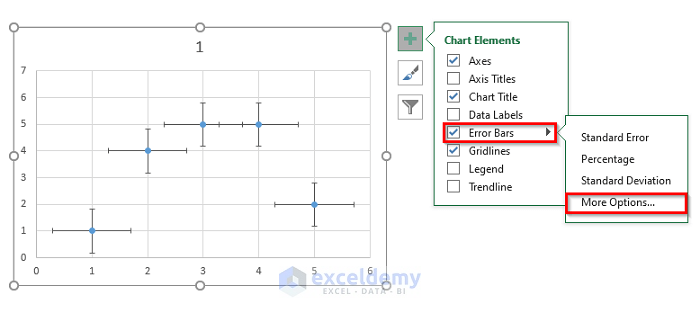
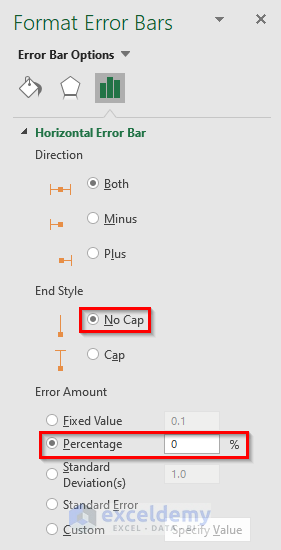
- Check the No Cap option from the End Style.
- Adjust the Percentage to 0% from the Error Amount section.
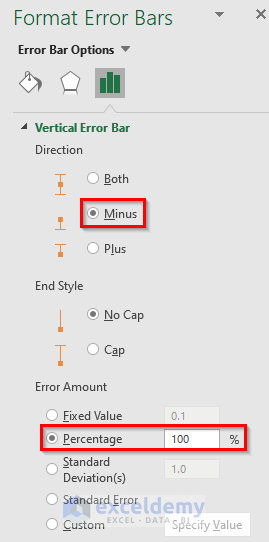
- For the Horizontal Error Bar, check the option Minus from the Direction.
- Adjust the value of the Percentage to 100%.
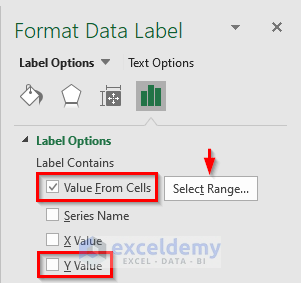
- Go to Chart Elements and Data Labels, then select More Options.
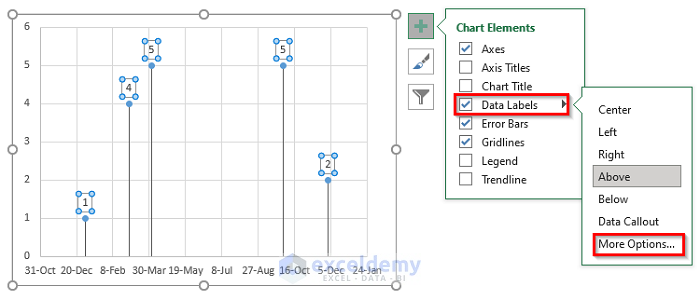
- Uncheck the Y value from the Format Data Labels.
- Check the option Value From Cells.
- Click on the button Select Range.
- Insert the following range value in the Select Data Label Range field:
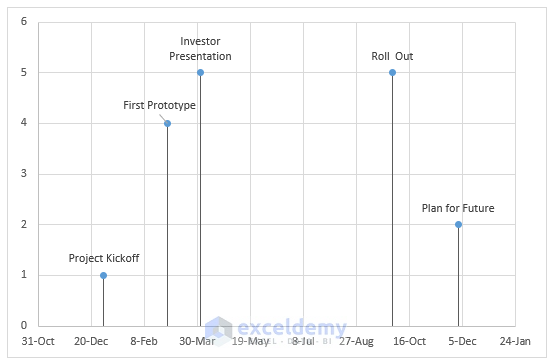
='Scatter Chart'!$B$6:$B$10- Click on OK.
- Here’s the result.
Read More: Create a Timeline in Excel with Milestones
Method 3 – Create a Project Timeline with Excel Timeline Templates
Steps:
- Download the free Project timeline with milestones template from the Office template library.
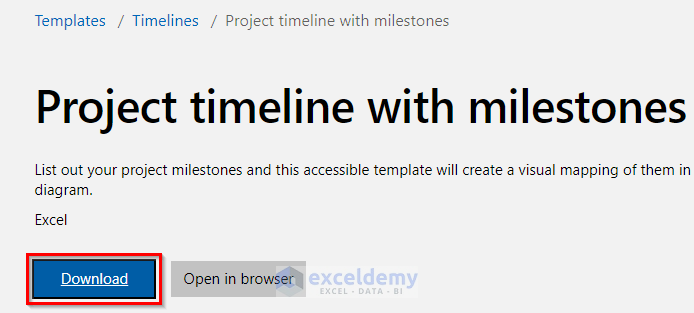
- Open the downloaded template in Excel.
- Update the Date and Milestone section as per the dataset.
- The timeline chart updates automatically with our project milestone data.
Read More: How to Create a Timeline Chart in Excel
Drawbacks of Creating a Project Timeline in Excel
- No individual to-do list: Excel doesn’t provide us with the scope to create a to-do list. It will provide an overview of assigned work to individual members. However, you have to type every data in the sheet physically.
- Manual follow-ups: The Excel project timeline largely depends on manual follow-ups.
- Non-Cooperative: Microsoft Excel only allows a single person to own the file, with no real-time updates if multiple members access and edit the file on their respective devices.
Download the Practice Workbook
<< Go Back to Timeline in Excel | Learn Excel
Get FREE Advanced Excel Exercises with Solutions!
