Latest Posts From Nasir Muhammad Munim
0
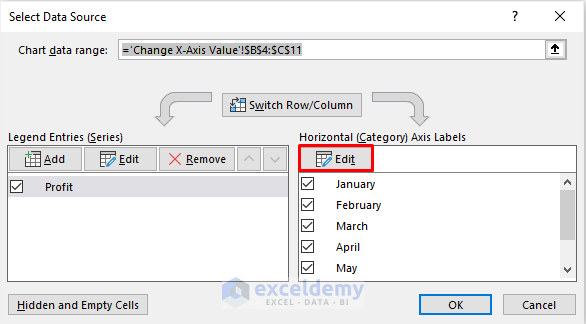
Here is a dataset with the Profit of a company separated by Months that we will use to change X-axis values in Excel. And here is the respective bar ...
4

This is the sample dataset. The independent variable should be in the left column and the dependent variable in the right column. ...
0
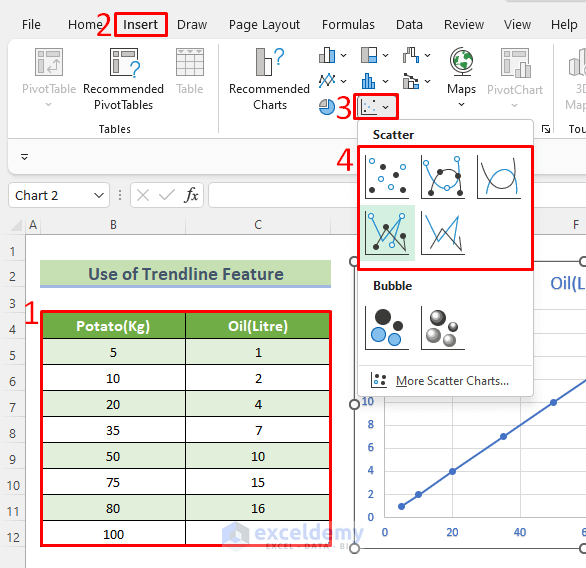
Method 1 - Use Trendline Feature to Extrapolate a Graph in Excel 1.1 Extrapolate Linear Graph by Trendline Feature Extrapolate a Linear graph in Excel, let ...
0

Consider the following dataset. It contains study materials and their corresponding per-unit prices, quantities, and totals. Here's the formula we are using to ...
Browsing All Comments By: Nasir Muhammad Munim
About ExcelDemy.com
See Our Reviews at


Dear KAREN CAYANAS,
Thanks for reaching out to us with your problem.
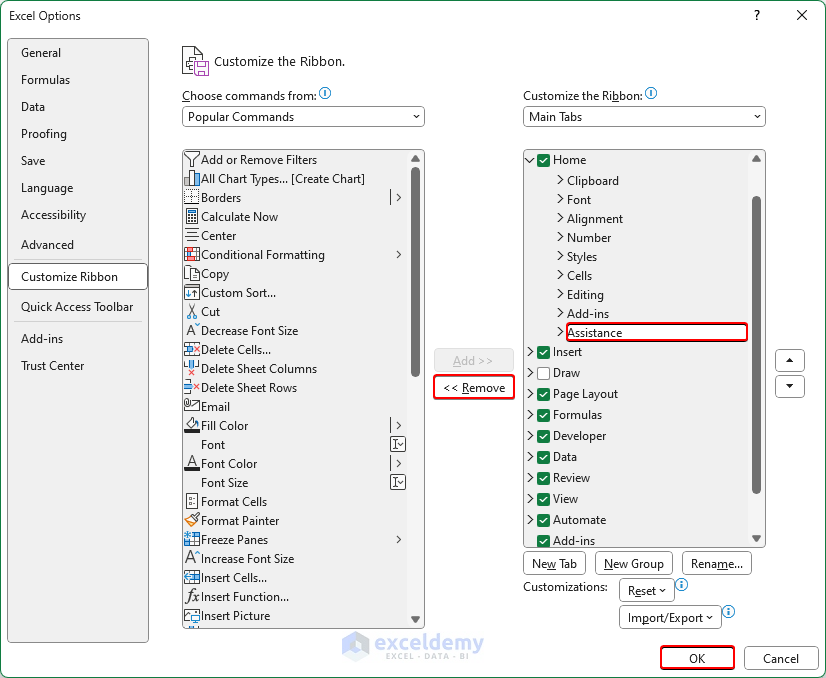
This problem occurs when you do not have enough view area on the monitor. While there is no particular fix to your problem, if you want to keep the cell styles in the Ribbon, you may consider removing some unnecessary groups from the Home tab.
To do so follow these steps:
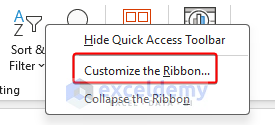
1. Right-click on the empty area of the Ribbon.
2. Select “Customize the Ribbon“.
3. From the Home tab dropdown, select and remove unnecessary groups one by one.
4. Click on OK to finish the process.
After removing the groups, cell styles will be visible without the “Cell Styles” drop-down if there is enough room in the Ribbon.
Regards,
Exceldemy
Hi Arthur,
Thank you for finding out about this issue. We have updated the VBA code to avoid the “Sub or Function Not Defined” error. Please try again with this new code and let us know if this problem still exists or not.
Regards,
Team Exceldemy
Dear AVI,
We can assure you that if you followed the steps correctly, everything should be fine with the tutorial. Moreover, both of these formulas are single-cell output formula. So, the procedure for the array formula implementation or pressing CTRL+SHIFT+ENTER is not required here.
If you want to take all the data to find out the standard deviation without conditions or avoid taking the false as 0, you should have a look at our article How to Calculate Average and Standard Deviation in Excel.
Regards,
Exceldemy
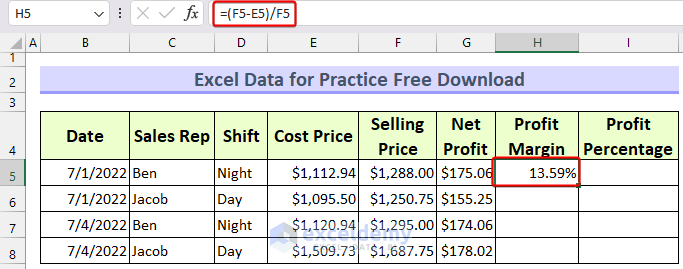
Dear Fardeen,
The profit margin is the percentage you get from the selling price. The formula for profit margin is: (Selling Price-Cost Price)/Selling Price or, Net Profit/Selling Price
The profit margin is calculated in the worksheet with the formula: =(F5-E5)/F5
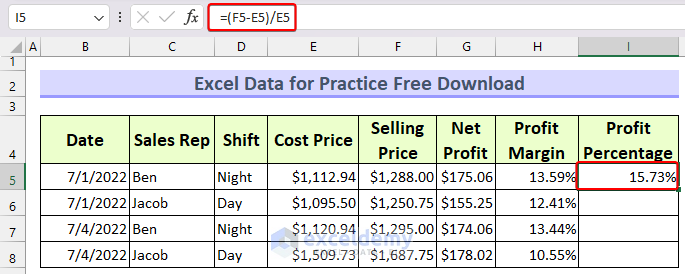
On the other hand, the profit percentage is calculated based on the Cost Price. The formula for profit percentage is: (Selling Price-Cost Price)/Cost Price or, Net Profit/Cost Price
The profit percentage is calculated in the worksheet with the formula: =(F5-E5)/E5
Regards
Exceldemy