Finding outliers and removing them is a very common task to analyze data in statistics, data mining, machine learning etc. There are so many ways that you can find outliers in your dataset but the process to remove them is not so easy to find. In this article, we will show you how to remove outliers in Excel.
What are Outliers in Excel?
An outlier is a value that falls way off from the mean or median value of a dataset. In other words, outliers are values that are significantly higher or lower than the rest of the values in a dataset.
Think of a cricket match where all the batters scored around 50 but only one batsman scored a century (100) and another batsman got out at 0. That 100 and 0 scores are the outliers in this match.
Outliers are problematic as they can skew the result of the data analysis and occur misleading results. So it is better to find outliers and remove them to have a smooth dataset.
3 Ways to Remove Outliers in Excel
In this section, you will learn how to delete outliers from your dataset in 3 different ways. Removing outliers is a tricky process, so read the whole article carefully.
1. Utilizing Excel Function to Calculate Average without Outliers
Excel TRIMMEAN function can be used to calculate the average of a given dataset while excluding outliers. The data points to exclude is supplied as a percentage. The percentage value can be input as a decimal format or percent format.
Syntax to calculate mean without outliers is,
Here,
- array = Range of data to trim and calculate the average result
- percent = The number of data points to exclude
Let’s see how to implement this function to calculate results with removed outliers.
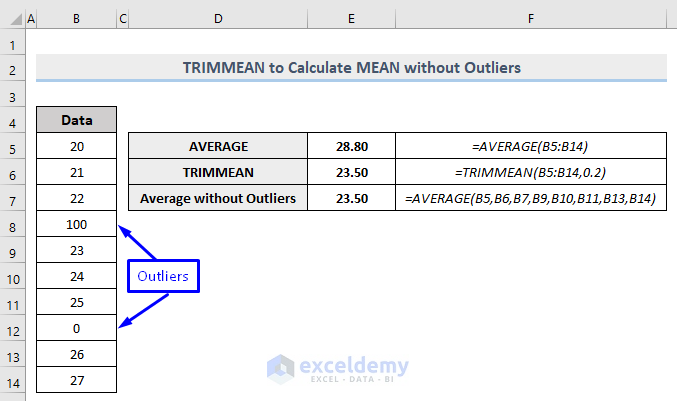
Consider the above picture. We have data from Cell B5 to B14. Here most of the numbers are between 20 to 27, but two values – 0 and 100 – are a far way off those values. So these are the outliers in our dataset.
For our dataset, the formula to calculate mean (average) without the outlier values with Excel TRIMMEAN function is,
=TRIMMEAN(B5:B14,0.2)Here,
- B5:B14 = Range of data to trim and calculate the average result
- 0.2 (or 20%) = The number of data points to exclude
If any number in the dataset falls 20% way off the rest of the dataset, then that number will be called outliers.
If you write the formula according to your dataset and press Enter, you will get the calculated mean without outliers for your dataset. In our case, Cell E6 holds the calculated mean which is 23.50.
To check whether the answer is correct or not, we run the AVERAGE function in Cell E5 which returns the average (28.80) of all the values in range B5:B14. And in Cell E7, we run another AVERAGE function by manually inputting all the cells except those that hold outliers values, and got a return of 23.50 as result.
So we can say that the TRIMMEAN function can successfully remove outliers from a given dataset while calculating the average in Excel.
Read More: How to Remove Compatibility Mode in Excel
2. Remove Outliers from Dataset and Line Chart in Excel
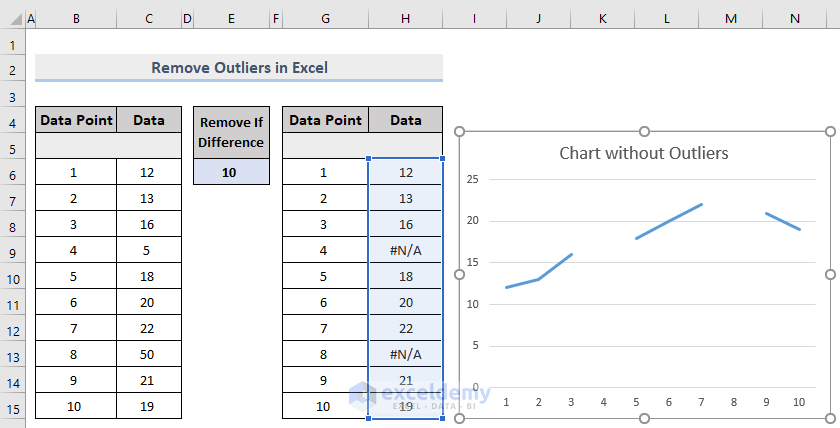
Notice the following picture. We have some data based on which we created a line graph. From the line graph, we can easily see that in data points 4 and 8 we have our outliers.
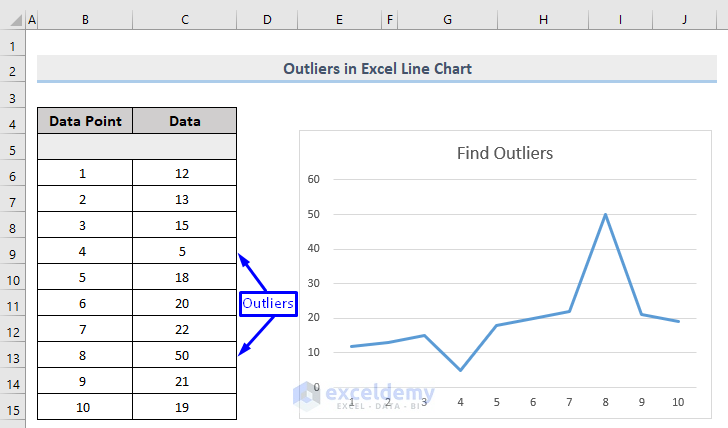
Now we will see how we can smooth out the line chart by removing the outlying values from the dataset.
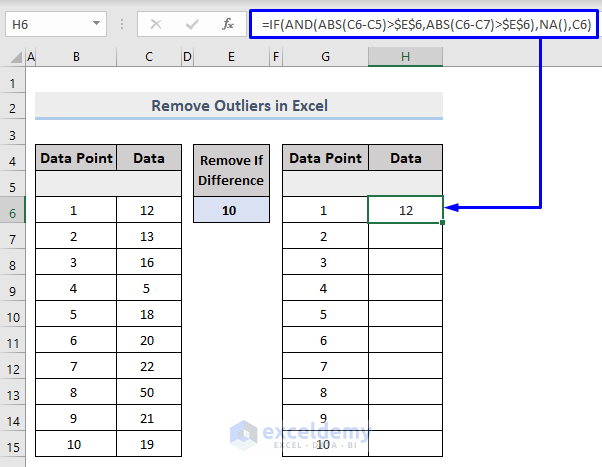
In another cell (in our case it is Cell H6), write the following formula,
=IF(AND(ABS(C6-C5)>$E$6,ABS(C6-C7)>$E$6),NA(),C6)Here,
- C6 = Cell that holds the first data in the dataset
- C5 = Cell above the first data cell
- C7 = Cell below the first data cell
- $E$6 = Difference between data points.
Looking at our data, it seems that when a data point is differ 10 units from others, is designated as an outlier. So we put 10 in Cell E6 and make it an Absolute Cell Reference so that this cell will be fixed while scanning and calculating through the whole dataset.
After pressing Enter, you can see the first data is still appearing in the result cell H6. All you had to do here is, just to construct the formula so that we can drag the Fill Handle to apply the formula to the rest of the cells.
Now drag the row down with Fill Handle and you will see the cells that were holding the outliers are now filled with #N/A.
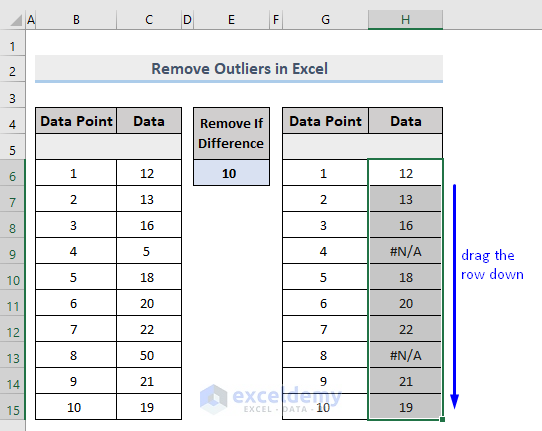
And look at the line chart now, this is now a flattened graph without any outlying values in it.
Formula Breakdown
=IF(
As we are going to compare values based on which we will extract the result, we initiate the formula with the IF condition.
=IF(AND(
We are going to compare the current data point and the cell above and the cell below. And if both comparisons are true, only then we will show the data point as a result. So, since we need to deal with “Both” comparisons so we should utilize the AND function.
=IF(AND(ABS(
When we subtract data points, some data may throw negative values. And we don’t want to deal with negative values as negative values will always contradict the condition of “removing data when the difference is 10”. So to make sure that we always have positive results, we need to wrap the comparisons in an Absolute value function.
=IF(AND(ABS(C6-C5)>$E$6
Here we started our first comparison. We simply subtract the current value with the value above and see whether the result is greater than the difference level stored in Cell E6 and made the cell an Absolute Reference to keep the cell value locked.
=IF(AND(ABS(C6-C5)>$E$6,ABS(C6-C7)>$E$6)
Next, the second part of the comparison which is separated by a comma. It will compare the current data point with the next data point.
=IF(AND(ABS(C6-C5)>$E$6,ABS(C6-C7)>$E$6),NA()
Now we put a comma and determine to put NA function in there if both the AND functions are true.
=IF(AND(ABS(C6-C5)>$E$6,ABS(C6-C7)>$E$6),NA(),C6)
And if the AND function is not true then we want to return the actual data point as the IF False value. So we type in a comma and pass the cell reference number C6 in there.
Read More: Remove Dotted Lines in Excel
3. Remove Outliers Manually in Excel
Another easy way to eliminate outliers in Excel is, just sort the values of your dataset and manually delete the top and bottom values from it.
To sort the data,
- Select the dataset.
- Go to Sort & Filter in the Editing group and pick either Sort Smallest to Largest or Sort Largest to Smallest.
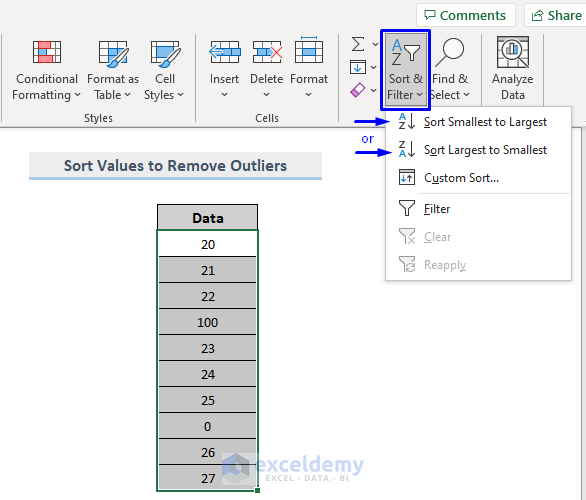
- In our case, we selected Sort Smallest to Largest. It sorted the numbers in our dataset in ascending order, placing the smallest ones at the top and the largest ones at the bottom.
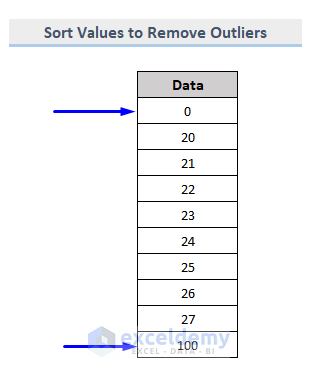
Now just manually delete those data to make the dataset outlying values free.
We don’t recommend following this process while working with a large dataset. When your dataset is small and easier to view, only then you can apply this procedure, otherwise don’t implement this.
Read More: How to Remove Value in Excel
Download Workbook
You can download the free practice Excel workbook from here.
Conclusion
This article showed you how to remove outliers in Excel. I hope this article has been very beneficial to you. Feel free to ask if you have any questions regarding the topic.
Related Articles
- How to Remove Numbers from a Cell in Excel
- How to Remove Panes in Excel
- How to Remove 0 from Excel
- How to Remove Drop Down Arrow in Excel
- How to Remove HTML Tags from Text in Excel
<< Go Back To Data Cleaning in Excel | Learn Excel
Get FREE Advanced Excel Exercises with Solutions!
