Power BI is Microsoft’s business analytics tool that transforms raw data into meaningful insights. Power BI lets you create dynamic, interactive reports from your data. One of the most common and beginner-friendly ways to start with Power BI is by using Excel tables as your data source.
In this tutorial, we will show you how to create your first Power BI report using Excel tables as your data source.
Let’s use simple sales data to create a Power BI report.
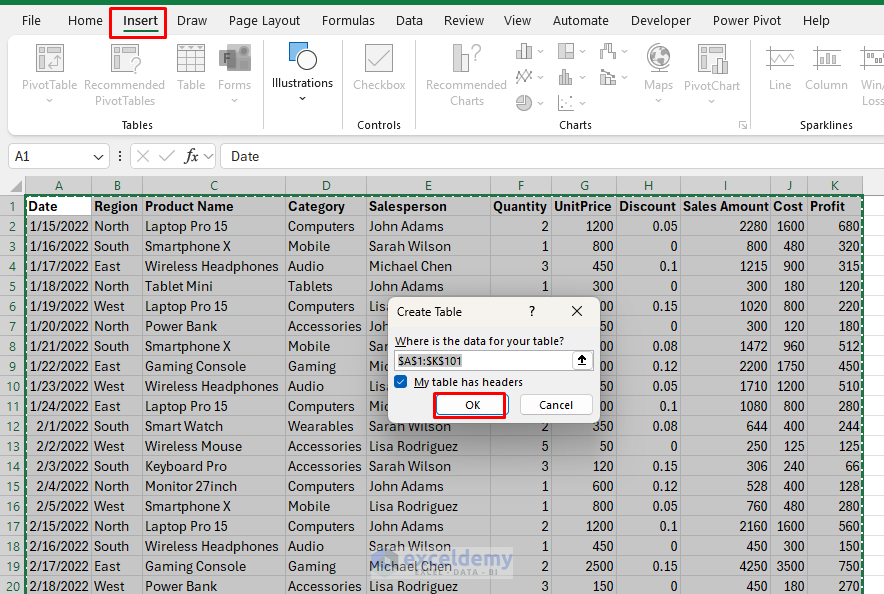
Step 1: Format as a Table in Excel
- Select the entire data range (including headers).
- Go to the Insert tab >> select Table or press (Ctrl + T).
- Ensure “My table has headers” is checked.
- Click OK.
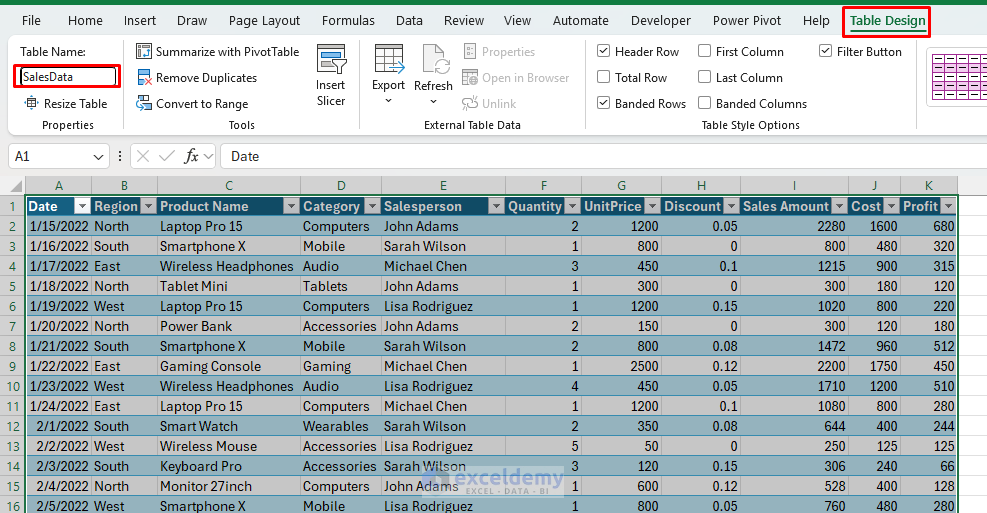
- Name your table for easy reference.
- Go to the Table Design tab >> change Table1 to SalesData.
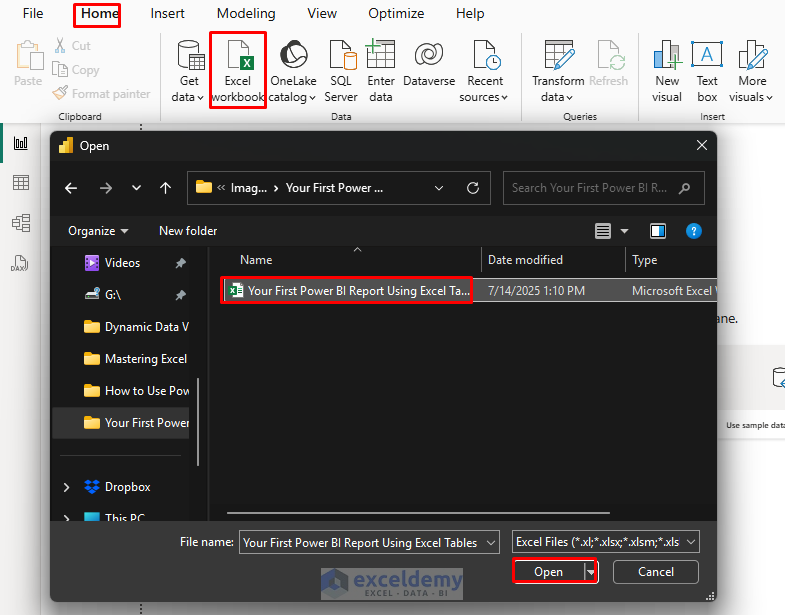
Step 2: Import Excel Table into Power BI
- Open Power BI Desktop.
- Go to the Home tab >> from Data >> select Excel workbook.
- Browse and open your Excel file.
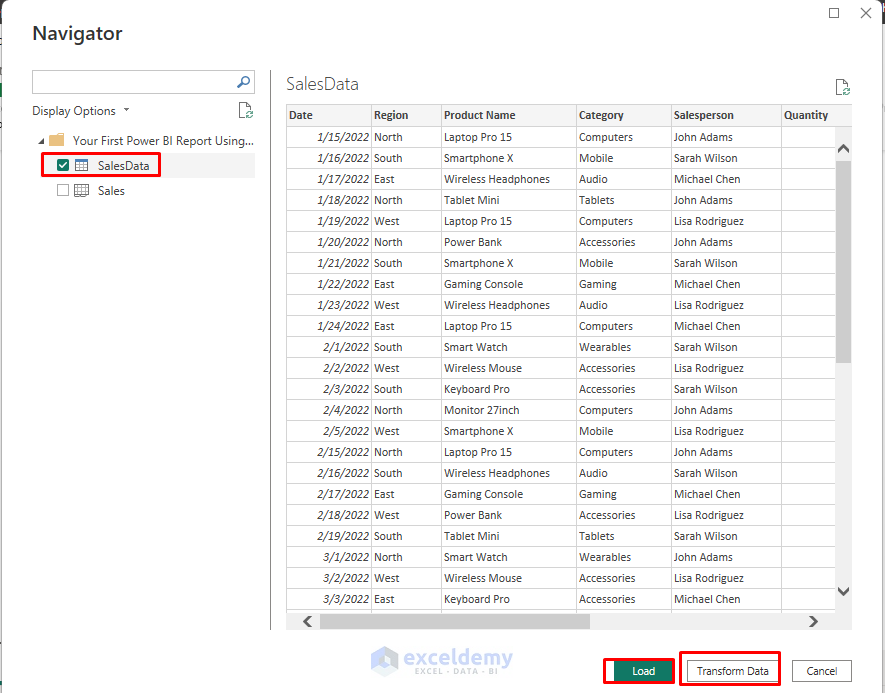
- The Navigator window will display all available tables and sheets:
- Check the SalesData table.
- Preview the data in the right panel to ensure it looks correct.
- Click Load to import data directly.
- Or click Transform Data to open Power Query Editor (recommended for data cleaning).
Step 3: Transform Your Data (Power Query Editor)
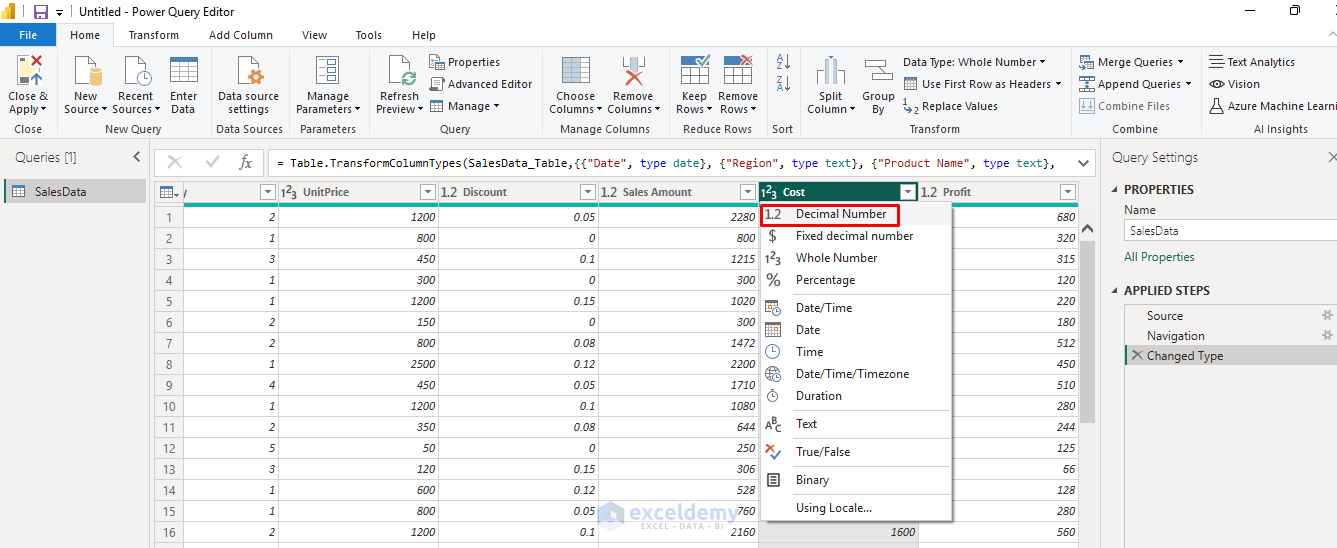
The Power Query Editor allows you to clean and shape your data before loading it into Power BI.
Change Data Types:
- Click on the data type icon in the column header.
- Select the appropriate data type (Text, Number, Date, etc.).
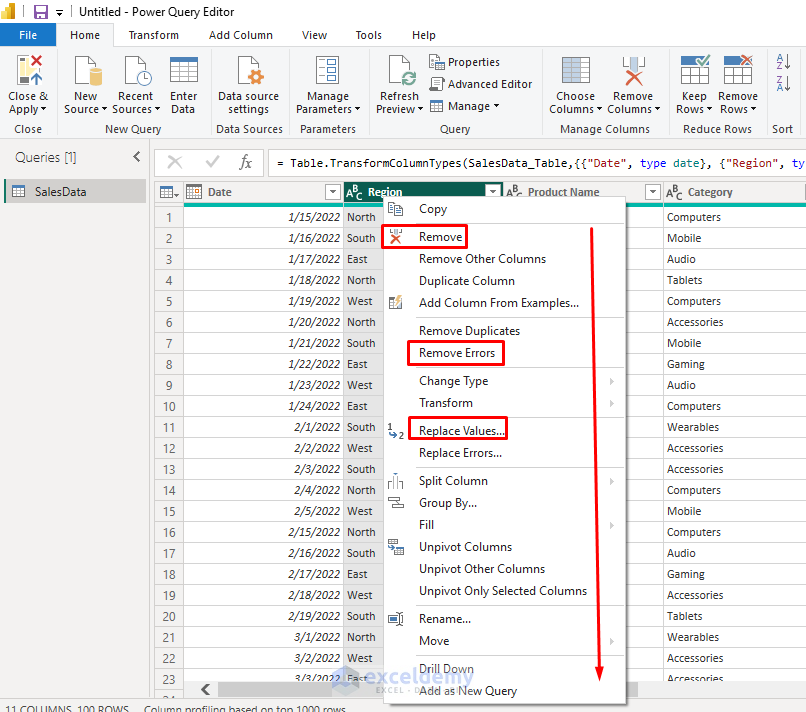
Remove Unnecessary Columns:
- Right-click on columns you don’t need.
- Select Remove.
Rename Columns:
- Double-click on column headers.
- Type new names (use descriptive, concise names).
Filter Data:
- Click the dropdown arrow in any column header.
- Uncheck values you want to exclude.
Handle Missing Values:
- Select columns with missing data.
- Right-click and choose Replace Values or Remove Rows.
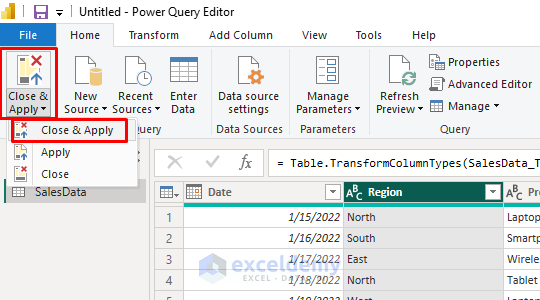
Apply Changes:
- Review your transformations in the Applied Steps panel.
- Click Close & Apply to load the data into Power BI.
Step 4: Build Your First Report
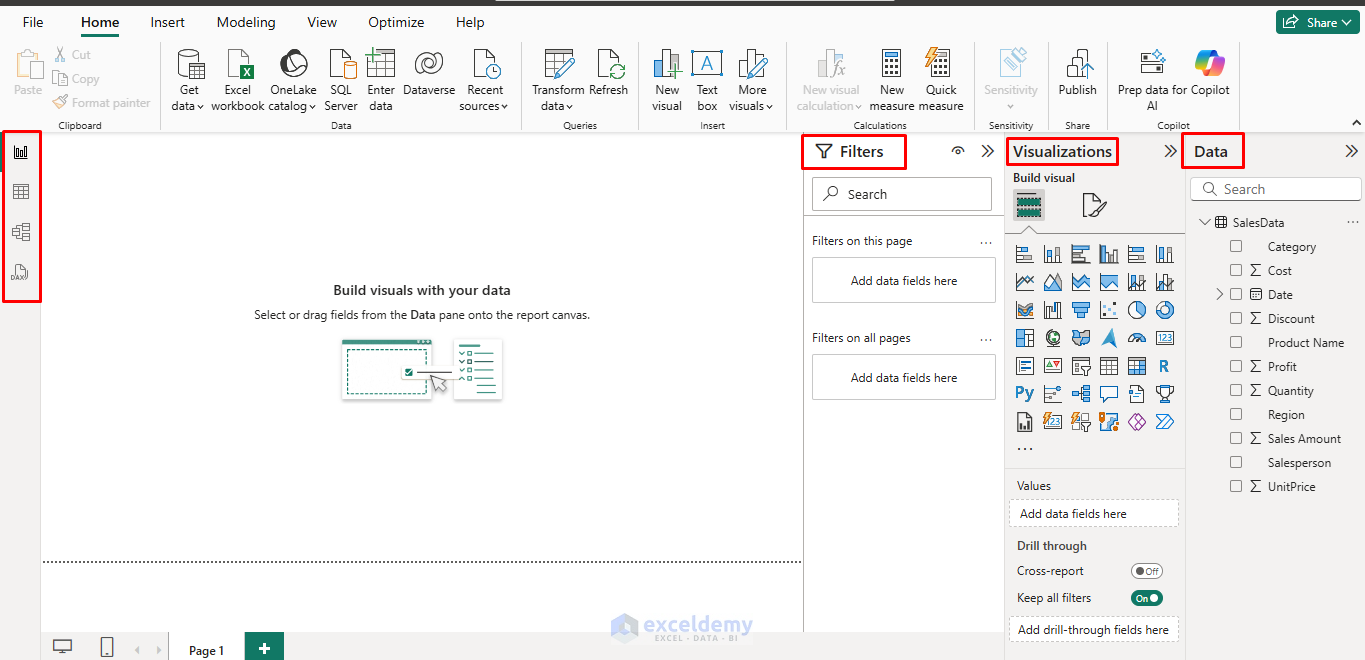
Understanding the Power BI Interface
After loading data, you’ll see:
- Report canvas (center) – where you build visualizations.
- Visualizations panel (right) – chart types and formatting options.
- Fields panel (far right) – your data columns.
- Filters panel (right) – for adding filters to visuals.
- Table view (left) – the table icon on the left shows your imported rows.
- Model view (left) – creates a relationship between multiple tables.
Create Visualizations in Report
Let’s create your first Power BI report.
Create Column Chart:
- Go to the Report view (the chart icon on the left).
- Go to the Visualizations pane >> select Clustered Column Chart.
- Drag the Product Name to the X-axis well.
- Drag Sales Amount to the Y-axis well.

Add a Line Chart:
- Go to the Visualizations pane >> select Line Chart.
- Drag Order Date to the X-axis.
- Drag Sales Amount to the Y-axis.
- Position the chart next to your column chart.

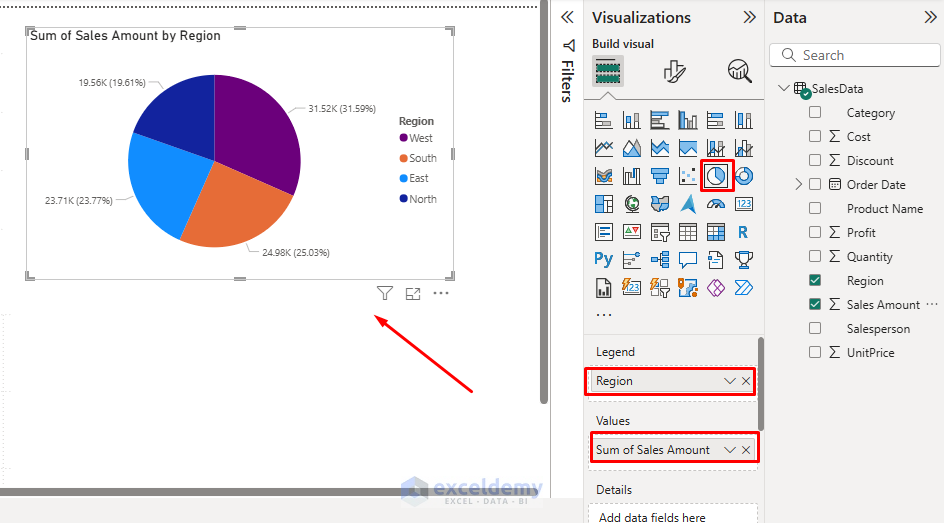
Create a Pie Chart:
- Select Pie Chart from the Visualizations pane.
- Drag the Region to the Legend field.
- Drag Sales Amount to the Values field.
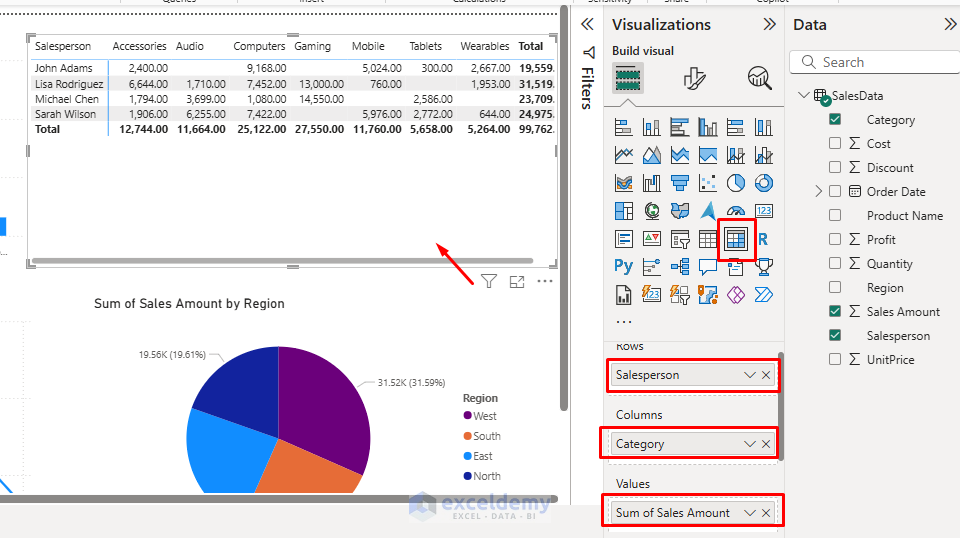
Add a Table Visual:
- Select the Matrix Table from the Visualizations pane.
- Drag multiple fields.
- Drag SalesPerson to the Rows.
- Drag Category to Columns.
- Drag Sales Amount to the Values area.
- Resize appropriately to show your data clearly.
Step 5: Format Your Visualizations
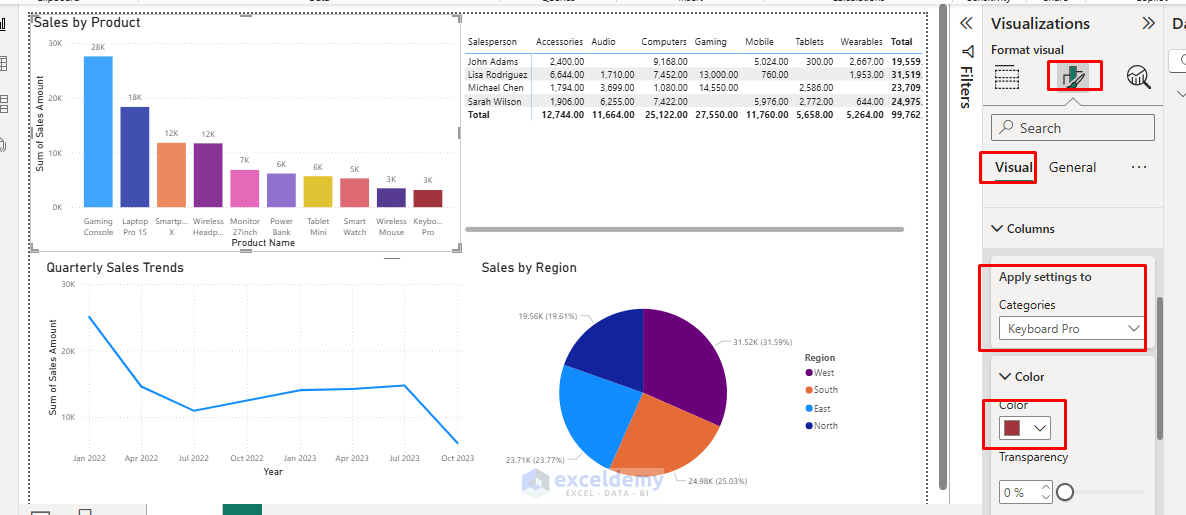
Customize Chart Appearance:
- Click visuals to select and resize them.
- Use the Format (paint roller icon) to adjust colors, labels, and titles.
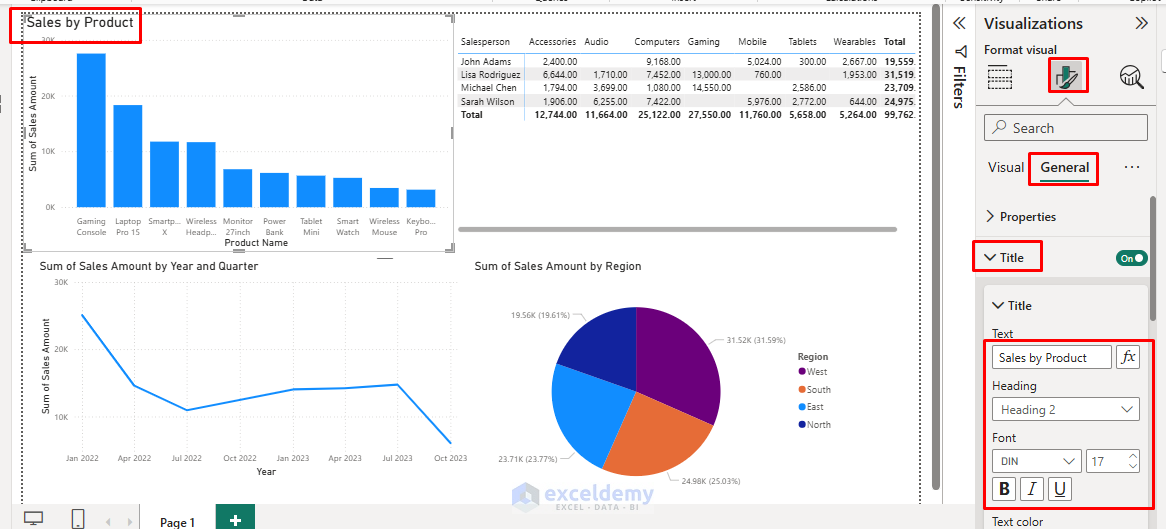
- Add data labels for better readability.
- Expand Data colors to change bar colors.
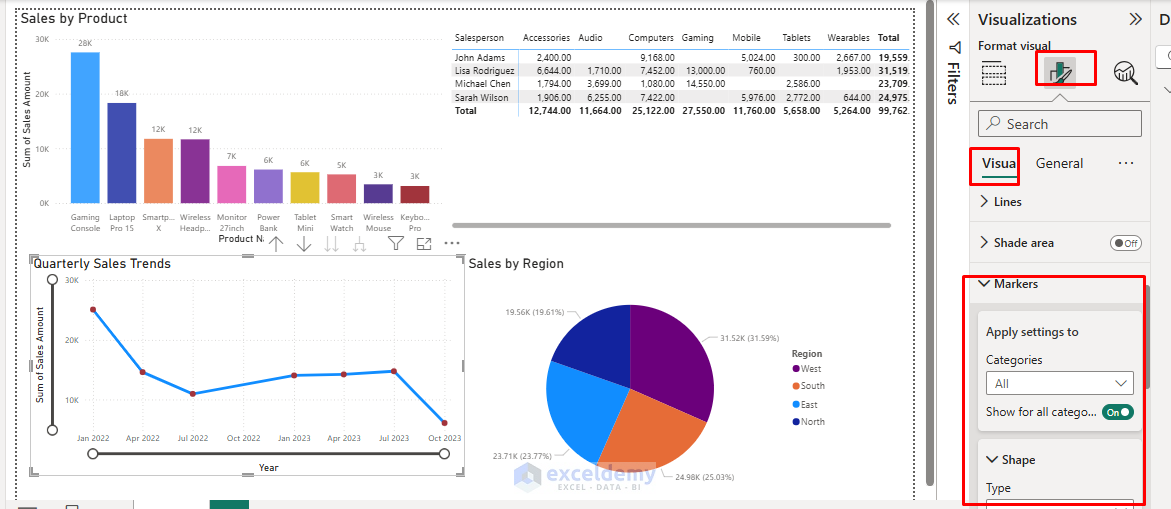
Line Chart Formatting:
- Select the line chart.
- In the Format panel, adjust the line thickness and color.
- Enable markers for data points.
- Format axes for better readability.
Step 6: Add Interactivity with Filters
Slicers for Interactive Filtering:
- Click on the empty canvas.
- Select Slicer from Visualizations.
- Drag a field Category to the Field area.
- You can click on slicer values to filter all visuals.

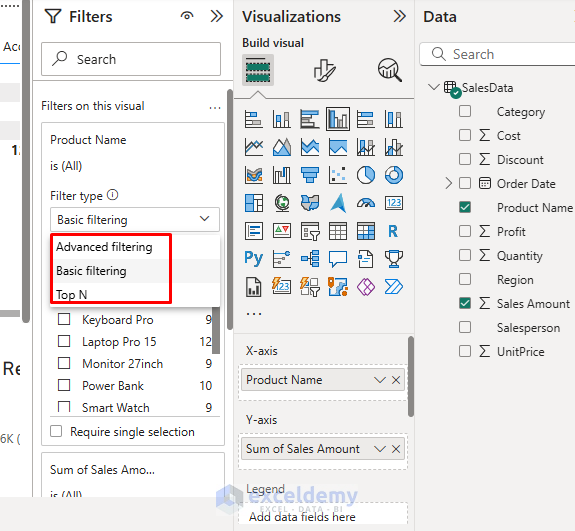
Page-Level Filters:
- Expand the Filters panel.
- Drag a field (like “Region”) to the “Filters on this page” area.
- Select filter type (Basic filtering, Advanced filtering, etc.).
- Choose values to include or exclude.
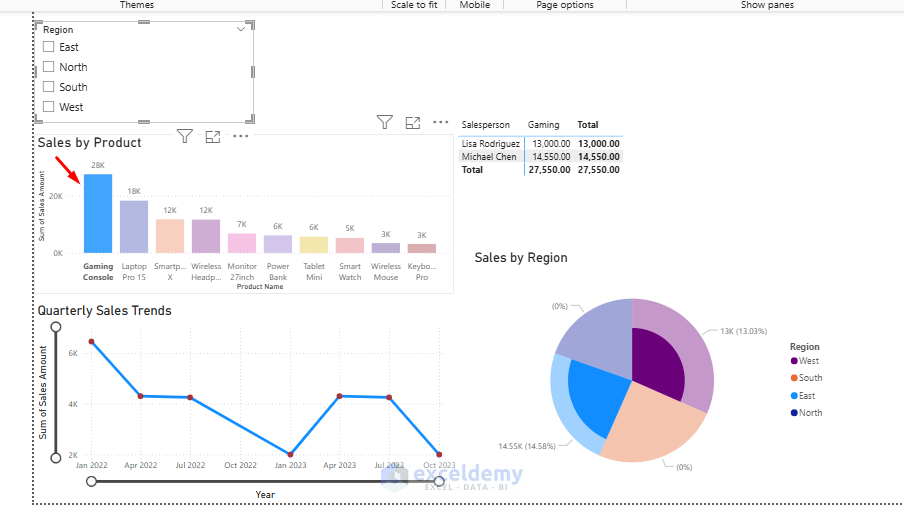
Visual-Level Filters:
- Select a specific visual.
- It automatically filters the entire report.
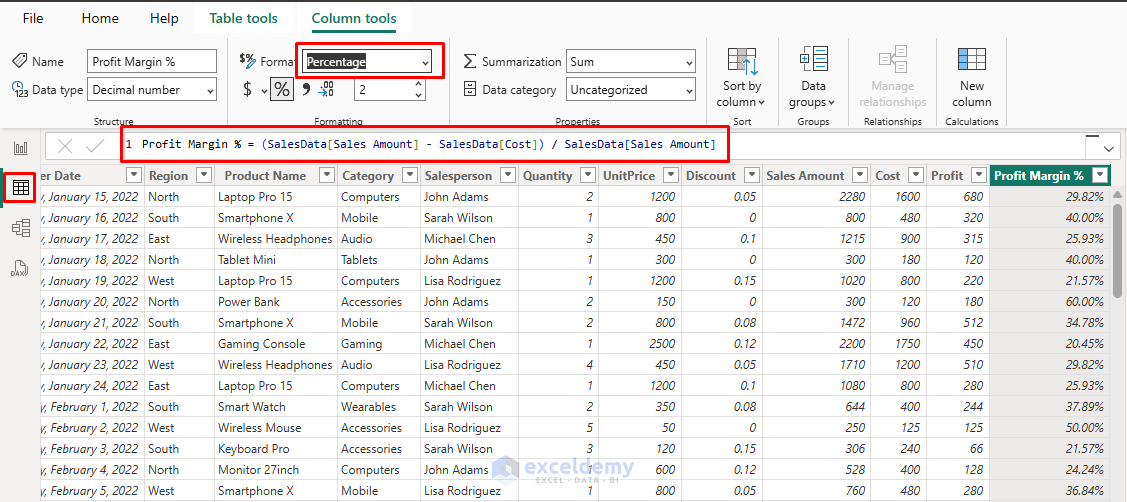
Step 7: Enhance Your Report with Calculated Fields
Create Calculated Columns:
- Go to Table view (table icon on the left).
- Go to the Table Tools >> select New column.
- Insert the following DAX formula in the formula bar.
Profit Margin % = (SalesData[Sales Amount] - SalesData[Cost]) / SalesData[Sales Amount]
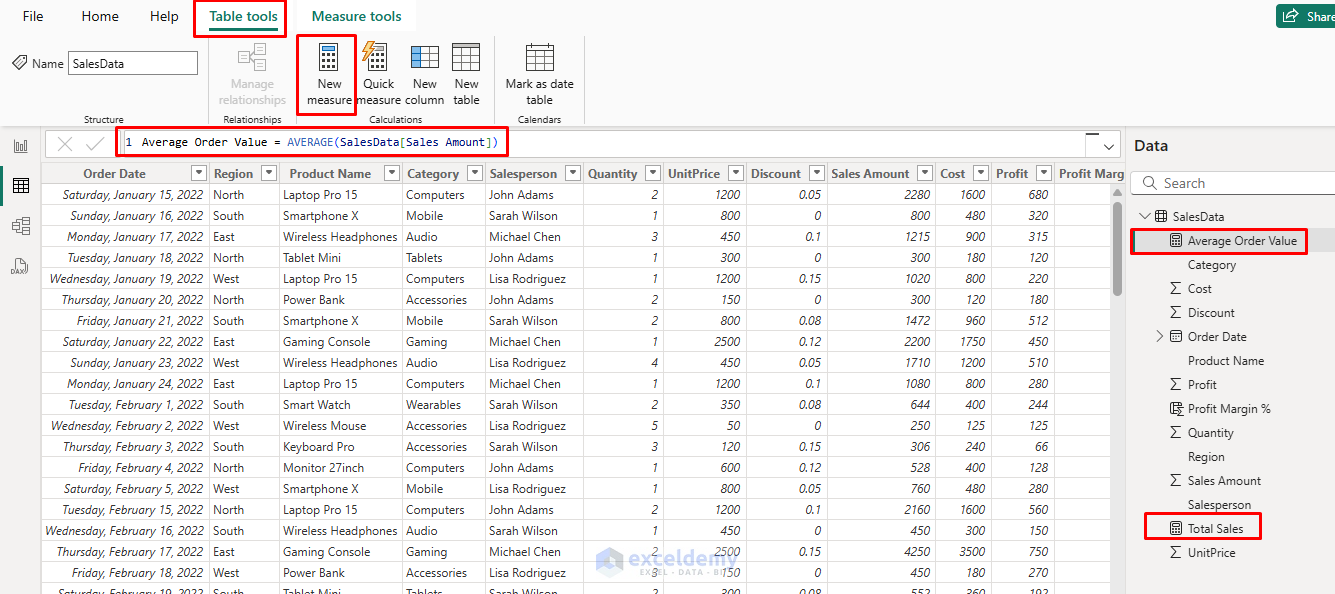
Create Measures:
- Go to Table view (table icon on the left).
- Go to the Table Tools >> select New column in the Modeling ribbon.
- Or right-click on your table in the Fields panel.
- Select New measure.
- Create measures for totals, averages, etc.
Total Sales = SUM(SalesData[Sales Amount])
Average Order Value = AVERAGE(SalesData[Sales Amount])
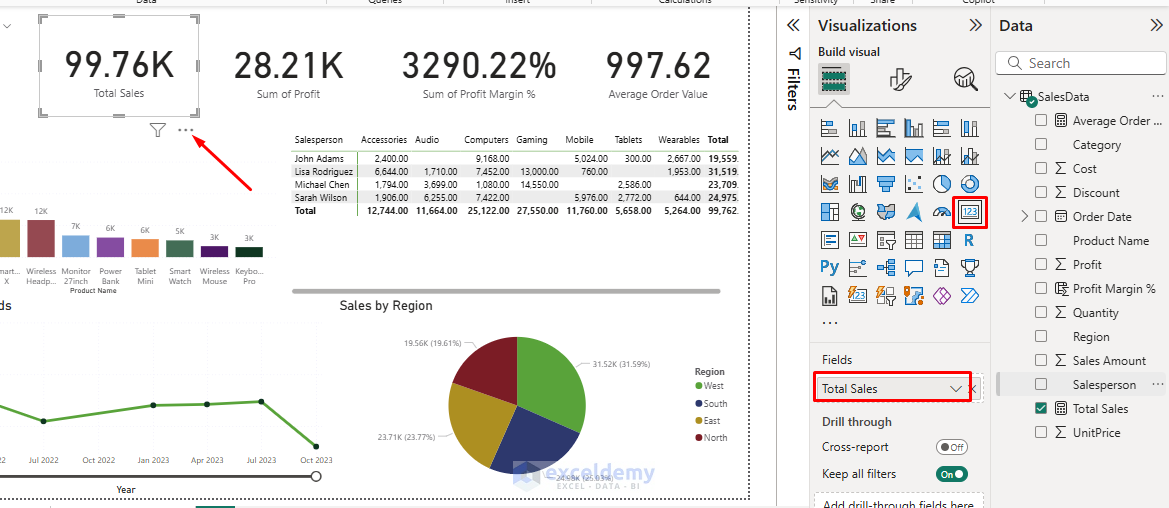
Insert Measure into Report:
- Select Cards from the Visualizations pane.
- Drag the Total Sales to the Field.
- Drag the Profit Margin % to the Field.
- Drag the Average Order Value to the Field.
- Drag the Profit to the Field.
Apply Theme:
- Go to the View tab >> select any theme.

Step 8: Save and Share Your Report
Final Report:
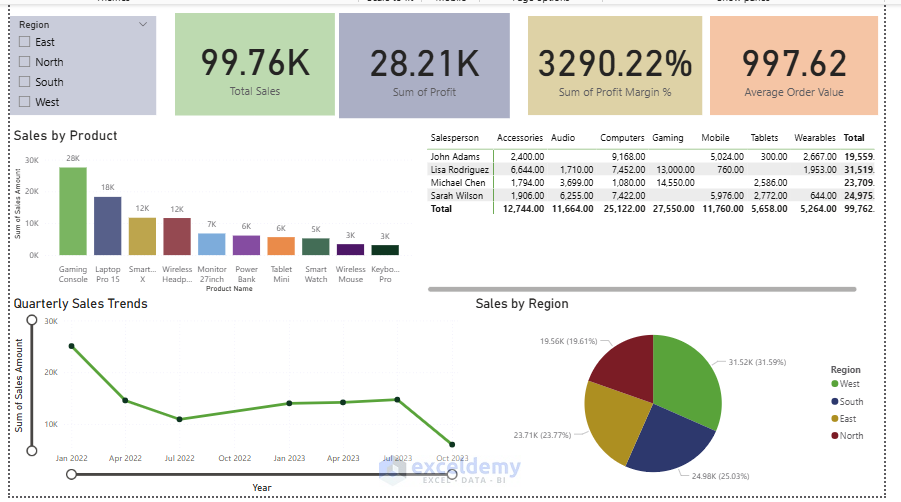
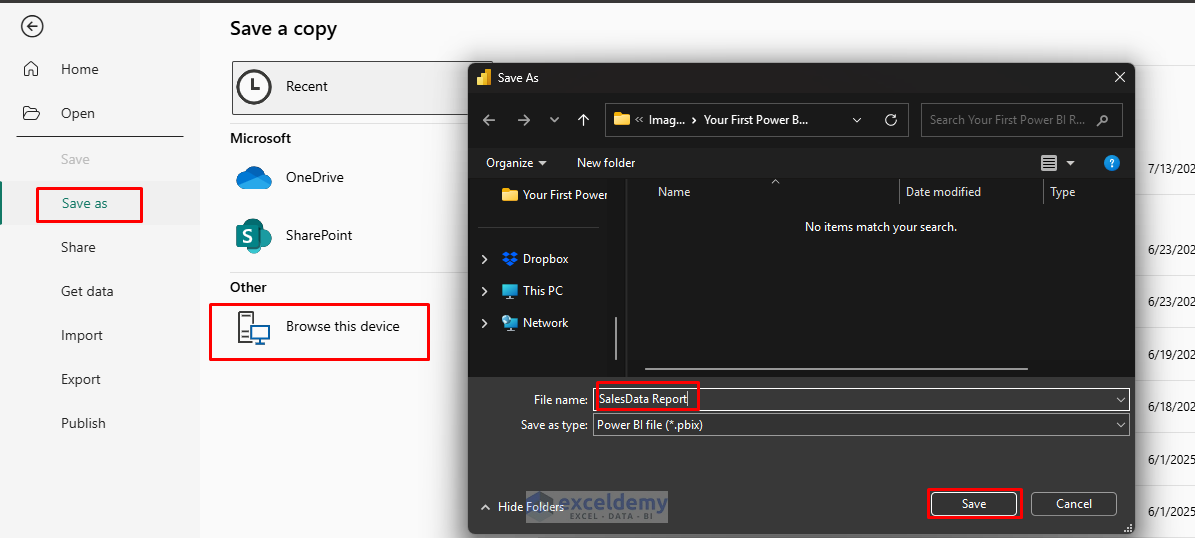
Save Your Report:
- Go to File tab >> select Save As, and save your report as SalesReport.pbix.
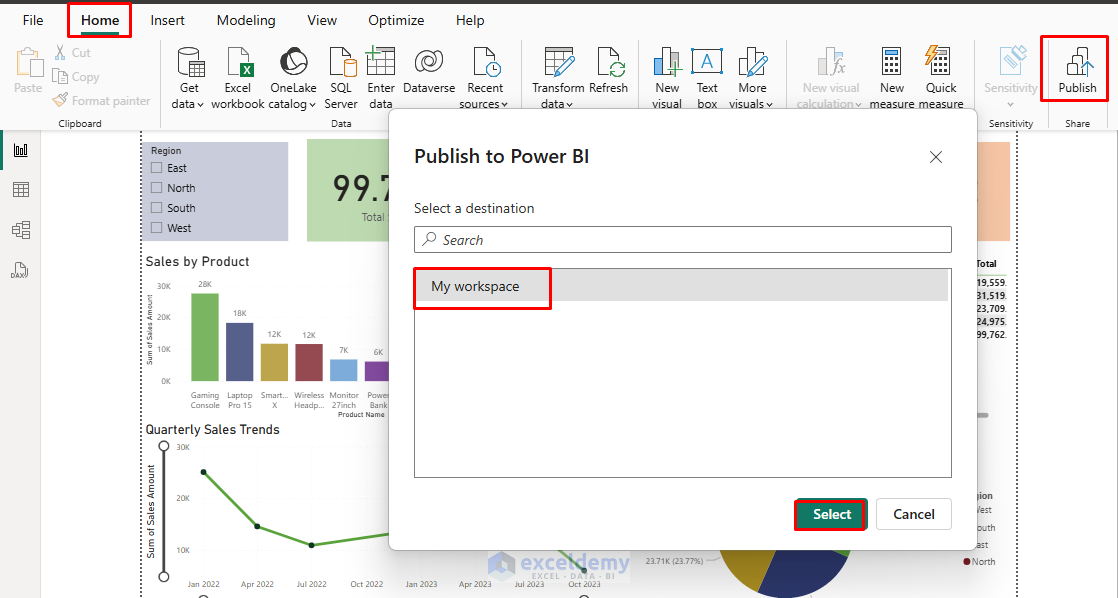
Power BI Service (Online):
- Go to the Home tab >> click Publish.
- Sign in to your Power BI account.
- Select workspace destination (e.g., My workspace).
- Click Select.
- Share with colleagues via the Power BI service.
Conclusion
By following the above steps, you can create your first Power BI report using Excel tables as your data source. The key to success with Power BI is practice and experimentation. Begin with simple datasets and gradually progress to more complex scenarios. Each report you create will improve your skills and understanding of this powerful business intelligence tool. As you get more comfortable, explore more visuals, filters, and Power BI features.
Get FREE Advanced Excel Exercises with Solutions!
