
Excel and Power BI are powerful Microsoft tools for data analysis and visualization. Each excels in different scenarios based on data size, complexity, and collaboration needs. Often, the tools are seen as competitors, but in reality, they complement each other. Excel shines in ad-hoc analysis and modeling, while Power BI is built for scalable reporting and interactive dashboards.
In this tutorial, we show when to use Excel and when to use Power BI, and how to combine them effectively.
When to Use Excel
Excel is a popular spreadsheet tool for organizing, analyzing, and visualizing data. It offers formulas, PivotTables, charts, and Power Query for data transformation. Excel is ideal for ad-hoc analysis, financial modeling, custom calculations and what-if scenarios, small to medium datasets, and tasks that live in the grid. It is accessible to users of all levels.
Use Excel for:
- Small Datasets: Handling small to medium datasets, typically under ~1M rows
- Ad-hoc Analysis: Creating quick calculations, scenario tables, Goal Seek/Solver, and sensitivity analysis without modeling overhead
- Financial Modeling & Forecasting: Building formulas, linking sheets, and running simulations; provides cell-level control, auditability (trace precedents), and flexible structures for forecasts and budgets
- PivotTables & Formulas: Summarizing and exploring data with functions like VLOOKUP, INDEX-MATCH, dynamic arrays, LET, LAMBDA, FILTER, and XLOOKUP; quick cross-tabs with PivotTables
- Reporting Templates: Creating custom, print-friendly reports (e.g., monthly statements, trackers)
- Data Cleaning and Preparation: Using Power Query in Excel to clean and reshape moderate datasets before PivotTables/charts
- Individual Work: Performing analysis without real-time collaboration needs; share files via OneDrive if desired
When to Use Power BI
Power BI, launched in 2014, is a business intelligence platform for tracking KPIs and creating interactive dashboards. It includes Power BI Desktop (for report creation), the Power BI Service (for sharing), and mobile apps. Features include advanced visualizations, DAX for calculations, AI integrations, and connections to multiple data sources.
Use Power BI for:
- Large Datasets: When your data grows to millions of rows (e.g., multi-year sales across sources), Power BI’s data engine handles it efficiently
- Interactive Dashboards: Creating dynamic visuals for executives or teams to filter and drill into details, such as a sales trend with drill-down by region
- Automation & Refresh: Connecting to live data sources (SQL databases, cloud apps, APIs) and refreshing reports on a schedule
- Data Security & Sharing: Controlling access with row-level security and publishing to the Power BI Service
- Collaboration: Sharing dashboards and apps with teams through the Power BI Service
- Advanced Analytics: Building DAX measures and KPIs, using time-intelligence, and leveraging AI-assisted insights
- Enterprise Reporting: Combining internal transactional data with external sources (e.g., CRM systems) in a governed model
Key Differences Between Excel & Power BI
| Feature | Excel | Power BI |
|---|---|---|
| Data Capacity | ~1,048,576 rows, 16,384 columns; workbooks can struggle with very large data | Designed to handle millions of rows efficiently (import or DirectQuery) |
| Learning Curve | Widely known and beginner-friendly | Requires modeling concepts and DAX skills |
| Visualization | Highly customizable charts; interactivity via slicers and filters | Interactive, cross-filtered visuals with drill-down |
| Interactivity | Slicers, filters, and basic drill-downs | Drill-through, bookmarks, tooltips, and sophisticated filtering |
| Cloud Capabilities | File-based; cloud-enabled via OneDrive/SharePoint and Excel for the web | Cloud-based sharing and governance via the Power BI Service |
| Security | Workbook-level protection and permissions | Role-level security and controlled sharing |
| Collaboration | File sharing and real-time coauthoring via OneDrive/SharePoint | Cloud publishing with workspaces, apps, and role-based access |
| Accessibility | Offline desktop with optional web access; manual or scripted updates | Cloud access across devices; supports scheduled, automated refresh |
| Cost | Included in many Microsoft 365 plans | Desktop free; Pro typically $9.99/user/month |
How to Best Combine Excel and Power BI
Instead of treating Excel and Power BI as competitors, think of them as partners. In many organizations, the real value emerges when you combine both tools. This approach leverages Excel’s flexibility for data preparation and Power BI’s strengths in modeling, visualization, and governed sharing.
Prepare Data in Excel:
- Import raw data (CSV, text, small ERP exports)
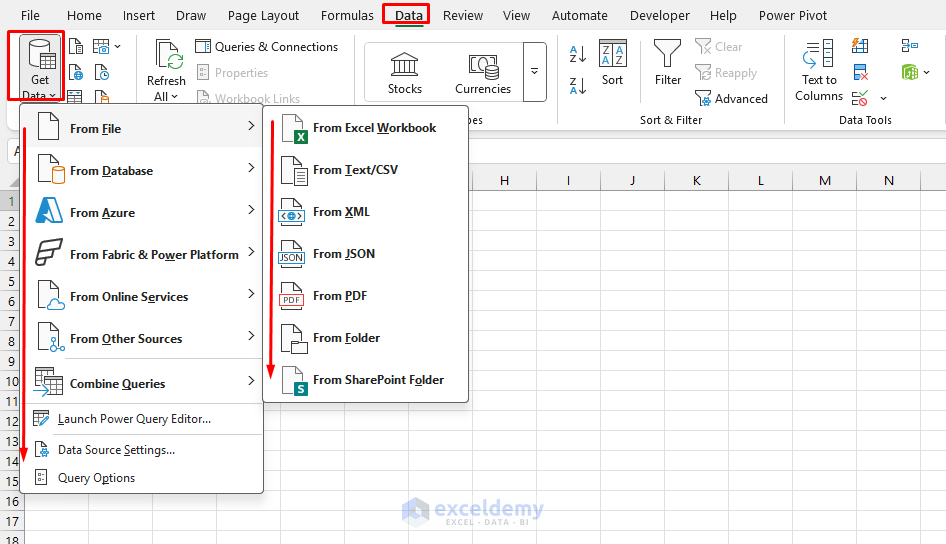
- Go to the Data tab >> select Get Data >> select data source
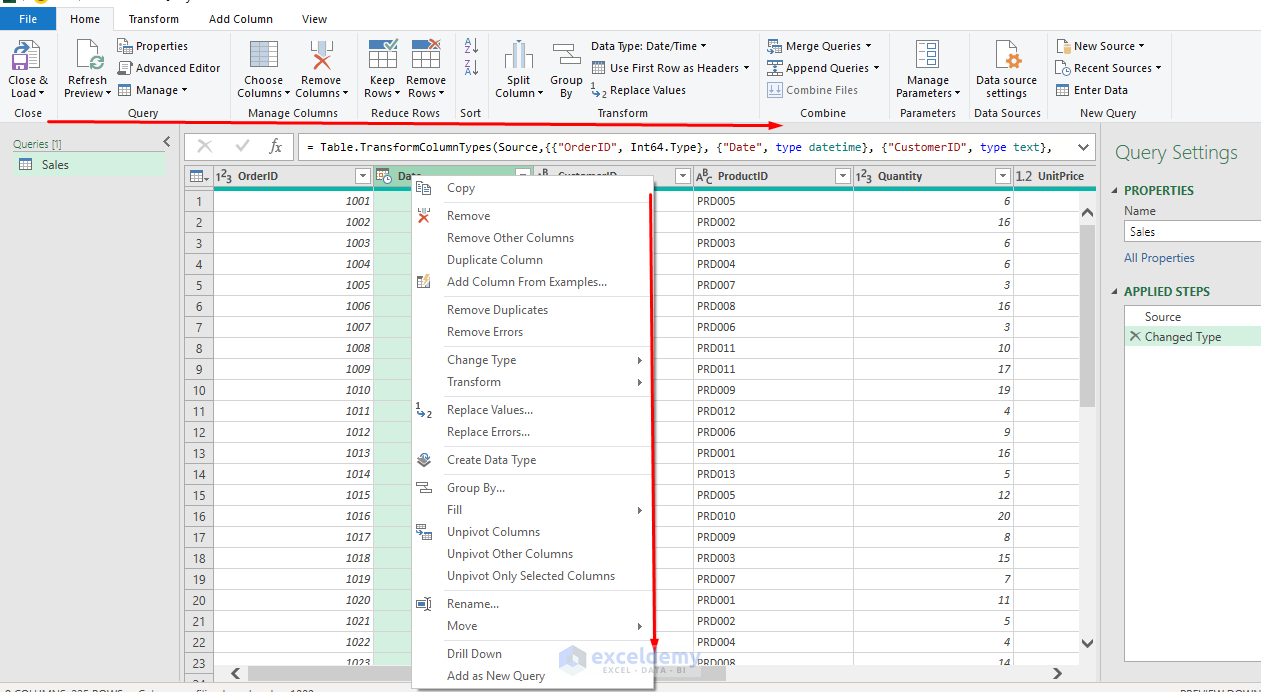
- Clean and transform using Power Query in Excel (e.g., remove duplicates, standardize dates)
- Validate results with formulas
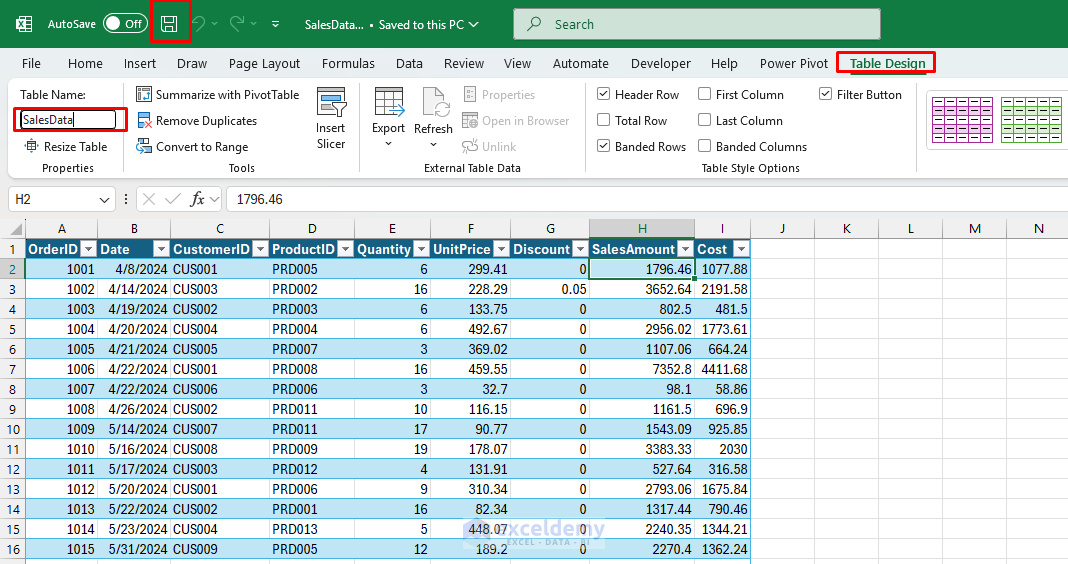
- Save as a structured Excel table and name it SalesData
Import to Power BI:
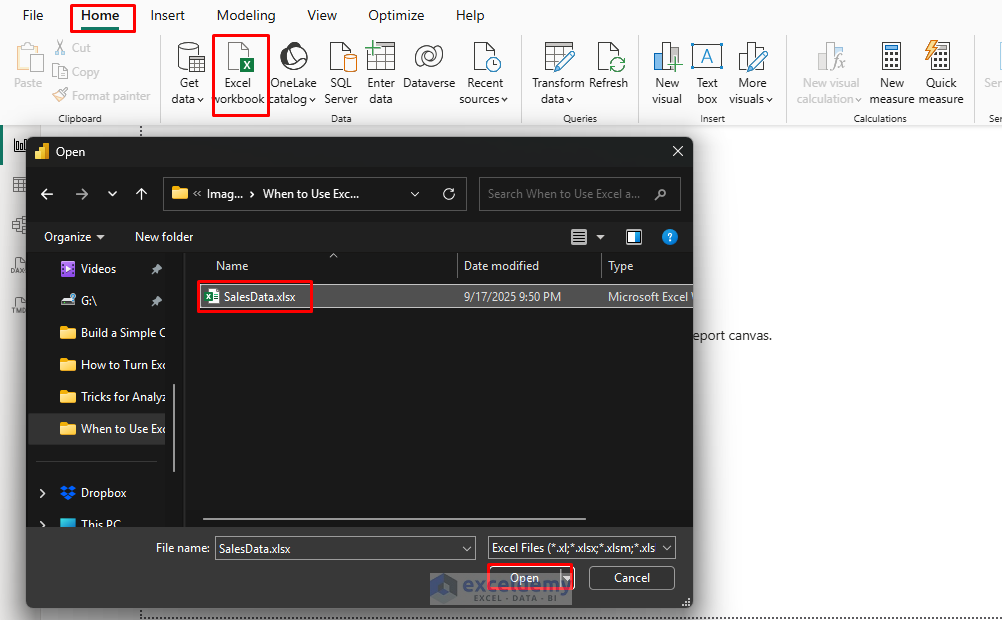
- Open Power BI Desktop
- Go to the Home tab >> select Excel Workbook
- Browse and select your Excel file
- Load the “SalesData” table (and any related tables or queries)
- Verify data integrity in the Data view
- Import the cleaned Excel table into Power BI
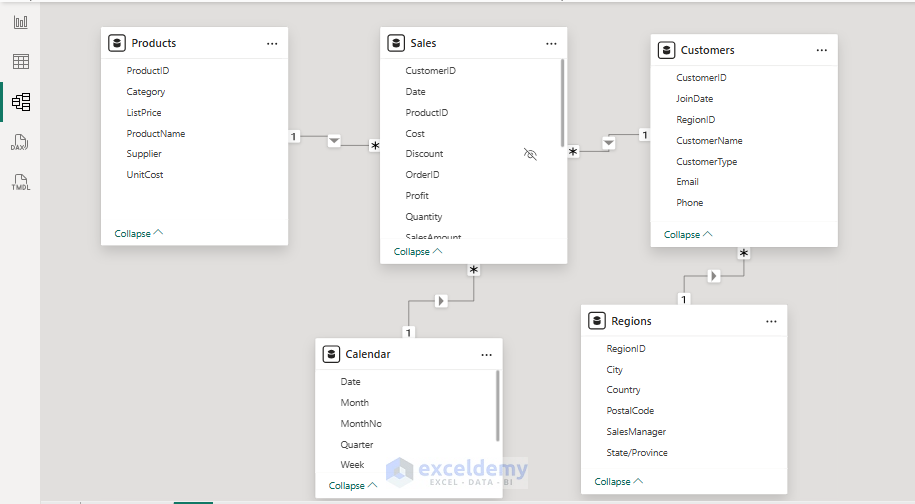
Enhance in Power BI:
- After importing the cleaned Excel data, create an interactive report
- In the Model view, create relationships as needed
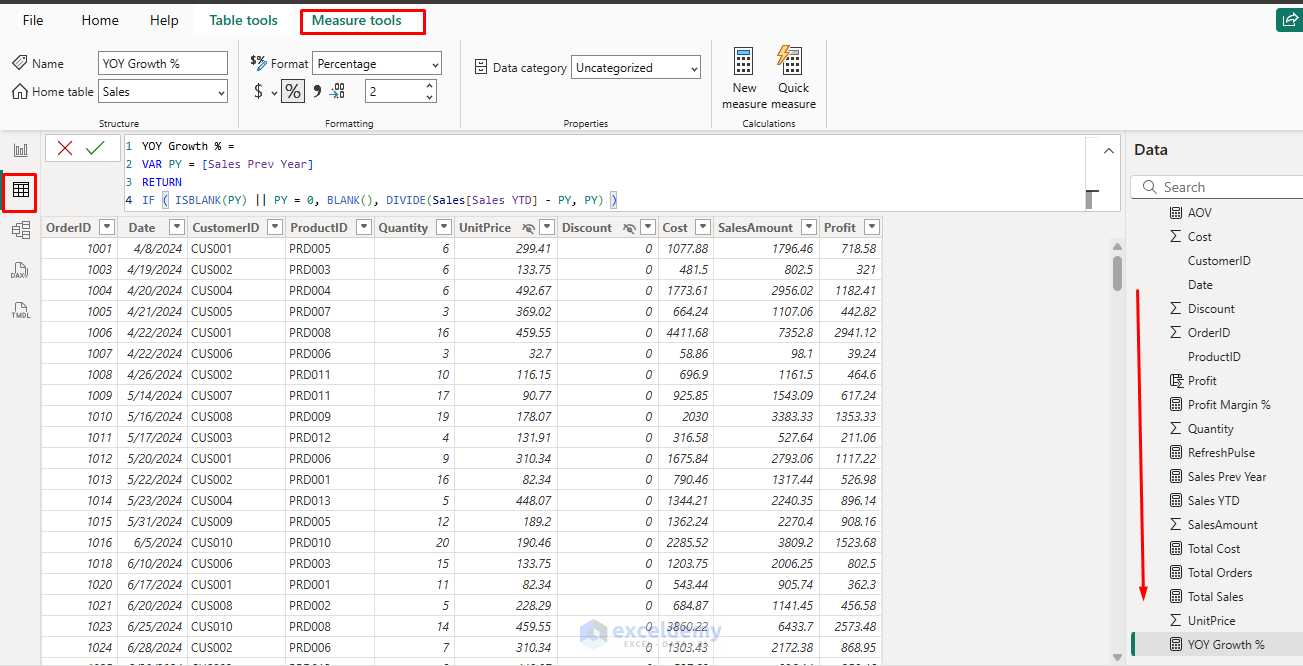
- DAX Measures and KPIs:
Total Sales = SUM(Sales[SalesAmount])
Sales YTD = TOTALYTD ( [Total Sales], 'Calendar'[Date] )
YOY Growth % =
VAR PY = [Sales Prev Year]
RETURN
IF ( ISBLANK(PY) || PY = 0, BLANK(), DIVIDE([Sales YTD] - PY, PY) )
- Create visuals to show revenue trends by month, sales by country, product, and more
- Add slicers for Country and Product, and enable drill-down to view monthly details

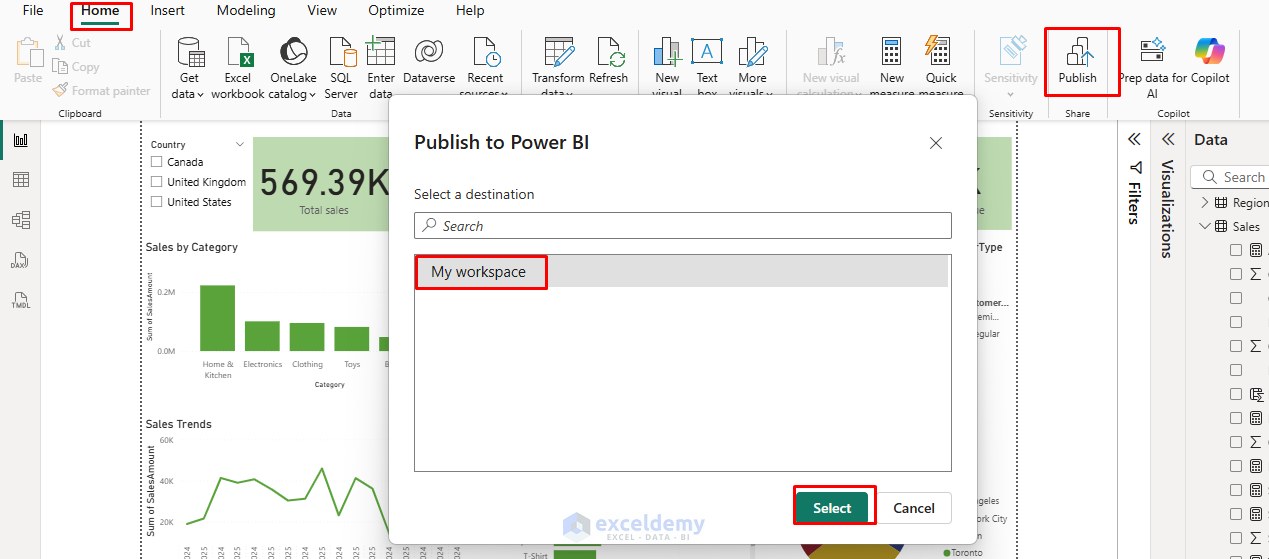
Publish and Share:
- Save the Power BI report and publish it to the Power BI Service
- Set up a scheduled refresh if the Excel file is on OneDrive
- Share the dashboard with your team and configure role-based access
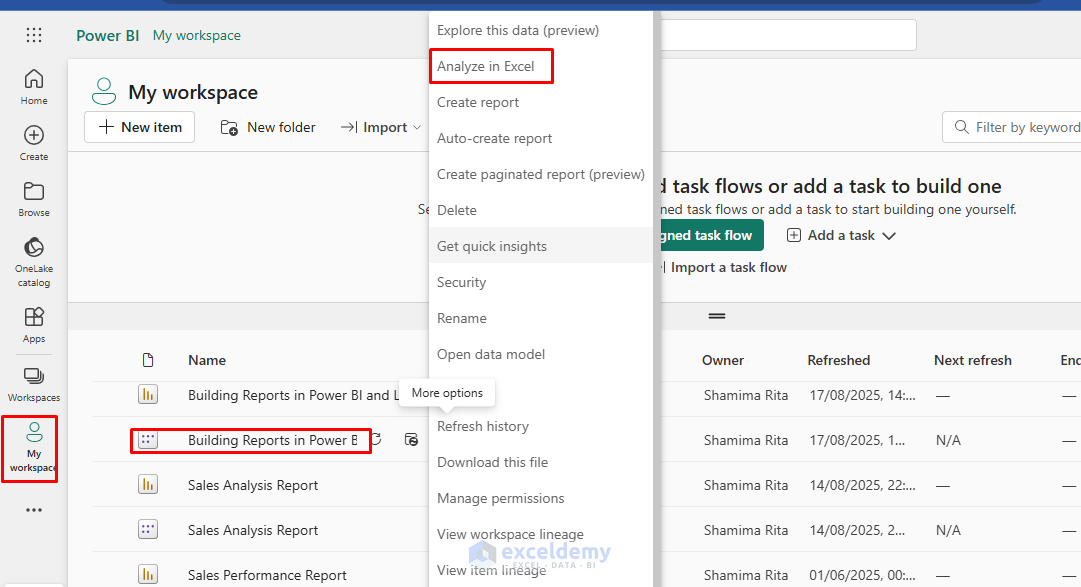
Analyze Back in Excel:
- You can connect Power BI to Excel directly
- Go to the Data tab >> select Get Data >> select From Power BI
- Or, in the Power BI Service, select the semantic model
- Right-click >> select Analyze in Excel to connect the dataset
- Download the Power BI file
- Open the file in Excel to create additional PivotTables or custom calculations (e.g., sales by country and city)

- Save updates back to the Excel file for future refreshes
Tips:
- Ensure Excel tables are properly formatted (no blank rows/columns) for smooth Power BI import
- Use OneDrive to keep the Excel file synced for automatic refreshes
- Train your team in basic Power BI skills to maximize collaboration
Conclusion
Excel and Power BI are not competitors; they are complementary tools. Excel is best when you need flexible, formula-driven, ad-hoc analysis. Power BI excels at building scalable, automated, interactive, shareable dashboards. By preparing data in Excel and visualizing it in Power BI, you create a seamless workflow that reduces errors, improves collaboration, and delivers insights that drive decision-making.
Get FREE Advanced Excel Exercises with Solutions!
