
Microsoft Excel is the world’s most popular spreadsheet tool for tracking, analyzing, and storing data. But Power BI transforms static Excel spreadsheets into dynamic, interactive dashboards that tell compelling data stories.
This tutorial will show you how to unlock your Excel data by connecting your spreadsheets to Power BI.
Step 1: Prepare Your Excel Data
Before connecting to Power BI, ensure your spreadsheet data is properly structured for analysis.
Clean Your Data:
- Remove extra spaces in text fields.
- Ensure date formats are consistent.
- Fill in blank cells or use consistent null indicators.
- Avoid special characters in column headers.
Convert Data to Excel Tables:
- Select your entire dataset.
- Go to the Insert tab >> select Table (or press Ctrl+T).
- Ensure My table has headers is checked.
- Click OK.
- Name your table:
- Click anywhere in the table.
- Go to the Table Design tab >> select Table Name >> type SalesData.

Step 2: Launch Power BI Desktop
Install Power BI Desktop:
- Visit the Microsoft Power BI website.
- Download Power BI Desktop.
- Install following the standard Windows installation process.
To Launch Power BI Desktop:
- Open Power BI Desktop.
- Click on Blank report.

Understand the Power BI Interface:
Power BI Desktop has four main views:
- Report View: Create visualizations and reports.
- Data View: Examine and modify your data.
- Model View: Manage relationships between tables.
- DAX query view: Write, test, and run DAX queries to analyze your data directly.
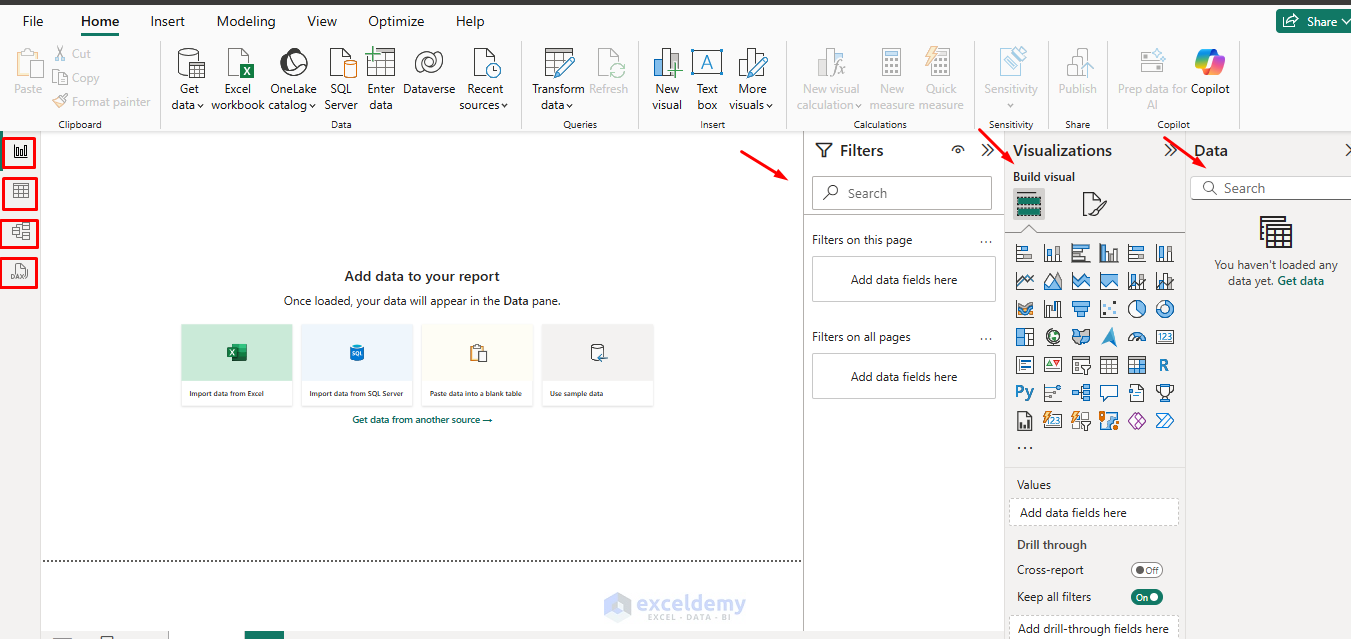
Step 3: Connect Excel Files to Power BI
- Go to the Home tab >> select Get Data >> select Excel Workbook from the list.

- Browse and select your Excel file.
- Click Open.

- In the Navigator window, select the tables/sheets you want to import.
- Click Load to load data directly or Transform Data for cleaning.

Step 4: Use the Power Query Editor
The Power Query Editor is where you clean and transform your data before loading it into Power BI.
Basic Transformations
Remove Unnecessary Columns:
- Right-click column headers you don’t need.
- Select Remove or Remove Other Columns.
Rename Columns:
- Right-click a column header >> select Rename.
- Type the new name.
- Press Enter.

Change Data Types:
- Click the data type icon next to the column name.
- Select the appropriate data type (Text, Number, Date, etc.).

Filter Data:
- Click the drop-down arrow in any column header.
- Uncheck values you want to exclude.
- Click OK.
Advanced Transformations
Create Calculated Columns:
- Go to the Add Column tab >> select Custom Column.
- New column name: Revenue.
- Enter a formula using the M language.
- Click OK.
=[Sales Amount] - [Cost]

Group Data:
- Go to the Home tab >> select Group By.
- Select grouping columns.
- Choose an aggregation method (Sum, Count, Average, etc.).

Apply Changes:
Once you’ve made all necessary transformations, you can apply the changes to the dataset.
- Go to the Home tab >> select Close & Apply.
- Power BI will load your cleaned data.
- You’ll return to the main Power BI interface.

Step 5: Create Your First Visualizations
Insert Charts:
- Open the Report canvas from the left navigation pane.
- Click the Clustered Column Chart from the Visualizations panel.
- Drag fields to the Axis and Values areas.
- Category on the X-axis.
- Revenue on the Y-axis.

Add Slicers:
Slicers are powerful filters for your dashboard.
- Select Slicer from the Visualizations panel.
- Drag fields from the table to the Field.
- Region
- Category

Insert Table:
- Select the Matrix table from the Visualizations panel.
- Drag the following fields.
- Rows: Month.
- Values: Sales Amount, Cost, and Revenue.

Work with Fields:
The Fields panel on the right shows all available columns from your Excel data.
- Drag fields directly onto visualizations.
- Drop fields into specific areas (Axis, Legend, Values).
- Use the same field multiple times with different aggregations.
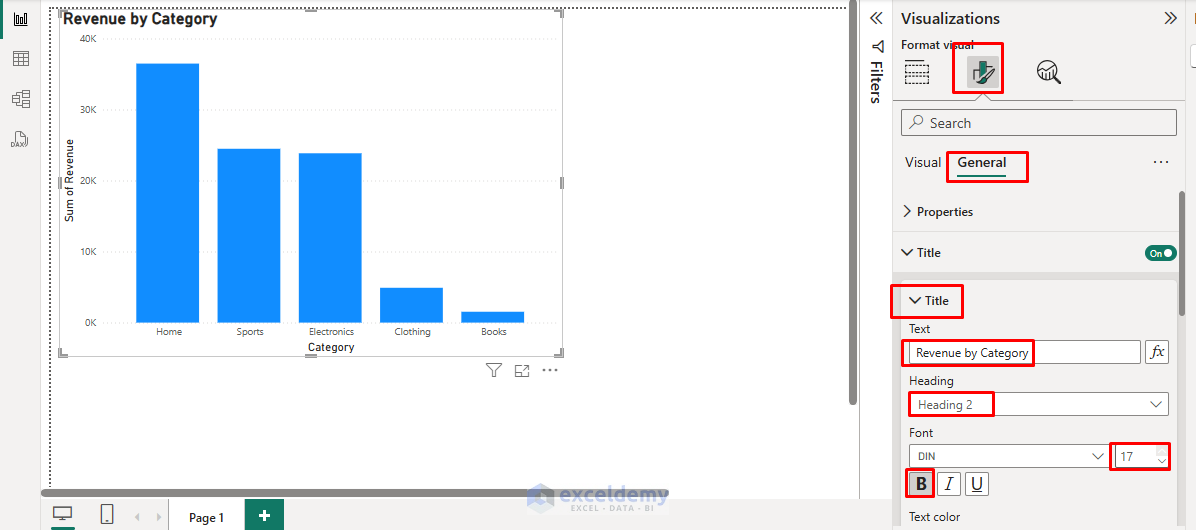
Format Visualizations:
Click on any chart to access formatting options.
- Format tab (paint roller icon) for colors, fonts, and styling.
- Data tab for field assignments.
- Analytics tab for trend lines and reference lines.

Step 6: Build Interactive Dashboards
Create Multiple Visualizations:
- Add several charts to your report page.
- Each chart can show different aspects of your data.
- Use a mix of chart types for comprehensive analysis.
- Users can click the slicer options to filter all visuals.

- Go to the View tab >> select Theme.

Cross-Filtering:
Power BI automatically creates relationships between your visualizations.
- Click on a data point in the bar chart.
- Watch other charts filter automatically.
- This interactivity helps users explore data naturally.

Step 7: Refresh Your Data
Manual Refresh:
When your Excel data changes.
- Go to the Home tab >> click Refresh.
- Power BI will reload data from your Excel files.
- All visualizations update automatically.

Automatic Refresh (Power BI Service):
For automatic updates, publish to Power BI Service.
- Go to the Home tab >> click Publish in Power BI Desktop.
- Sign in to the Power BI Service online.

- Choose a workspace destination.

- Set up a scheduled refresh in the Power BI Service.
- Your dashboards stay current automatically.
Advanced Features
Once you’ve mastered connecting Excel to Power BI, consider exploring the following options.
- Advanced DAX formulas for complex calculations.
- Data modeling for multiple related tables.
- Custom visualizations from the Microsoft marketplace.
- Power BI Mobile for on-the-go access.
- Integration with other data sources, like databases or web services.
Conclusion
Connecting spreadsheets to Power BI opens up powerful data analysis and visualization possibilities. By following the above steps, you can unlock your Excel data in Power BI. Start with simple connections and gradually build more sophisticated reports as your skills develop. The key is to begin with clean, well-structured data and focus on answering specific business questions through your visualizations.
Get FREE Advanced Excel Exercises with Solutions!
