Excel Solver is a powerful tool for optimizing equations based on assumptions within an Excel spreadsheet.
What Is Multi-Objective Optimization?
Multi-objective optimization involves finding the optimal solution or value for an equation while considering multiple objectives. This approach is widely used in various fields such as engineering, mathematics, and economics.
Scenario Example:
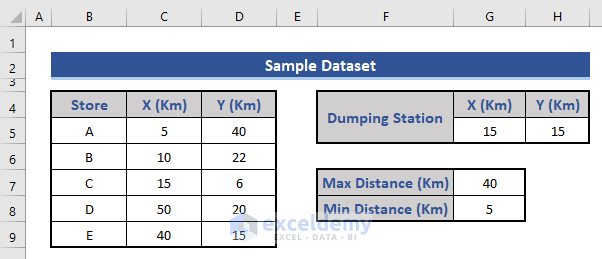
Imagine a super shop company with five stores. The company aims to strategically place a warehouse that serves all the stores efficiently. To achieve this, we need to consider several conditions:
- Distance Constraints: The warehouse must be at an optimal location, balancing maximum and minimum distances from each store to minimize transportation costs.
- Avoiding a Dumping Station: Additionally, there’s a dumping station in the area. We must ensure the warehouse is located farthest away from this station.
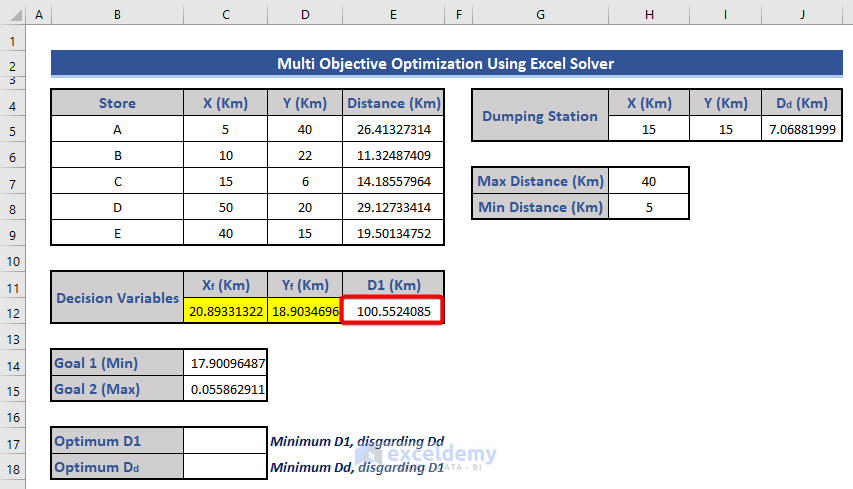
Step 1 – Set Up Variables and Conditions
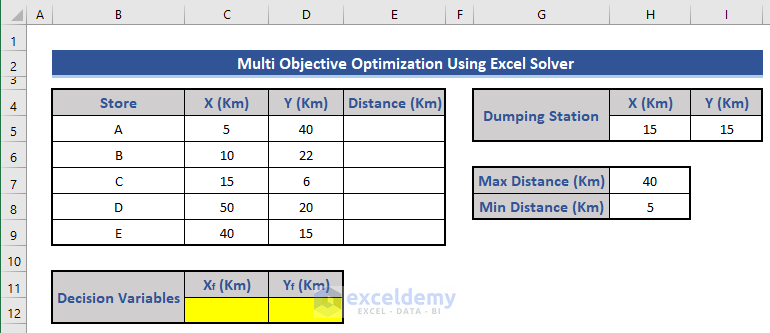
- Define the maximum distance (40 km) and minimum distance (5 km).
- Determine the location of the dumping station.
- Calculate the decision variables based on these conditions.
Read More: Schedule Optimization in Excel
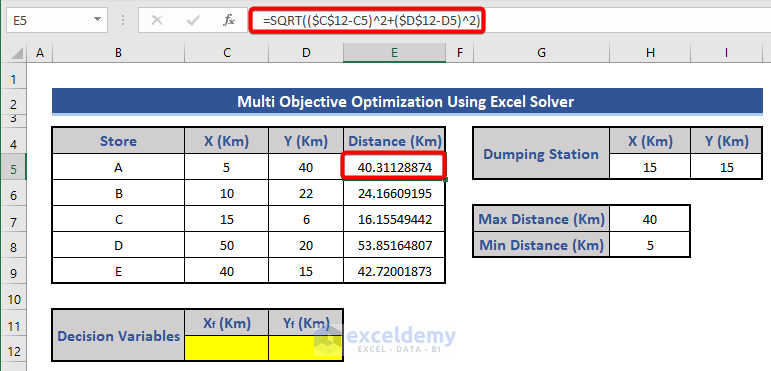
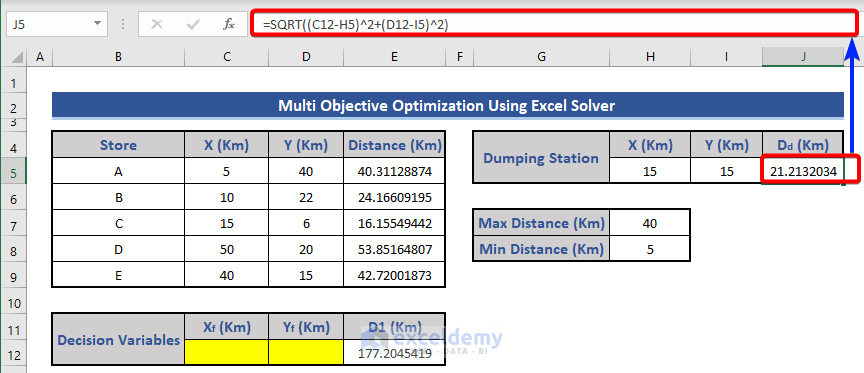
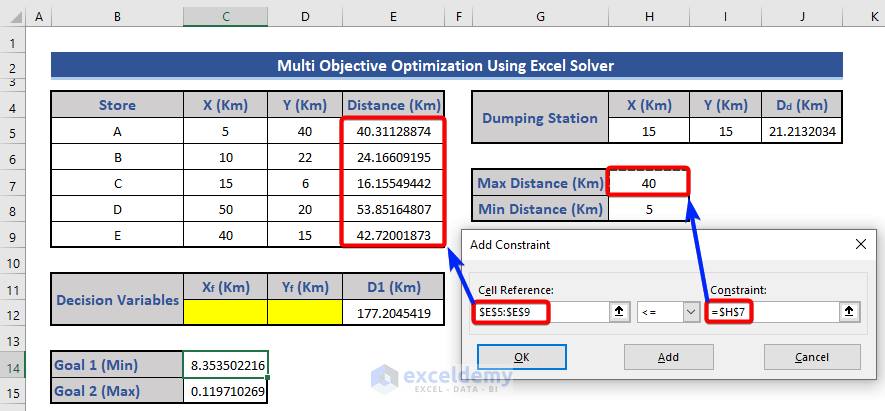
Step 2 – Calculate Store-to-Warehouse Distances
- Assume the warehouse’s initial location is (X,Y) = (0,0).
- Use the distance formula to calculate the distance from each store to the warehouse:
=SQRT(($C$12-C5)^2+($D$12-D5)^2)
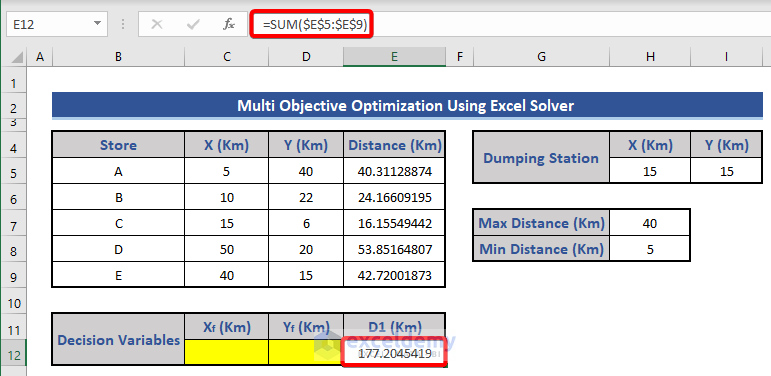
- Sum up all the distances in cell E12 entering the formula:
=SUM($E$5:$E$9)
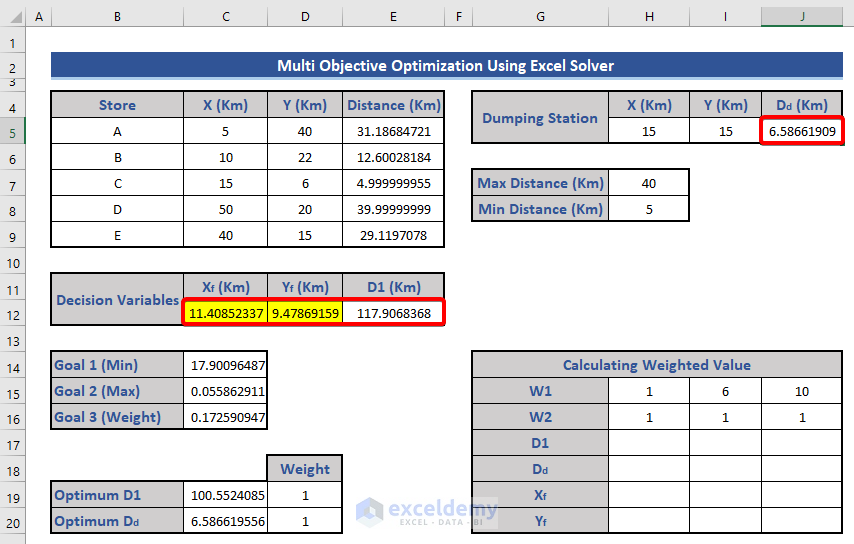
- Calculate the distance from the dumping station to the warehouse in cell J5 using:
=SQRT((C12-H5)^2+(D12-I5)^2)
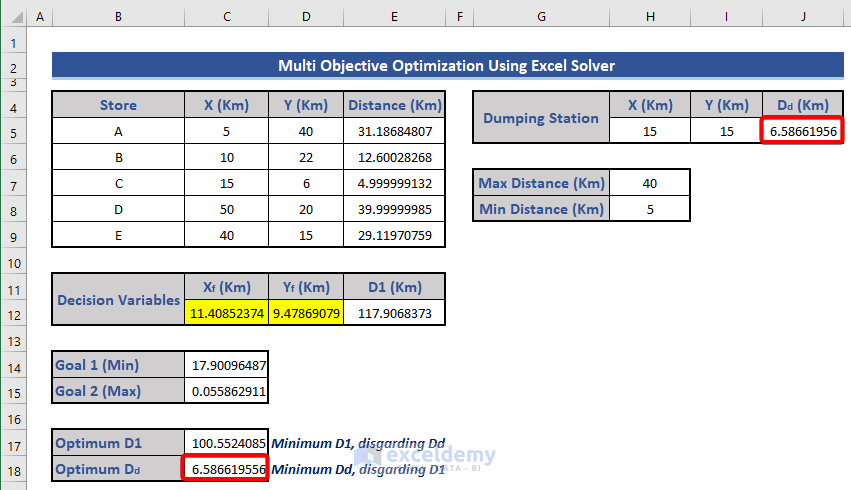
Step 3 – Set Goals in the Dataset
- Define the first two goals:
- Goal 1: Ratio of the sum of distances from each store to the dumping station distance (Cell C14):
=E12/J5
-
- Goal 2: Ratio of the dumping station distance to the sum of distances (Cell C15):
=J5/E12
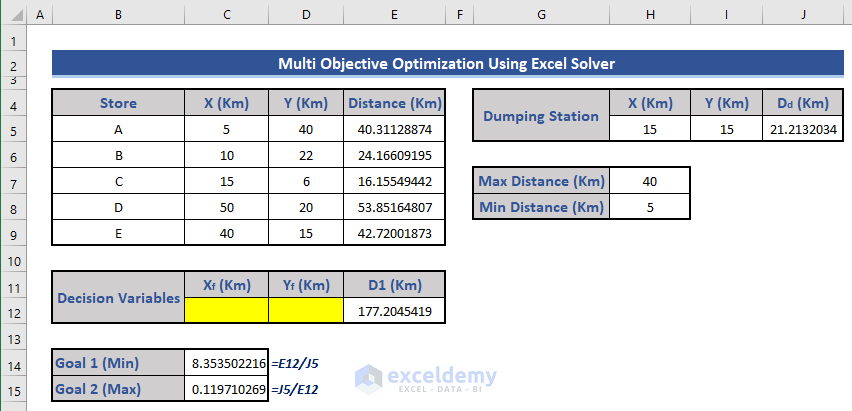
- Set minimum and maximum acceptable values for these goals.
Step 4 – Enable Excel Solver
- Navigate to File, choose Options and select Add-ins.
- Choose Excel Add-ins from the Manage section and click Go.
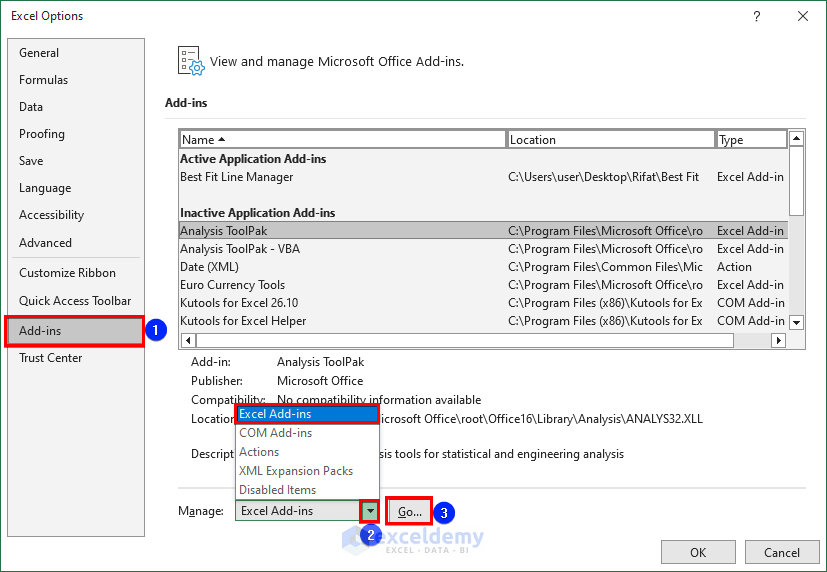
- Select the Solver Add-in and press OK.
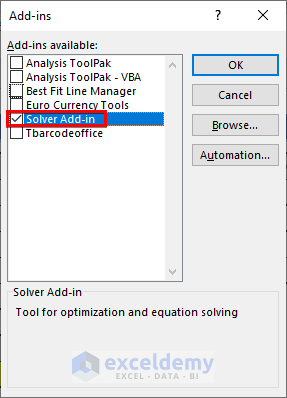
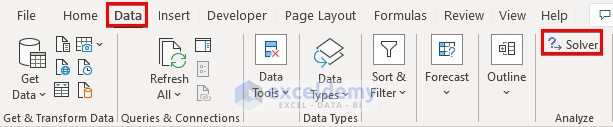
- Go to the Data tab, where you’ll find the Solver add-in.
Read More: How to Solve Network Optimization Model in Excel
Step 5 – Use Solver to Calculate Goals
- Click on Solver (as shown previously).
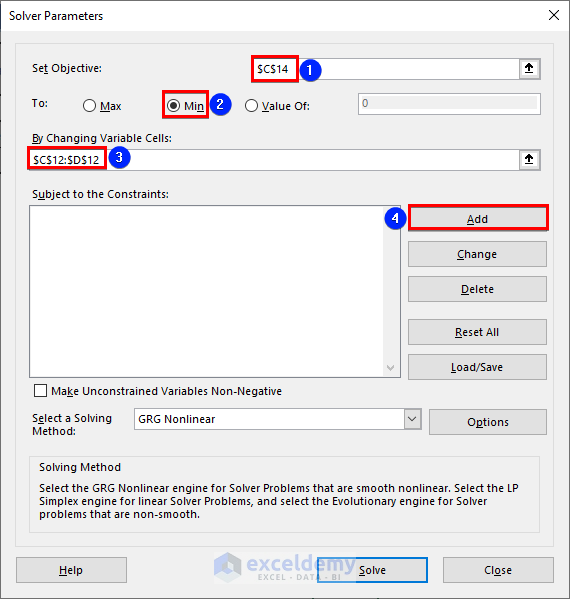
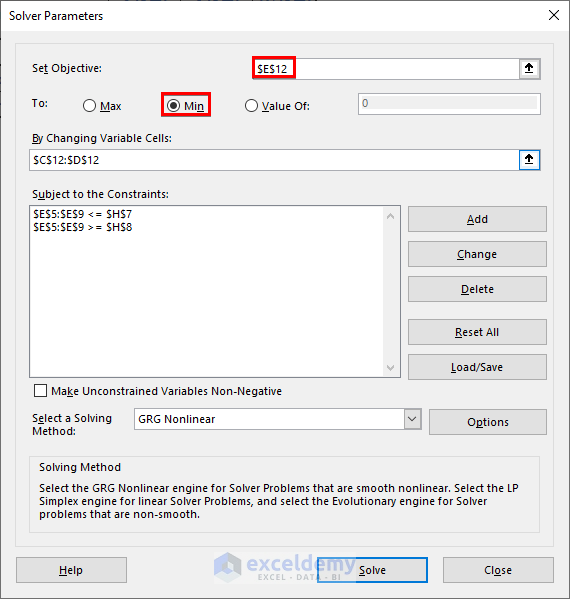
- In the Solver Parameters window:
- Set Objective: Cell C14 (Goal 1).
- Select Min (since we want the minimum value).
- Choose Range C12:D12 as the variable range.
- Click Add to set constraints.
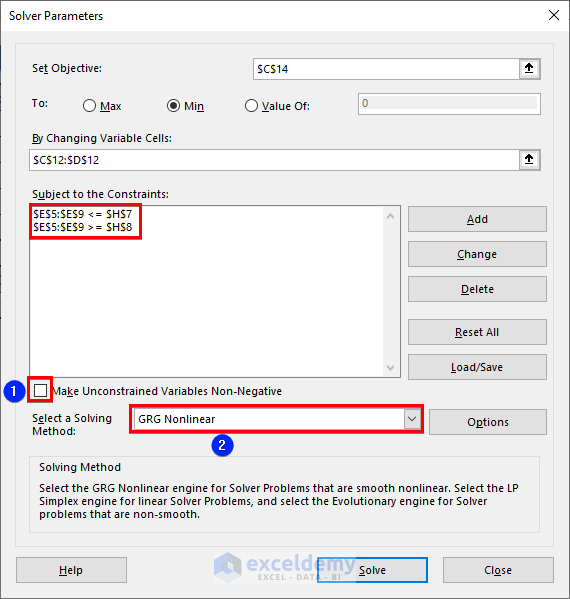
- Define the distance constraints for stores (40 km to 5 km).
- Unmark Make Unconstrained Variables Non-Negative.
- Choose GRG Nonlinear as the solving method.
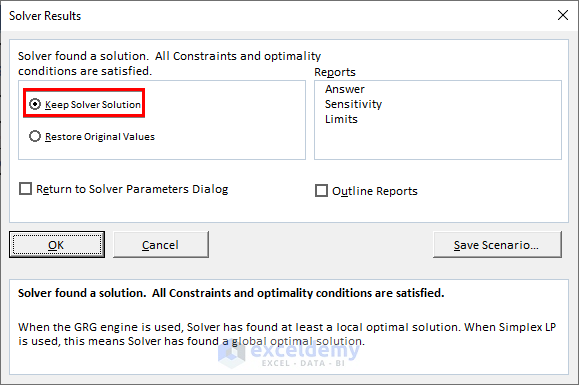
- Click Solve.
- Keep the Solver Solution when prompted.
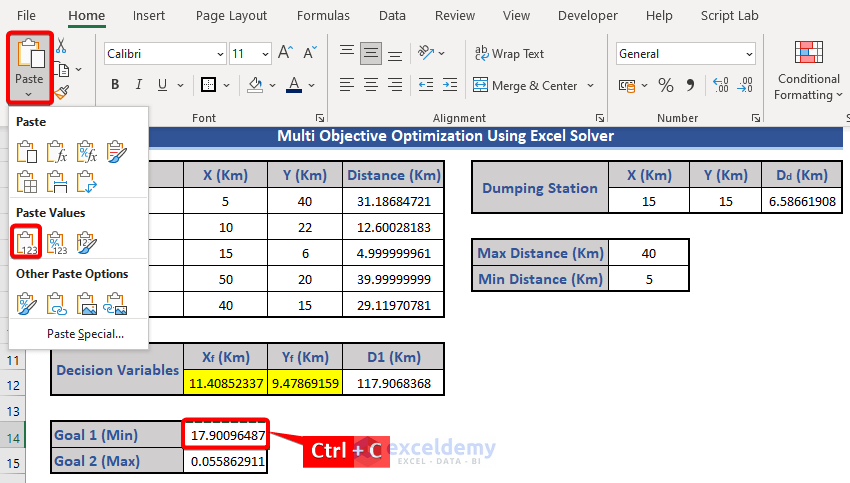
- Copy the value from Cell C14 (Ctrl+C).
- Paste the value as Values (V) and clear C12 and D12.
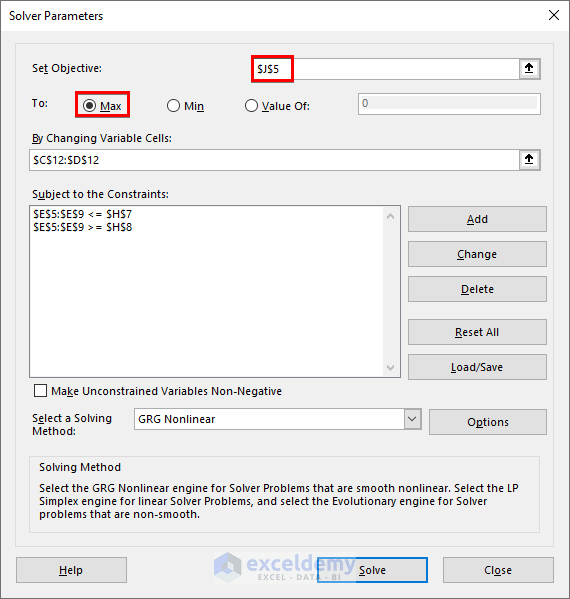
- Let’s determine the value of Goal 2 using the Solver.
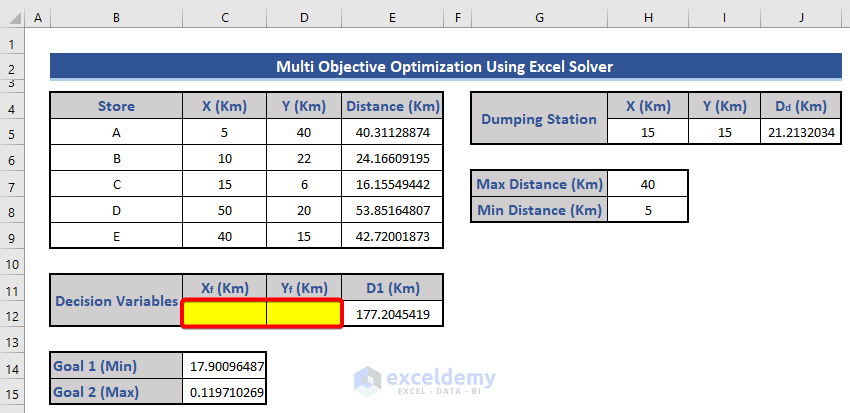
- Choose cell C15 (corresponding to Goal 2) as the objective.
- Select the Max option.
- Keep the other conditions the same.
- Press the Solve button.

- Observe the dataset to find the maximum value for Goal 2.

Read More: How to Solve Linear Optimization Model in Excel
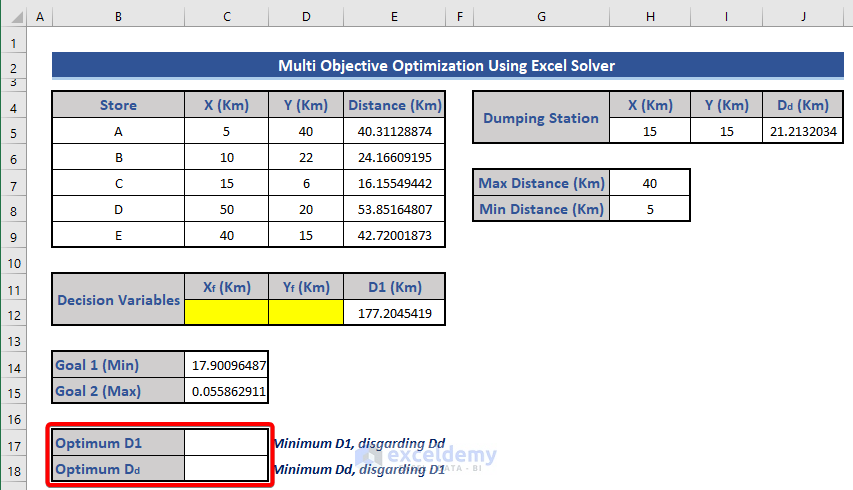
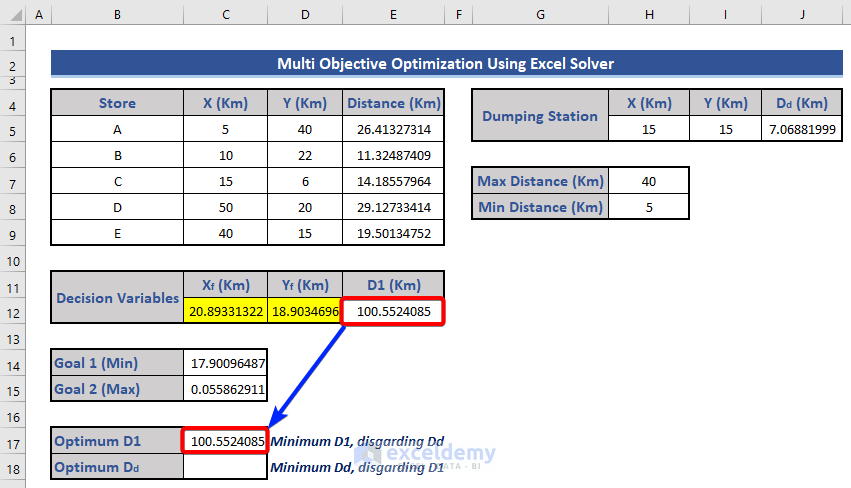
Step 6 – Determine the Optimum Distances
- Add two new rows in the dataset to calculate optimum values.
- Click on the Solver (as shown previously).
- Determine the minimum value for D1:
- Set cell E12 as the objective and choose the Min option.
- Constraints remain the same as before.
- Click Solve and observe the updated dataset.
- Copy and paste only the values from cell E12 to cell C17.
- Apply a similar Solver operation to find the maximum value of Dd:
- Choose cell J5 as the objective and select the Max option.
- Click Solve.
- Copy the maximum value of Dd to cell C18.
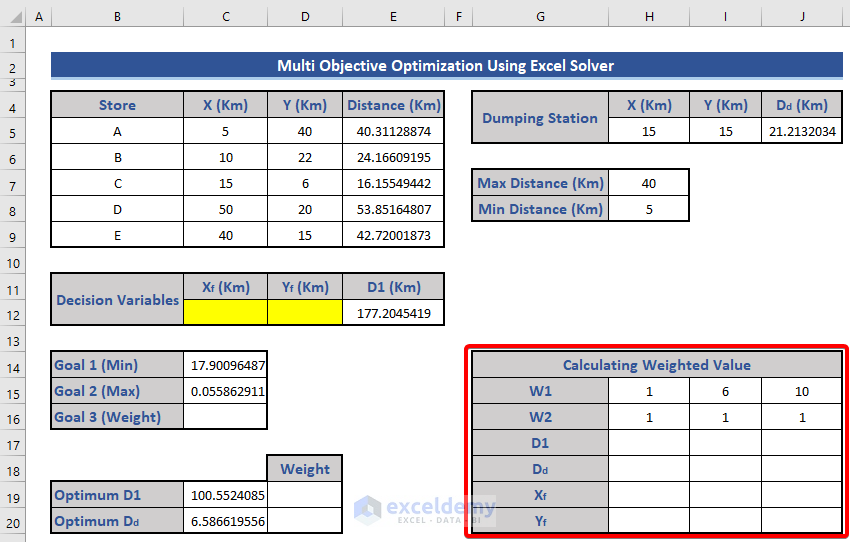
Step 7 – Determine the Weighted Values
- Weighted Value Equation:
- We’ll calculate the weighted value for Goal 3 using the following equation:
W(D1)*ABS((Optimum D1-Actual D1))/Actual D1+ W(Dd)*ABS((Optimum Dd-Actual Dd))/Actual Dd
-
- Set the weight values:
- W1 for D1: 1, 6, 10
- W2 for Dd: 1, 1, 1
- Set the weight values:
-
- Initially, set W1 = 1 and W2 = 1.
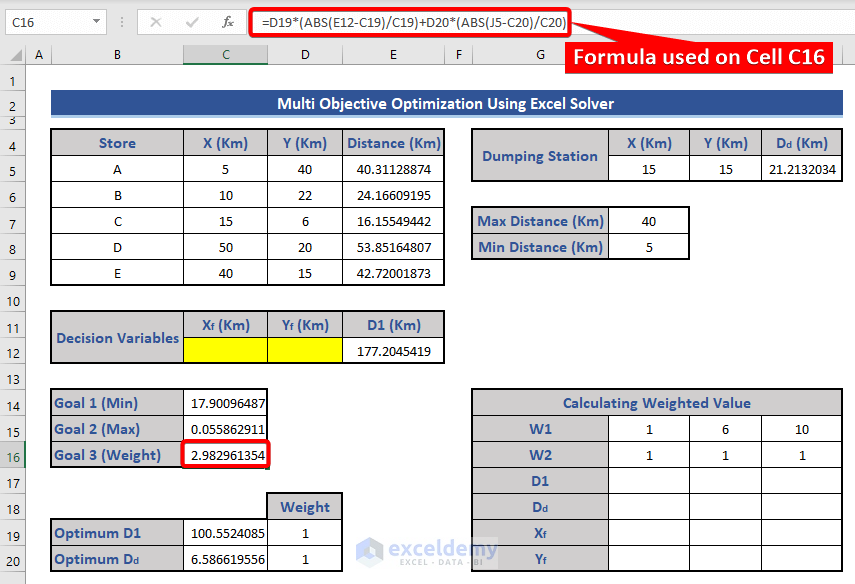
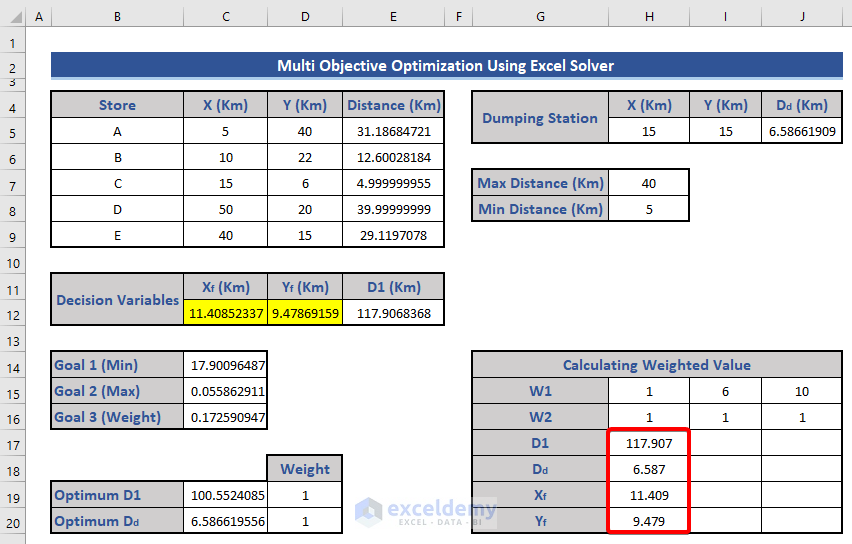
- Enter the equation in cell C16:
=D19*(ABS(E12-C19)/C19)+D20*(ABS(J5-C20)/C20)
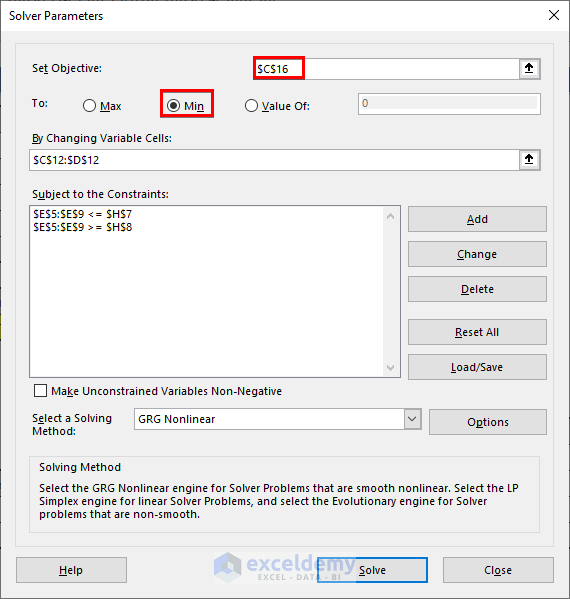
- Solver for Weighted Value:
- Use the Solver:
- Set cell C16 as the objective and choose the Min option.
- Keep the rest of the variables and constraints the same.
- Press Solve.
- Use the Solver:
-
- The values of Xf, Yf, D1, and Dd will change due to the Solver.
-
- Copy only the updated values of Xf, Yf, D1, and Dd from the weighted value table.
- Adjusting Weight Values:
- Change the value of W1 to 6 and 10 (keeping W2 always at 1).
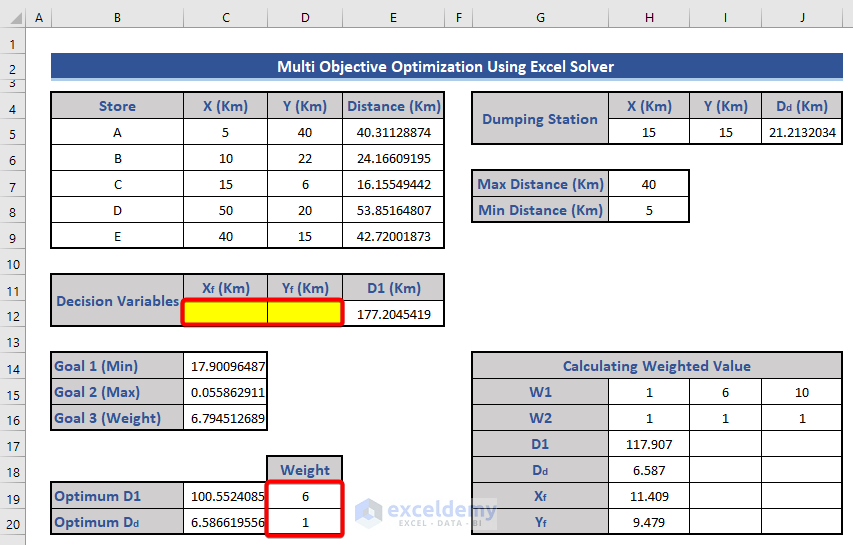
-
- Apply the Solver operation again and copy the resulting values in the table.
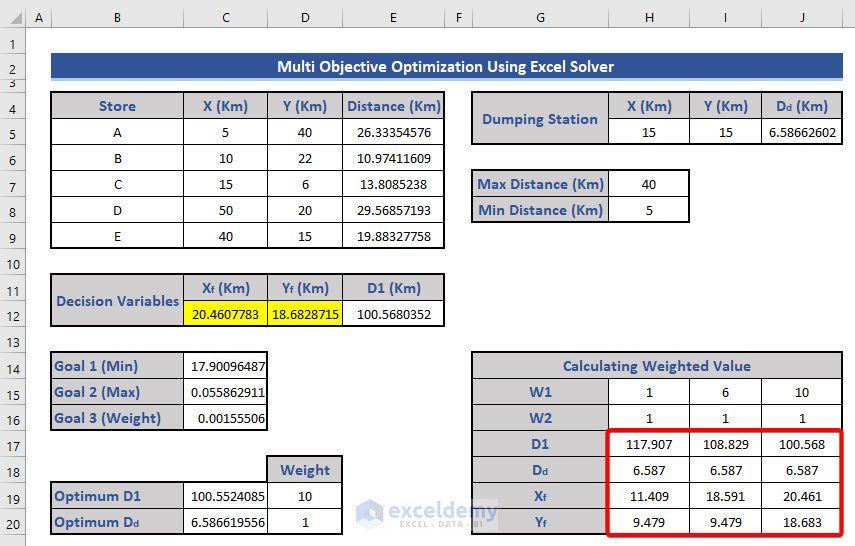
- Warehouse Location:
- There are three coordinates (Xf, Yf) where the warehouse can be placed.
- You can choose any of these three points for optimal placement.
Download Practice Workbook
You can download the practice workbook from here:
Related Articles
<< Go Back to Optimization in Excel | Solver in Excel | Learn Excel
Get FREE Advanced Excel Exercises with Solutions!
