The maximum likelihood analysis is widely performed in statistical and scientific analysis. This estimation is used for finding the likelihood of a certain parameter. The analysis can be performed with different approaches. In this article, we will perform maximum likelihood estimation in an Excel spreadsheet.
Basics of Probability and Likelihood
Probability: Probability means the likelihood of an event to occur. It deals with the occurrence of future events. Probabilities do add up to be 1.
Likelihood: Likelihood refers to past events with known outcomes. Unlike probability Likelihood together doesn’t add up to be 1.
Find Maximum Likelihood Estimation in Excel: Step-by-Step Procedure
Finding maximum likelihood is generally a mathematical process. We are going to find the likelihood estimation by tossing a coin. For this analysis, we are using a binomial formula which is:
Step 1: Assumption for Maximum Likelihood Estimation
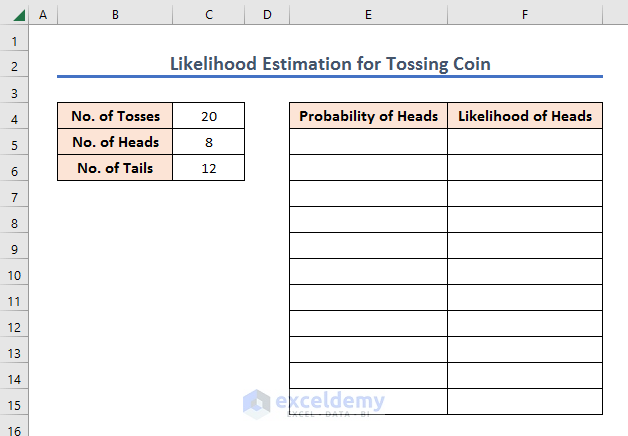
Let’s assume a coin has been tossed 20 times. The head comes up 8 times, and the tail comes up 12 times.
On the basis of this information, we will find the likelihood of head for different probabilities.
And, thereby, will be able to find its maximum likelihood.
➤ Add two columns where you will insert different probability values in Column E and Column F for calculating the Likelihood.
We have to insert different probability values in the Probability of Heads column. The probability of any given field varies from 0% to 100%.
➤ So, insert the probability values ranging from 0% to 100% at an increment of 10%.
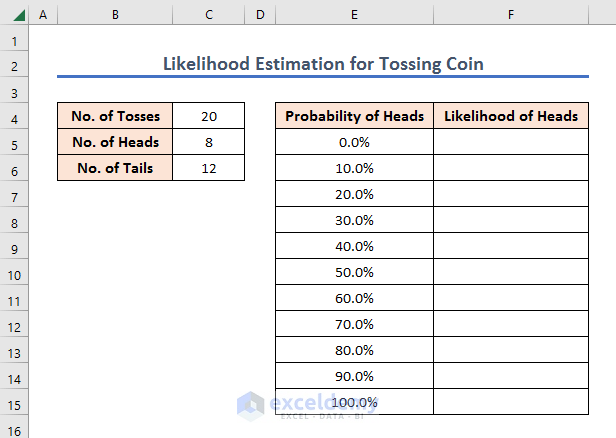
Note: You can change the probability increment interval according to your requirement.
Step 2: Use of COMBIN Function for Maximum Likelihood Estimation
Now, we have to find the likelihood for each probability. For this, we will use the COMBIN function.
The likelihood formula in binomial expression is given as:
=nCx*Px*(1-p)n-xIn this equation,
- n= No. of tosses
- P= probability of heads
- x= No. of heads
In the Excel sheet, we have to use this same formula.
➤ So, write the following formula in F5 and press ENTER.
=COMBIN($C$4,$C$5)*E5^$C$5*(1-E5)^$C$6Here,
- $C$4= No. of Tosses
- $C$5= No. of Heads
- $C$6= No. of Tails
- E5= Probability of Heads (Relative)
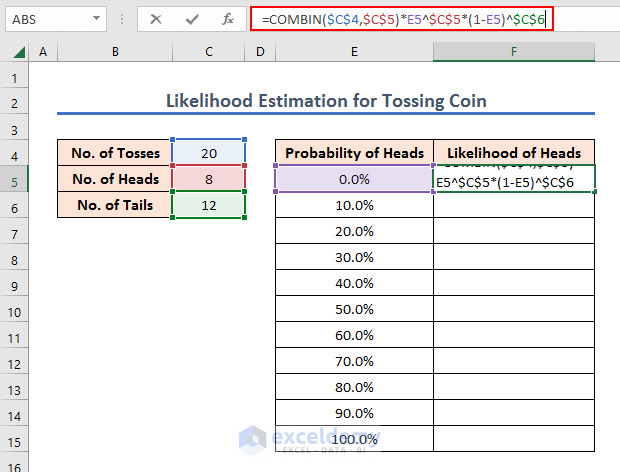
Thereby, we get the likelihood of 0% probability, which is also 0%.
➤ Now, hold and drag the F5 downward.

By doing so, we have got the likelihood of getting heads for all other Probabilities.

The above analysis means that the likelihood of getting heads is highest when the probability is 40%, and the maximum likelihood is about 18% which occurs for the probability of 40%.
Step 3: Using Chart to Show Result
Now, let’s use the Excel chart to show the maximum likelihood estimation.
➤ Copy the two columns Probability of Heads and Likelihood of Heads in a different sheet and paste them into suitable cells.
➤ After that, select the two columns and go to the Insert ribbon. Then, choose a suitable Insert Scatter(X,Y) or Bubble Chart.
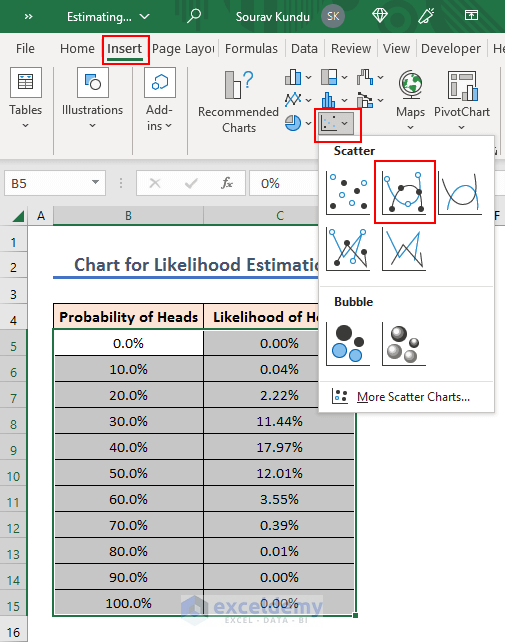
And, thereby, you will get a chart on the basis of your previous result. Where the Likelihood values will be along the Y-axis and the Probability values will be along the X-axis.

From this chart, we can see that the maximum likelihood occurs at 40% probability, which is 17.97%.
Read More: How to Do Kernel Density Estimation in Excel
Practice Section
We are providing a practice workbook that you can download and practice yourself.

Download Practice Workbook
You can download and practice this workbook.
Conclusion
So, that’s all for the article. We have shown you how to find the maximum likelihood estimation in Excel. Thank you for reaching out this far. We hope you find the content of this article useful. If there are any queries or suggestions, please do leave a comment.
<< Go Back to Excel Statistics Templates | Excel Templates
Get FREE Advanced Excel Exercises with Solutions!
