What Is Kernel Density Estimation?
The kernel density estimation is the process of estimating the probability density function for random values. This process makes the curve edges smooth based on the weighted values. It depends on the smoothing parameter called bandwidth. The mathematical formula to calculate kernel density estimation is given below:
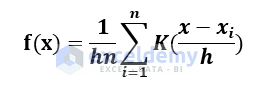
- K is kernel
- h is bandwidth
- n is the number of data
The kernel density estimation process is also applicable to machine learning applications.
For illustration, we will consider the data of the share price of Microsoft. We have collected data from finance.yahoo.com. We will import historical stock prices into Excel from Yahoo Finance.
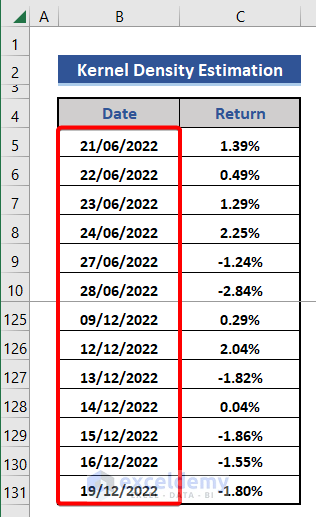
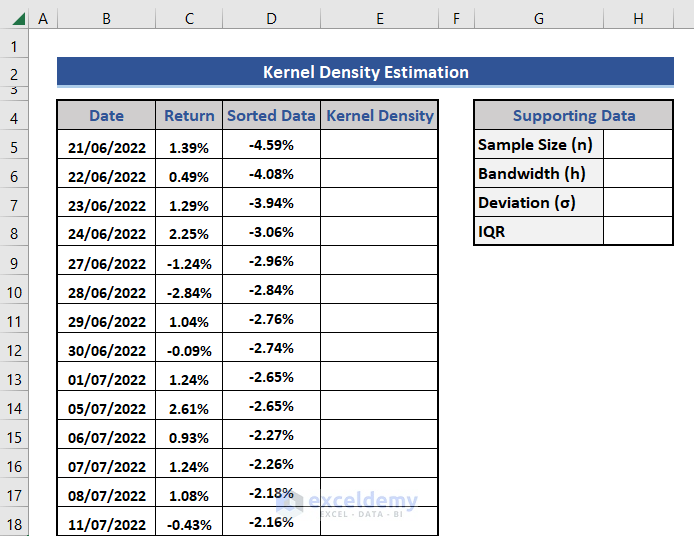
Step 1 – Collect Data for Kernel Density Estimation
- We inserted data for the last 6 months of Microsoft. This data indicates the change of share price day to day in percentile.
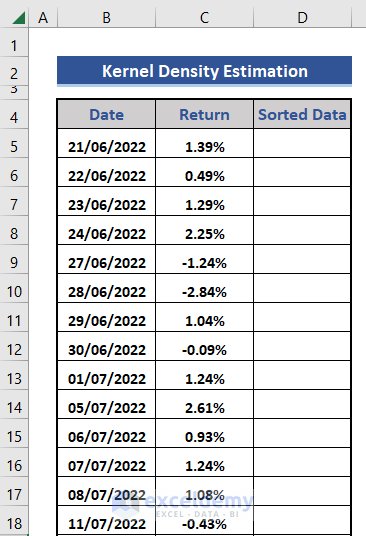
Step 2 – Sort the Collected Data Using Excel SORT Function
- Add a new row on the right side.
- Enter the following formula on cell D5.
=SORT(C5:C131,1,1,FALSE)
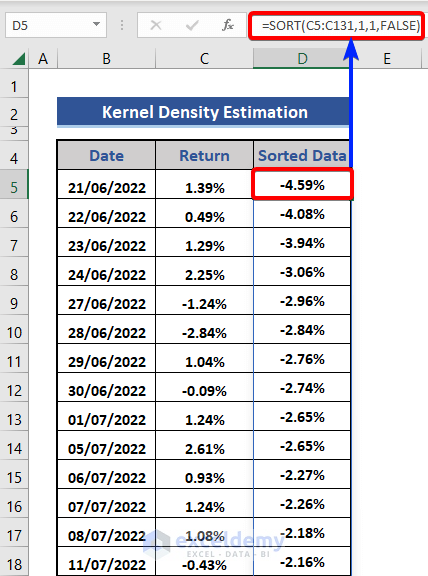
1st argument is the range, 2nd argument is the index number, 3rd argument is the sorting order and 4th argument for False for sorting based on row.
Step 3 – Add Supporting Data to Calculate Kernel Density
- Add new rows for the supporting data.
- To calculate the sample size, we will use the COUNT function. Put the following formula in cell H5.
=COUNT(D5:D131)
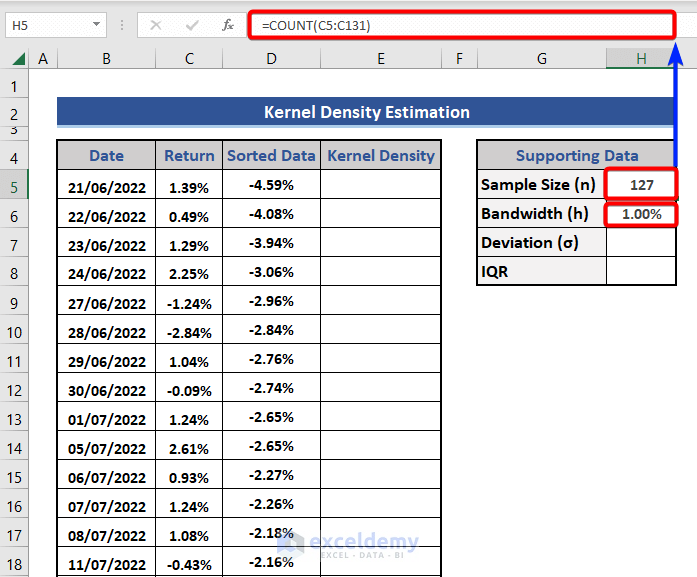
- Assume, the value of bandwidth (h) is 00%.
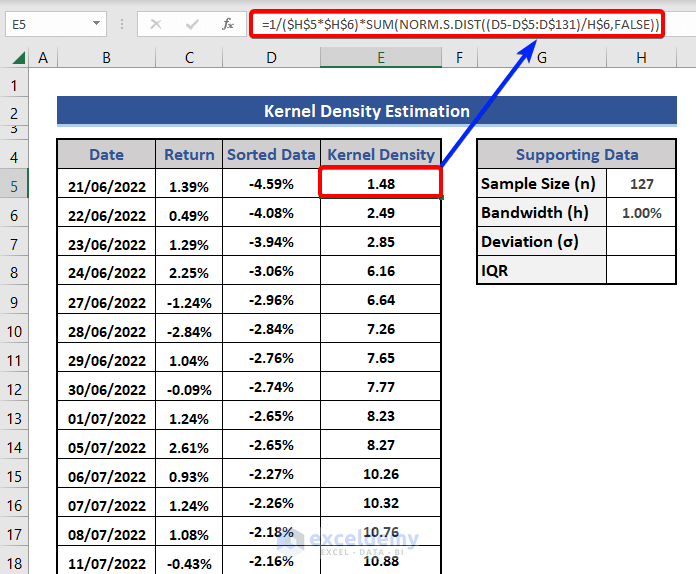
Step 4 – Calculate Kernel Density
- Enter the customized Excel formula in cell E5 and expand that to the last cell.
=1/($H$5*$H$6)*SUM(NORM.S.DIST((D5-D$5:D$131)/H$6,FALSE))
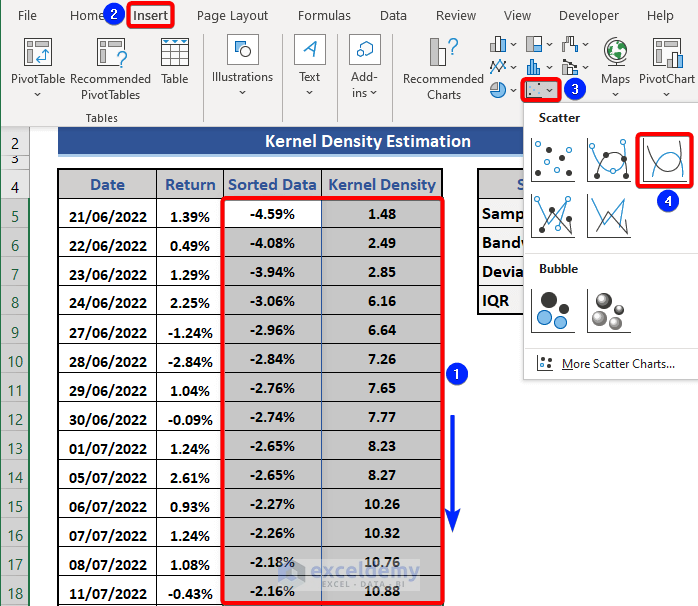
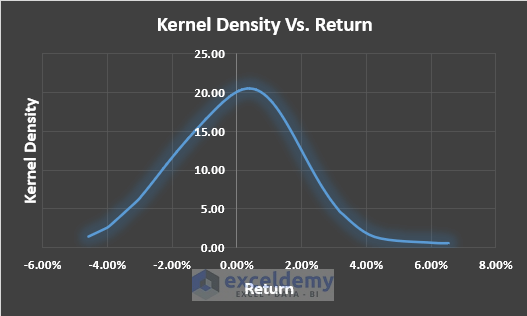
Step 5 – Plot a Suitable Excel Graph of Kernel Density vs Return
- Choose the range D5:E131.
- Click on the Insert tab.
- Choose the Scatter with Smooth Lines from the Charts group.
- We can see the Density Vs. Return graph. We get this graph for bandwidth 1.00%. This bandwidth is an assumption.
Step 6 – Compare the Kernel Density vs Return Graphs for Different Bandwidths
Change the bandwidth to see the change in the graph.
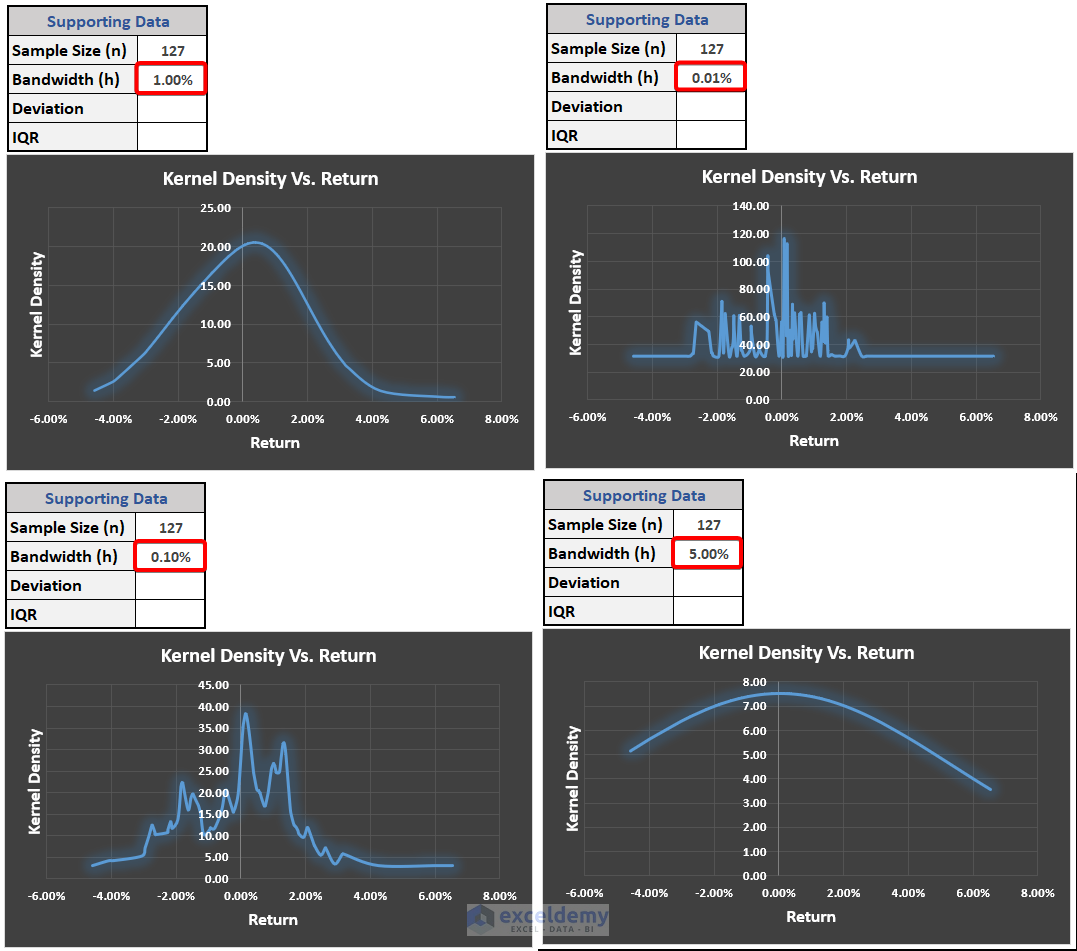
1st graph is for h=1.00%. The line is smooth. In the 2nd graph, h=0.01%, the line is a bit noisy. Increase the value of h in the 3rd graph and set that to 0.10%. See this is much better than the 2nd one. In the 4th graph, h=4.00%, and the graph is close to a straight line. But this assumption may not be correct all the time.
Additional Step: Calculate Bandwidth with Formula and See the Changes in Graph
There are multiple ways to calculate bandwidth (h), for Kernel density estimation. The most two popular methods are given below.
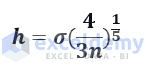
Scott’s Rule: This method is used for normal distribution. The formula to calculate the bandwidth is Scott’s rule is:
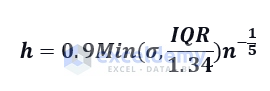
Silverman’s Rule: This method can be used for all kinds of distribution processes. It is more robust but does not work for complicated cases. The formula of bandwidth in Silverman’s Rule is:
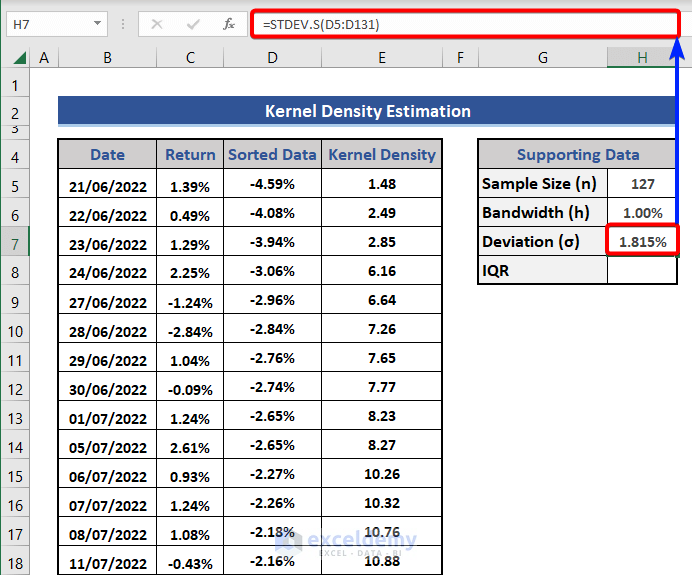
i. Calculate Standard Deviation for Scott’s Rule
- We get the standard deviation and will use this to calculate the bandwidth.
- Apply the following formula on formula bandwidth (h).
=STDEV.S(D5:D131)
ii. Apply Scott’s Rule to Calculate Bandwidth
- Apply the following formula.
=$H$7*(4/(3*$H$5))^(1/5)
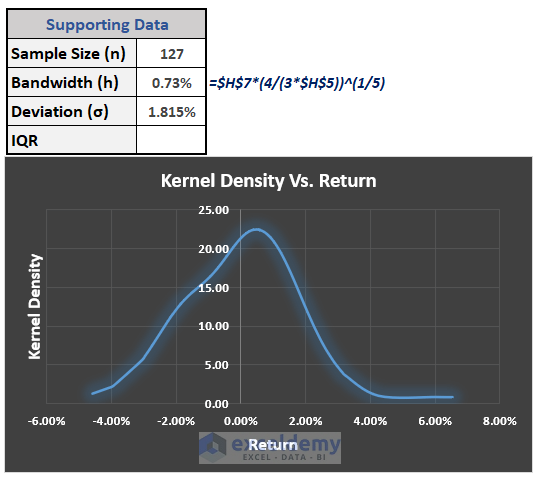
As the bandwidth changed, the graph also changed accordingly.
iii. Calculate IQR for Silverman’s Rule
The IQR stands for interquartile range. It is the measure of the middle fifty. We can mathematically present this as,
IQR = Q3-Q1
This is the difference between the 3rd and 1st quarters.
- Apply the following formula to cell H8.
=PERCENTILE.EXC(C5:C131,0.75)-PERCENTILE.EXC(C5:C131,0.25)
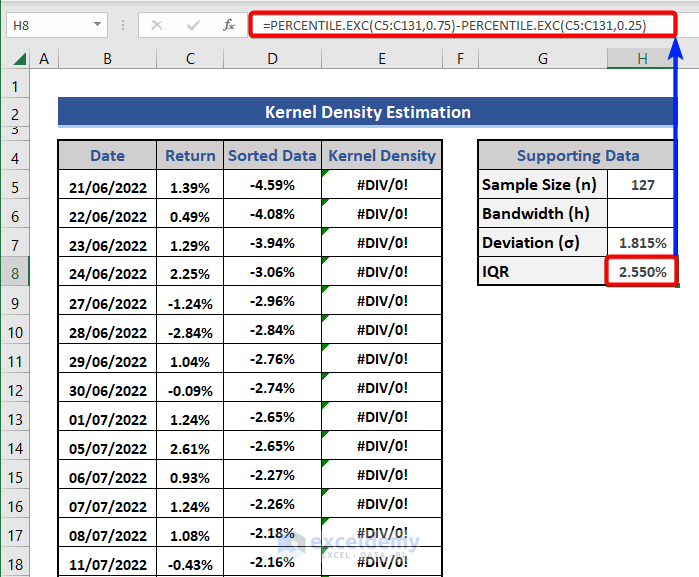
We will use this IQR to calculate bandwidth in Silverman’s Rule.
iv. Use Silverman’s Rule for Bandwidth
=0.9*MIN(H7,H8/1.34)*H5^(-1/5)
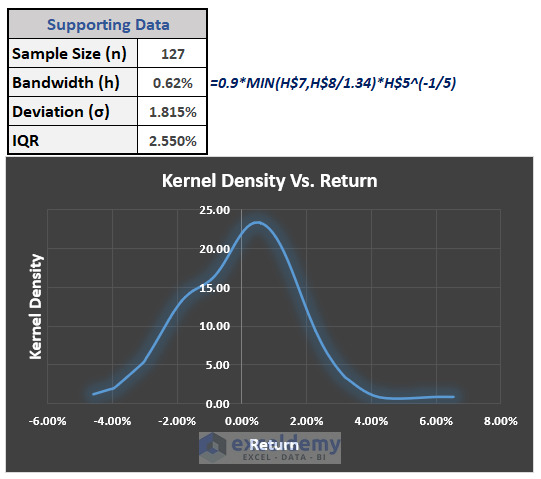
Based on this bandwidth, the kernel density and graph also change.
Download Practice Workbook
<< Go Back to Excel Statistics Templates | Excel Templates
Get FREE Advanced Excel Exercises with Solutions!
