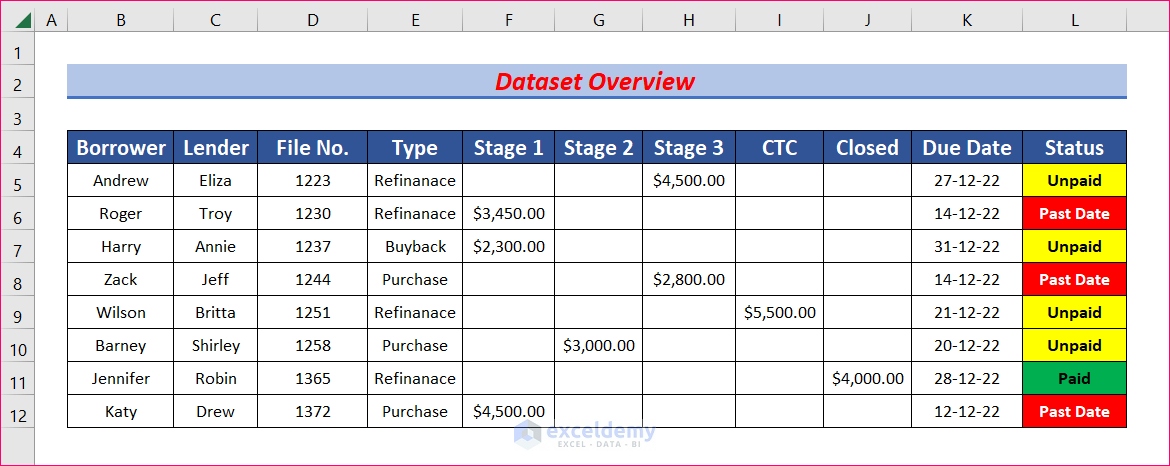
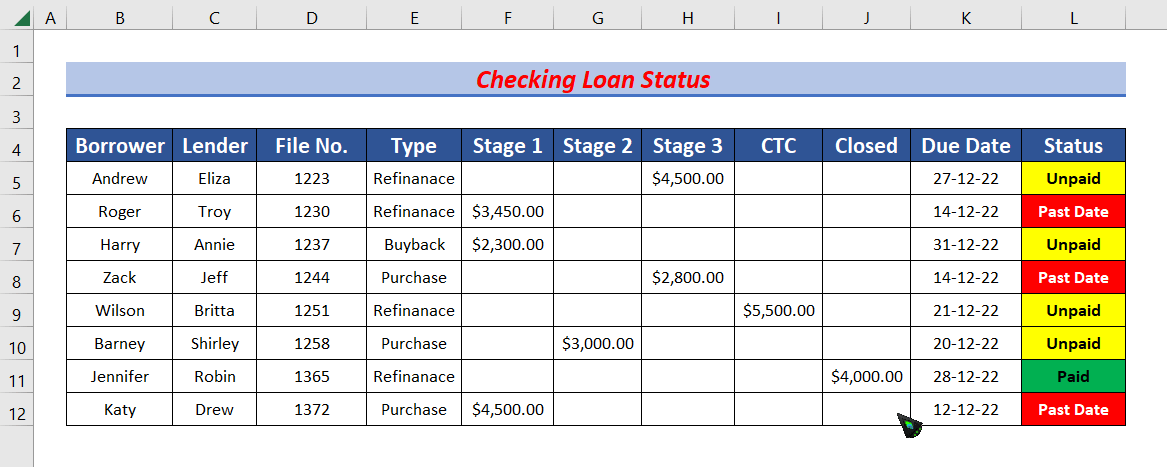
Here’s an overview of the dataset for today’s article.
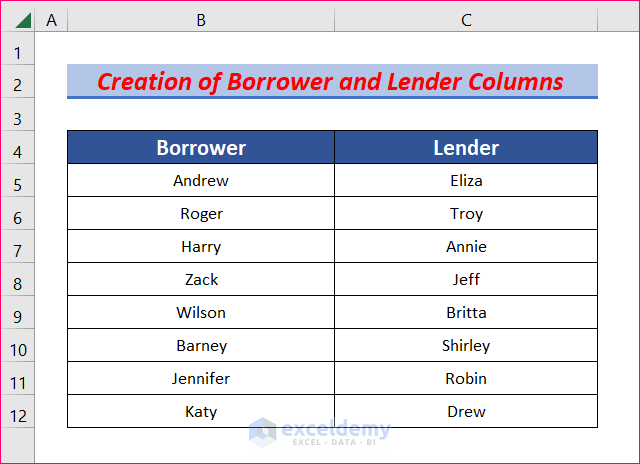
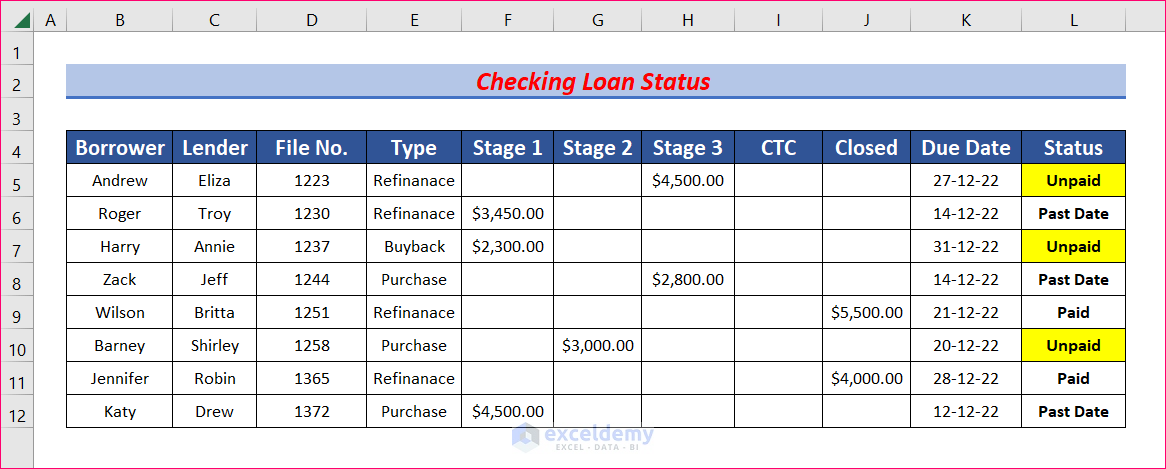
Step 1 – Create Borrower and Lender Columns
- Create two columns with Borrower and Lender as titles.
- Fill out the cells with the names of Borrowers and Lenders.
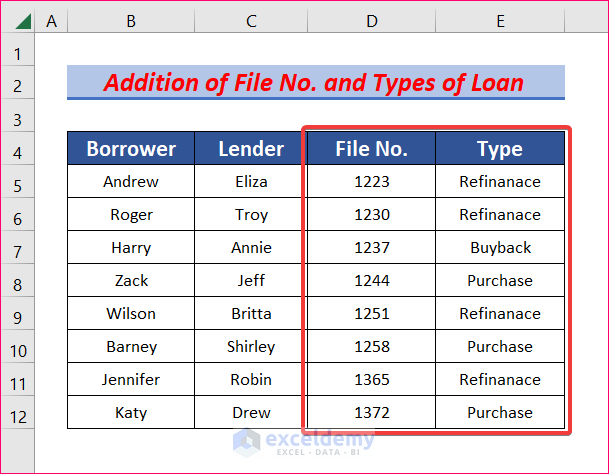
Step 2 – Add File Numbers and Types of Loans
- Add two columns.
- Name them File No. and Types of Loan.
- Type the file numbers and loan types in the cells.
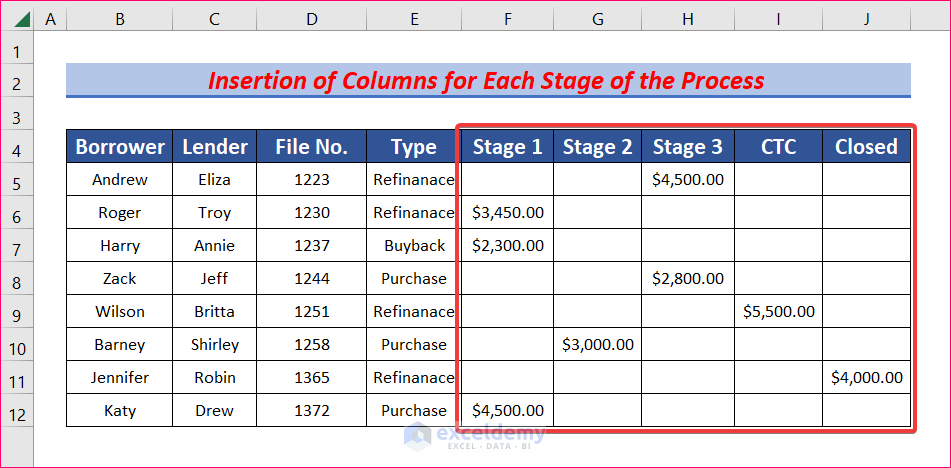
Step 3 – Insert Columns for Each Stage of the Process
- Insert columns for each of the stages such as prospect, disclosure sent, disclosure signed, etc.
- Add as many columns as you need and name them whatever you prefer.
- We added three columns named Stage 1, Stage 2, and Stage 3.
- We inserted two more columns CTC (Clear to Close) and Closed.
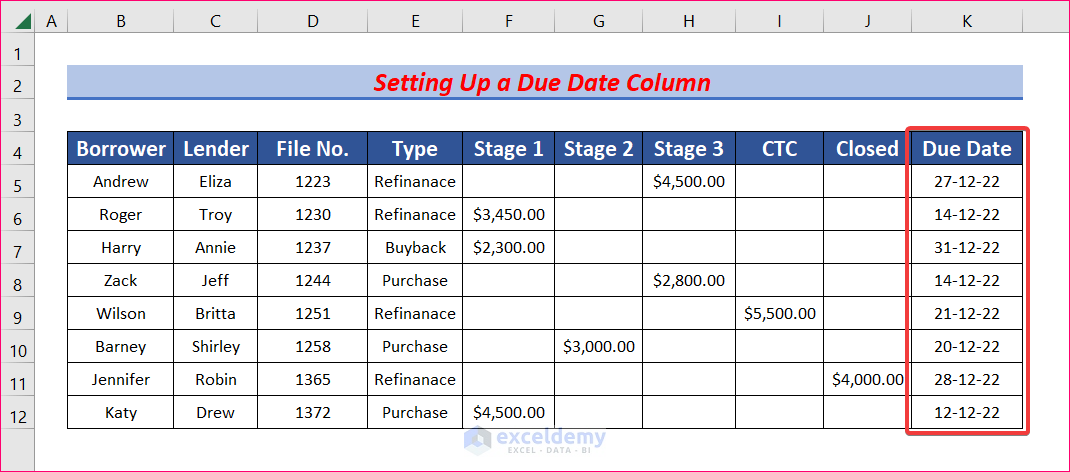
Step 4 – Set up a Due Date Column
- Insert a column and name it Due Date.
- Input the correct due date for each loan.
Step 5 – Check the Loan Status
- Select cell L5 and enter the following formula.
=IF(J5 <>"","Paid",IF(K5<TODAY(),"Past Date","Unpaid"))Formula Breakdown
- IF(K5<TODAY(),”Past Date”,”Unpaid”) will return “Past Date” if K5 is less than Today (15 december 2022) otherwise “Unpaid”.
- IF(J5 <>””,”Paid”,IF(K5<TODAY(),”Past Date”,”Unpaid”)) will look into cell J5 If the cell is not empty, it will return “Paid” otherwise “Unpaid”.
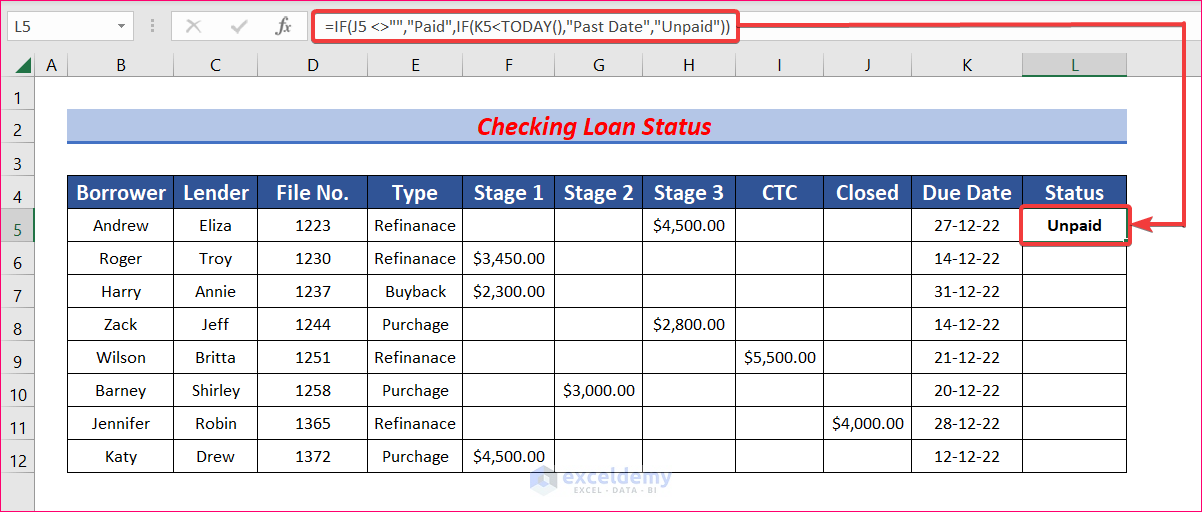
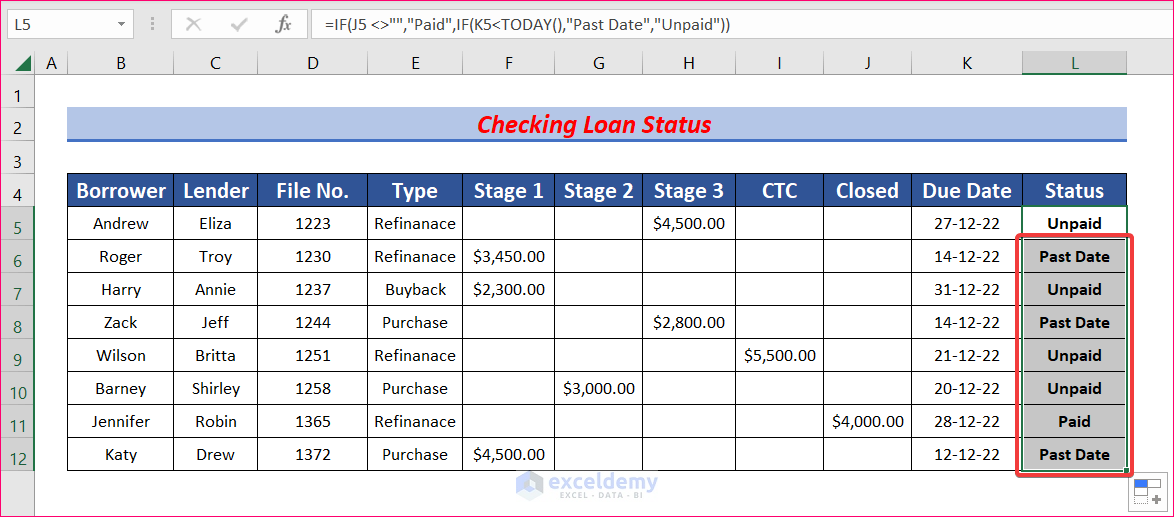
- Autofill the formula to the rest of the cell to obtain the status of all loans.
- You can use Conditional Formatting to change the color and font of text and cells to make it more appealing. For the “Unpaid” status we want to color the cell yellow.
- Select cells from L5 to L12. From your Home tab, go to Conditional Formatting, then choose Highlight Cells Rules and select Text that Contains.
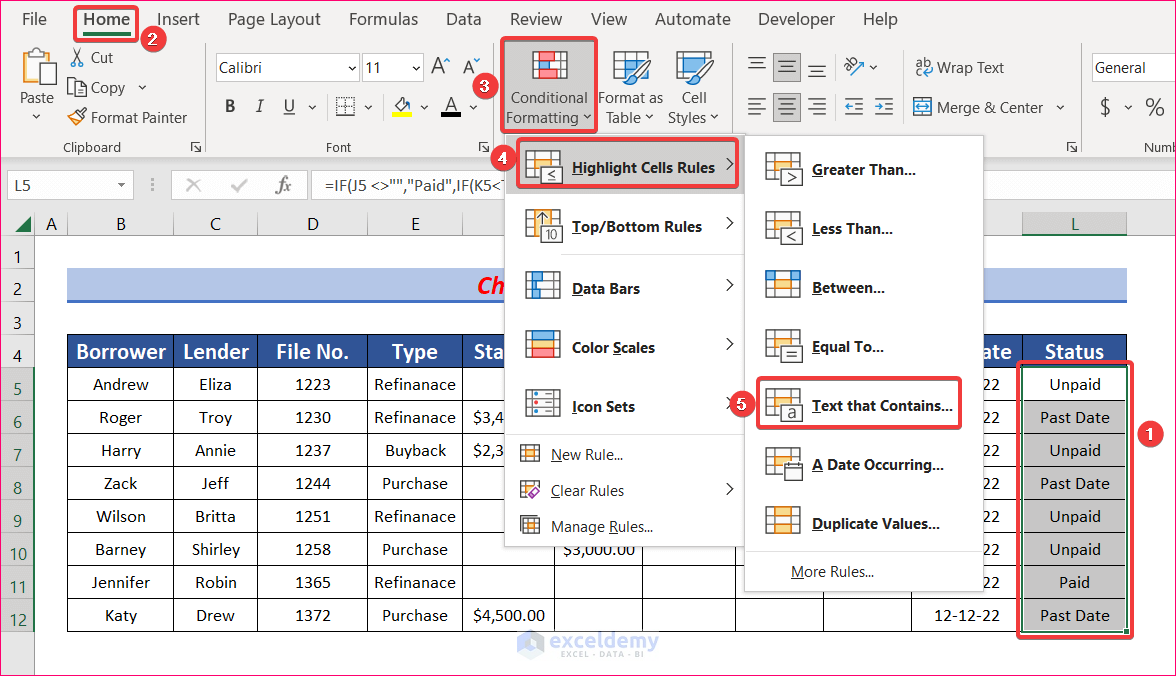
- A Text That Conations pop-up box will appear. Type “Unpaid” in the Format cells that contain the text: box and choose the color you prefer.
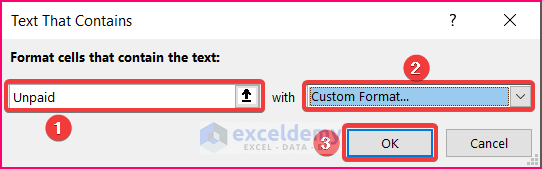
- We chose the yellow color in this example.
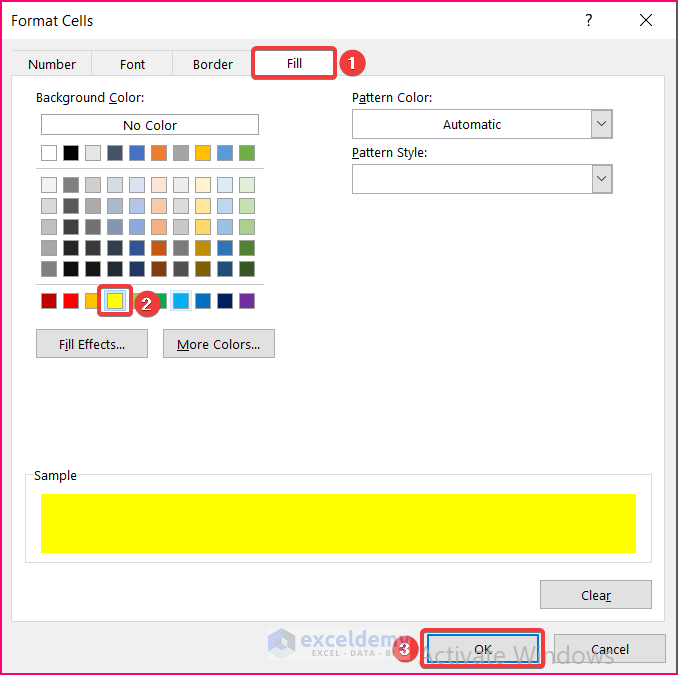
- All cells that contain the “Unpaid” status will become yellow.
- Follow the same procedure to format the cells with other statuses.
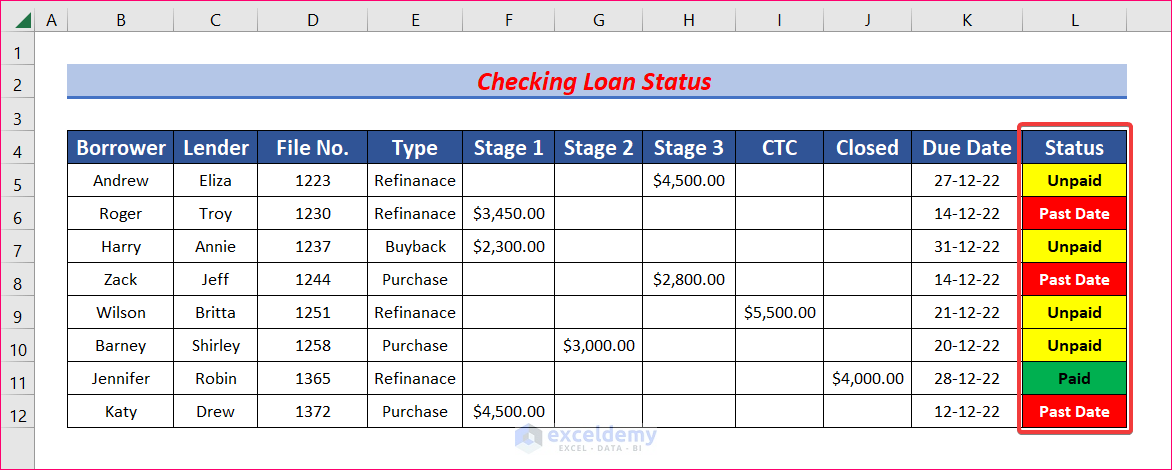
- You can change any data, and the status will automatically get updated.
Notes:
- You can add more columns and name them according to your needs.
- You can keep track of the total loans of each stage.
Download the Practice Workbook
Related Articles
- Dividend Reinvestment Calculator with Monthly Contributions in Excel
- How to Create Fibonacci Calculator in Excel
- How to Create a Fibonacci Pivot Point Calculator in Excel
<< Go Back to Finance Template | Excel Templates
Get FREE Advanced Excel Exercises with Solutions!
