Introduction to Fibonacci Pivot Point Calculator
A Fibonacci Pivot Point Calculator is a tool used in technical analysis by traders to identify potential levels of support and resistance. This calculator is based on the Fibonacci Sequence, a series of numbers often used in financial analysis.
To use a Fibonacci Pivot Point Calculator, a trader would first need to enter the high, low, and closing prices for the asset they are analyzing. These prices are then used to calculate a series of pivot points, which can be used to identify potential levels of support and resistance.
Formulas to Calculate Fibonacci Pivot Point
In order to create a Fibonacci Pivot Point Calculator, we’ll use the following formulas. We’ll consider the High, Low, and Close prices of the asset to calculate the Pivot Point, Resistance, and Support values.
- Pivot Point = (High + Low + Close) / 3
- Resistance 1 = Pivot Point + ((High – Low) x 0.382)
- Resistance 2 = Pivot Point + ((High – Low) x 0.6182)
- Resistance 3 = Pivot Point + ((High – Low) x 1.000)
- Support 1 = Pivot Point – ((High – Low) x 0.382)
- Support 2 = Pivot Point – ((High – Low) x 0.6182)
- Support 3 = Pivot Point – ((High – Low) x 1.000)
How to Create a Fibonacci Pivot Point Calculator in Excel: Step-by-Step Procedures
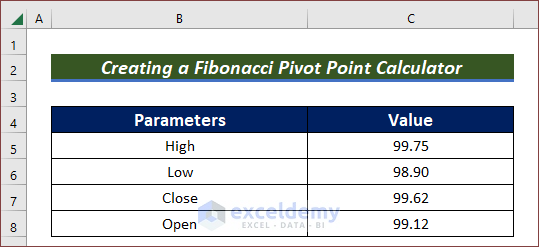
Step 1 – Collect Required Data
- Create a table like the one in the image below and enter the High, Low, Close, and Open Values of a particular asset, here in cells C5 to C8.
Step 2 – Create Fibonacci Pivot Point Calculator
- To calculate the Pivot Point, enter the following formula in cell C9 and press ENTER:
=(C5+C6+C7)/3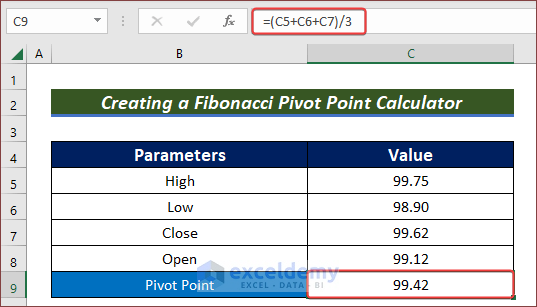
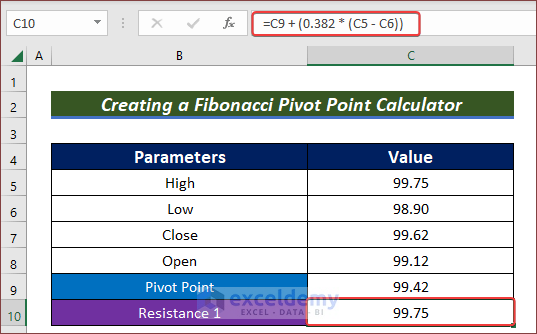
- For the first Resistance calculation, enter the following formula in cell C10 and press ENTER:
=C9 + (0.382 * (C5 - C6))- Here, C9 is the Pivot Point, C5 is the High value, and C6 is the Low value of a particular asset.
- For the second Resistance value, enter the following formula in cell C11 and press ENTER:
=C9 + (0.6182 * (C5 - C6))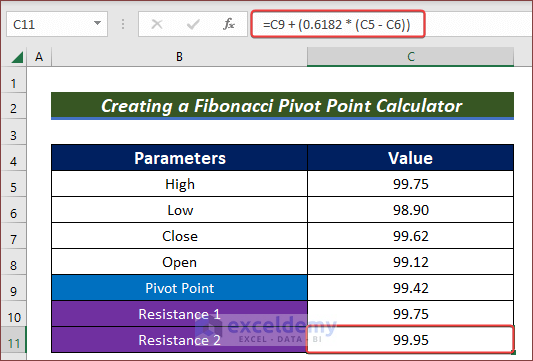
- The formula for the third Resistance value goes in cell C12:
=C9 + (1 * (C5 - C6))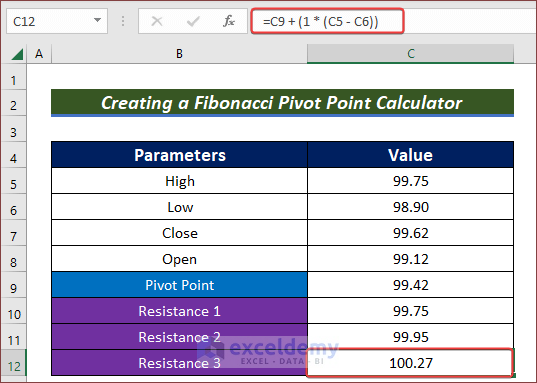
Now we calculate the Support values.
- For the calculation of Support number 1, enter the following formula in cell C13 and press ENTER:
=C9 - (0.382 * (C5 - C6))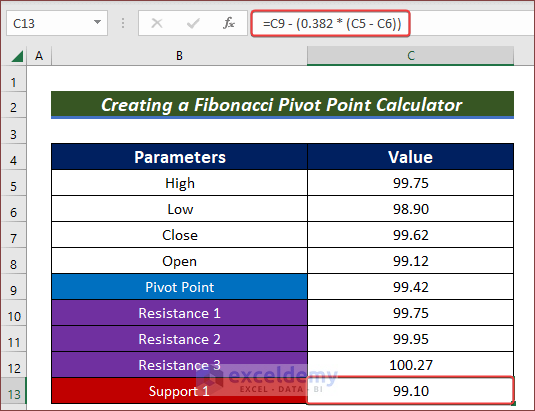
- For Support 2 in cell C14:
=C9 - (0.6182 * (C5 - C6))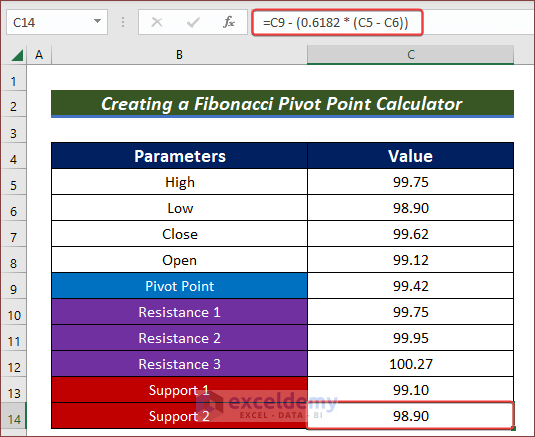
- And for Support 3 in cell C15:
=C9 - (1 * (C5 - C6))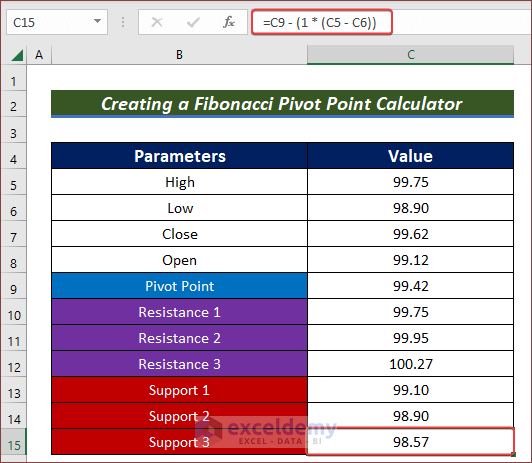
Our simple Fibonacci Pivot Point Calculator is complete.
Download Practice Workbook
Related Articles
- Dividend Reinvestment Calculator with Monthly Contributions in Excel
- How to Create Mortgage Loan Pipeline Management in Excel
- How to Create Fibonacci Calculator in Excel
<< Go Back to Finance Template | Excel Templates
Get FREE Advanced Excel Exercises with Solutions!
