
Excel isn’t just for data analysis or calculations; with the right setup, you can use it as a lightweight project management tool. It may not be the first option that comes to mind, but for many small- and medium-sized projects it’s surprisingly effective. With a bit of structure and formatting, you can turn a spreadsheet into a simple project management system.
This tutorial shows how to use Excel as a lightweight project management tool with Gantt-like views.
Step 1: Build the Project Task Table
First, create a task table. Enter columns for Task Name, Start Date, End Date, Duration, and Phase.
Duration Calculation:
- Use this formula to calculate Duration automatically (inclusive)
=D2 - C2 + 1
- Use the following formula to calculate duration excluding weekends
=NETWORKDAYS(C2, D2)
This calculates working days between start and end dates, excluding weekends.
Data Validation:
- Use data validation for the Phase column
- Go to the Data tab >> select Data Validation
- Select List
- In Source: type Planning, Design, Review, Launch
- Click OK

Based on your project requirements, you can insert additional columns to track progress or ownership.
Step 2: Create a Project Management Tool with Gantt-Like Views
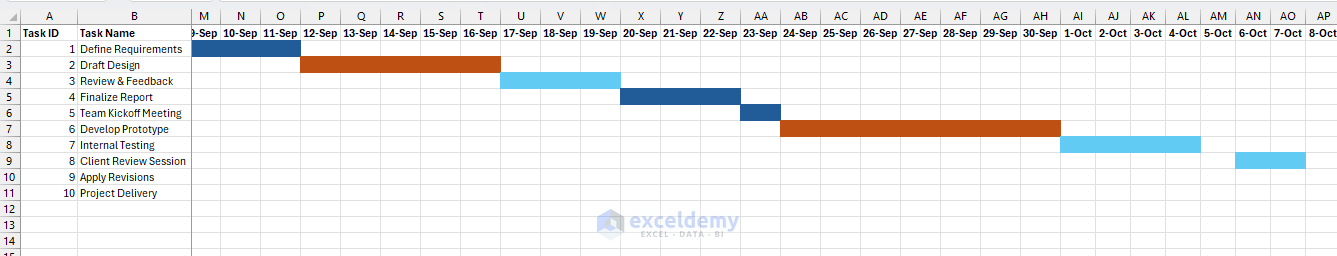
Method 1: Gantt-Like View with Conditional Formatting
This method highlights cells in a timeline grid to show task durations.
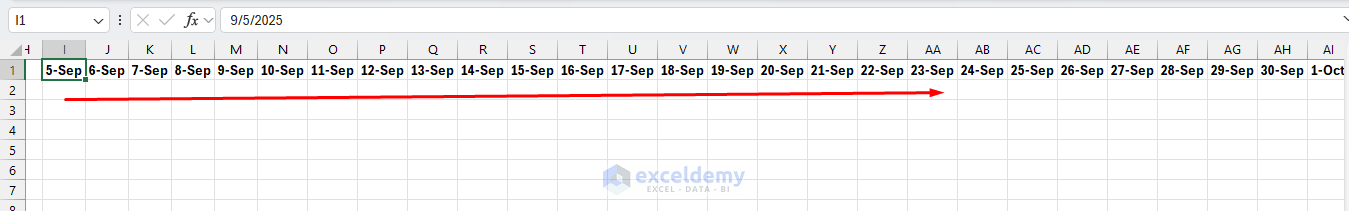
Create a Timeline Header:
- In the row above your table, list project dates horizontally
- Insert 09/05/2025 in cell I1
- Format the date as 5-Sep
- Drag the cells until you reach the last end date, which is 10/16/2025
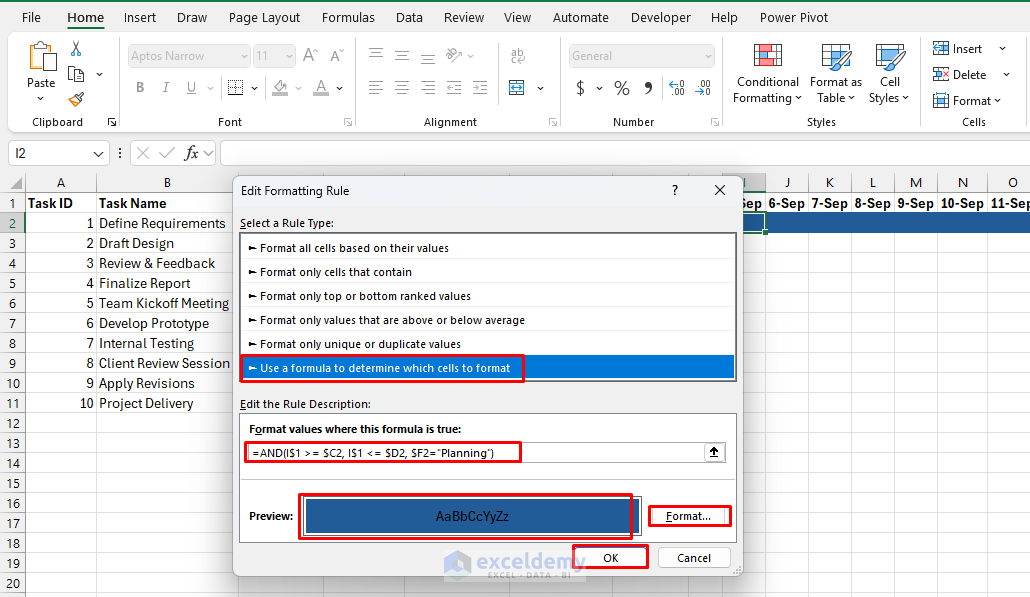
Apply Conditional Formatting:
- Select the grid under the timeline (e.g. I2:AX11)
- Go to the Home tab >> select Conditional Formatting >> select New Rule
- Choose Use a formula to determine which cells to format
Rule 1: Planning (Blue)
=AND(I$1 >= $C2, I$1 <= $D2, $F2="Planning")
- Click Format >> select Blue fill color
Rule 2: Design (Peach)
=AND(I$1 >= $C2, I$1 <= $D2, $F2="Design")
- Click Format >> select Peach fill color
Rule 3: Review (Light Blue)
=AND(I$1 >= $C2, I$1 <= $D2, $F2="Review")
- Click Format >> select Light Blue fill color
Rule 4: Launch (Green)
=AND(I$1 >= $C2, I$1 <= $D2, $F2="Launch")
- Click Format >> select Green fill color
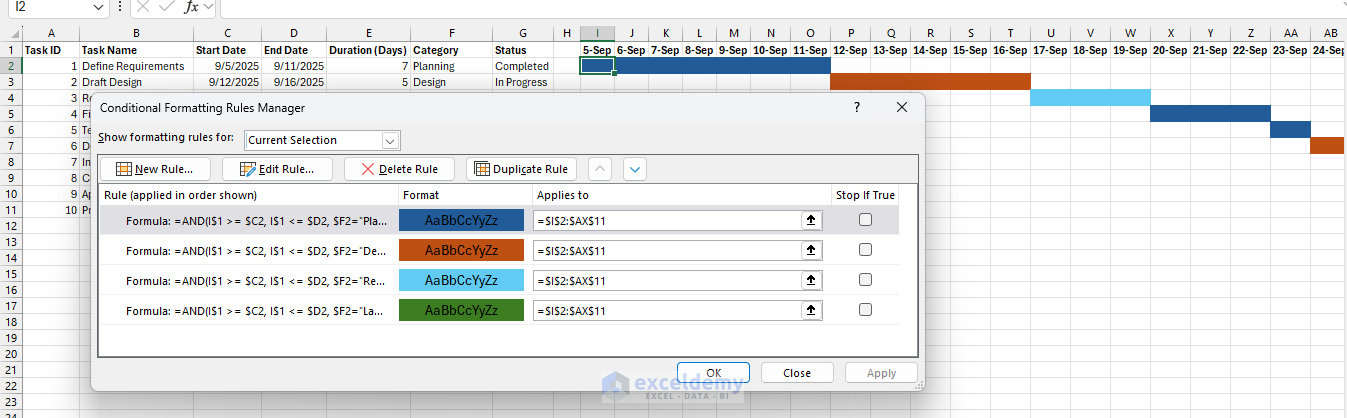
- Each task will display a horizontal colored bar spanning its duration across the timeline
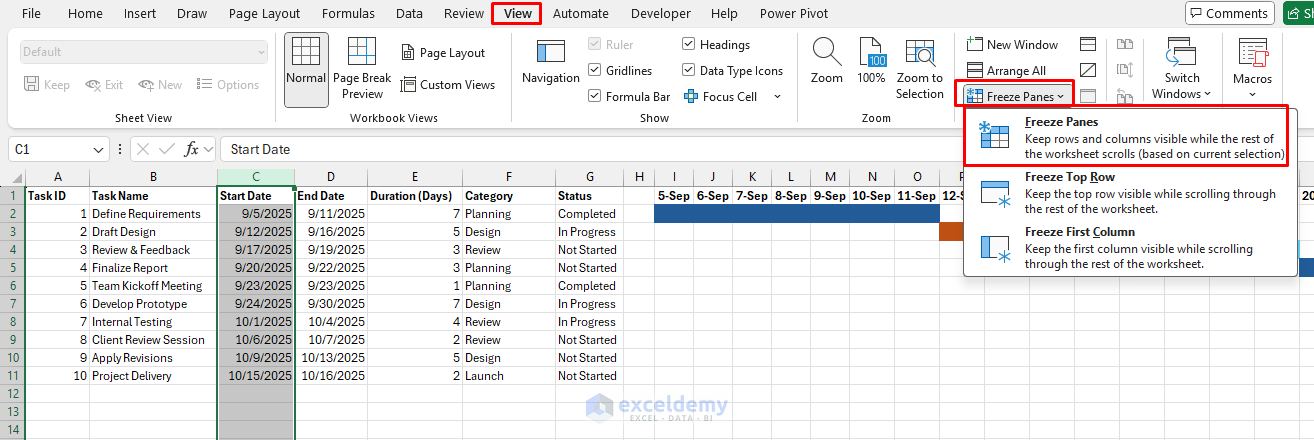
Enhance the Timeline:
- Freeze Panes: Keep task names visible while scrolling the timeline
- Go to the View tab >> select Freeze Panes >> select Freeze Panes
- Add Milestones: Insert special symbols (like ◆) on specific dates
- Use Week/Month Headers: Instead of daily dates, label by week numbers or months for longer projects
Method 2: Gantt-Like View with a Stacked Bar Chart
This approach is more presentation-ready and uses Excel’s charting tools. You’ll just need the Task Name, Start Date, and Duration (in days).
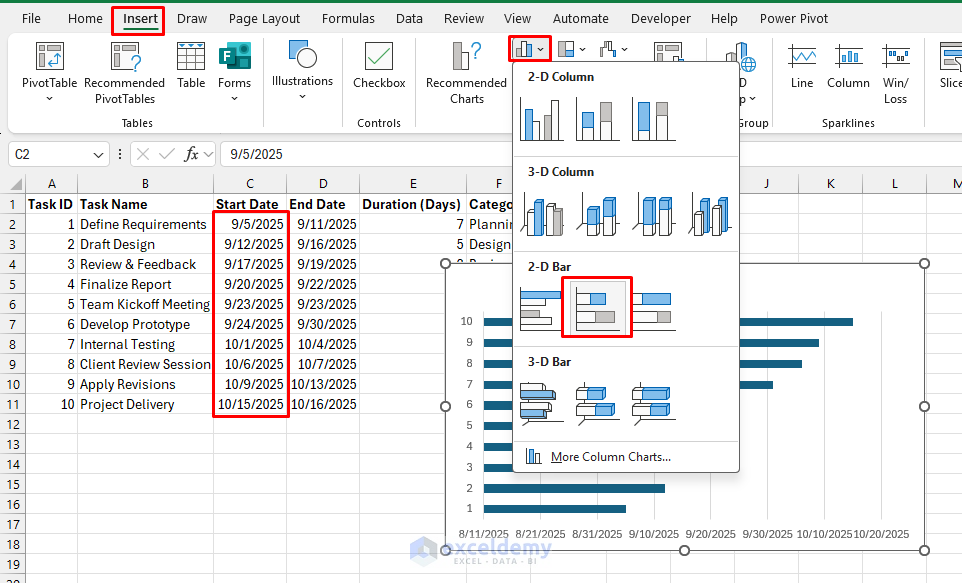
Insert a Stacked Bar Chart:
- You don’t need to preselect any data
- Go to the Insert tab >> select Bar Chart >> select Stacked Bar
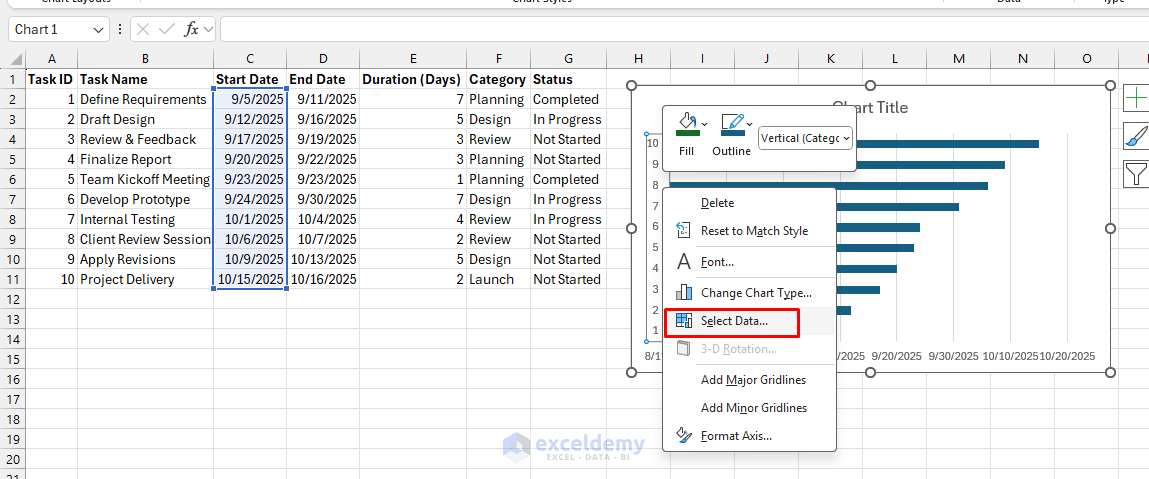
Adjust the Chart:
- Right-click >> click Select Data
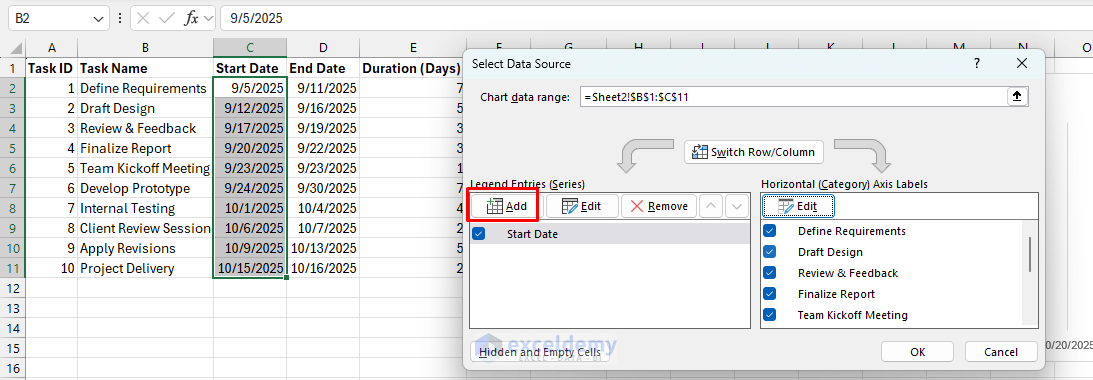
- In the Legend Entries (Series) section:
- Ensure Start Date is one series
- Add Duration as another series
- Click Add to select the Duration range
- Select Series name: E1
- Select Series values: E2:E11
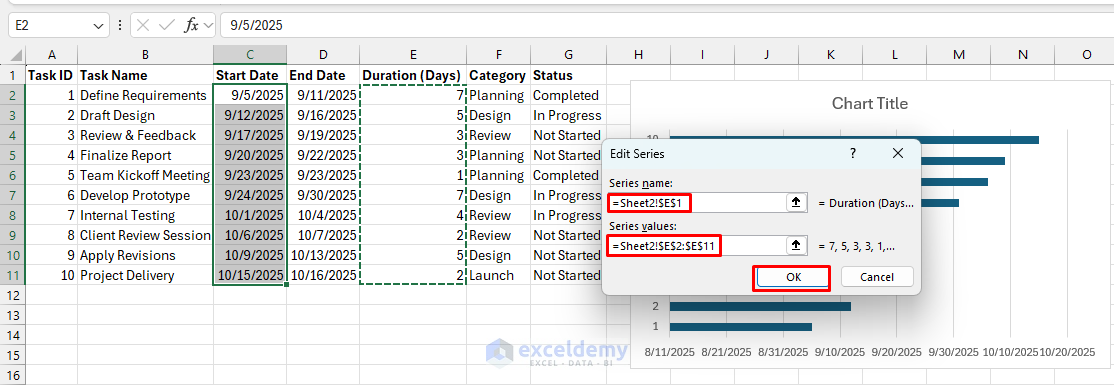
- In the Horizontal (Category) Axis Labels,
- Click Edit >> choose the Task Names column
- Click OK

- Make sure Start Date and Duration are both included as series
- You will get the initial chart

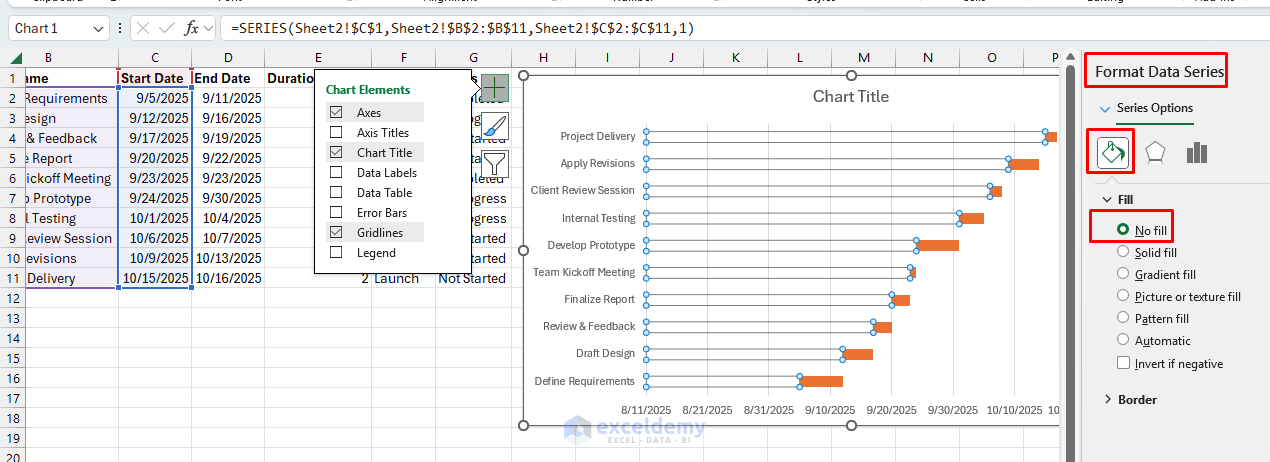
Format the Chart to Look Like a Gantt:
- Right-click the Start Date series >> select Format Data Series
- Click Fill >> select No Fill
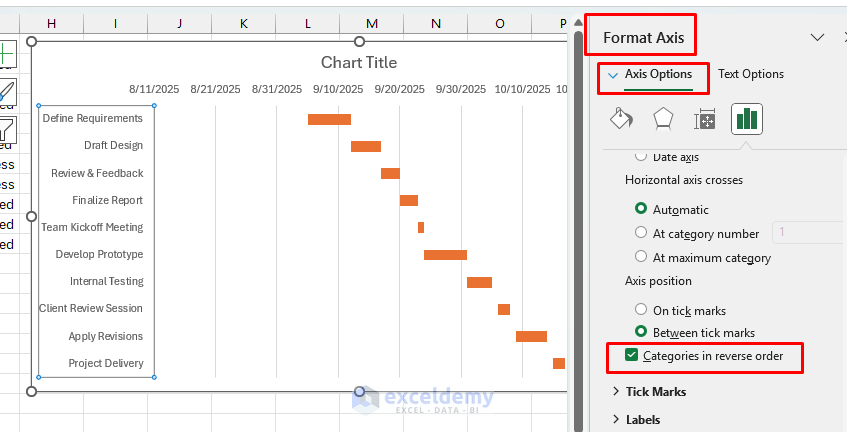
- Reverse task order (so the first task appears at the top)
- Right-click the vertical axis >> select Format Axis >> check Categories in reverse order
- Now your tasks flow top-to-bottom like a true Gantt chart
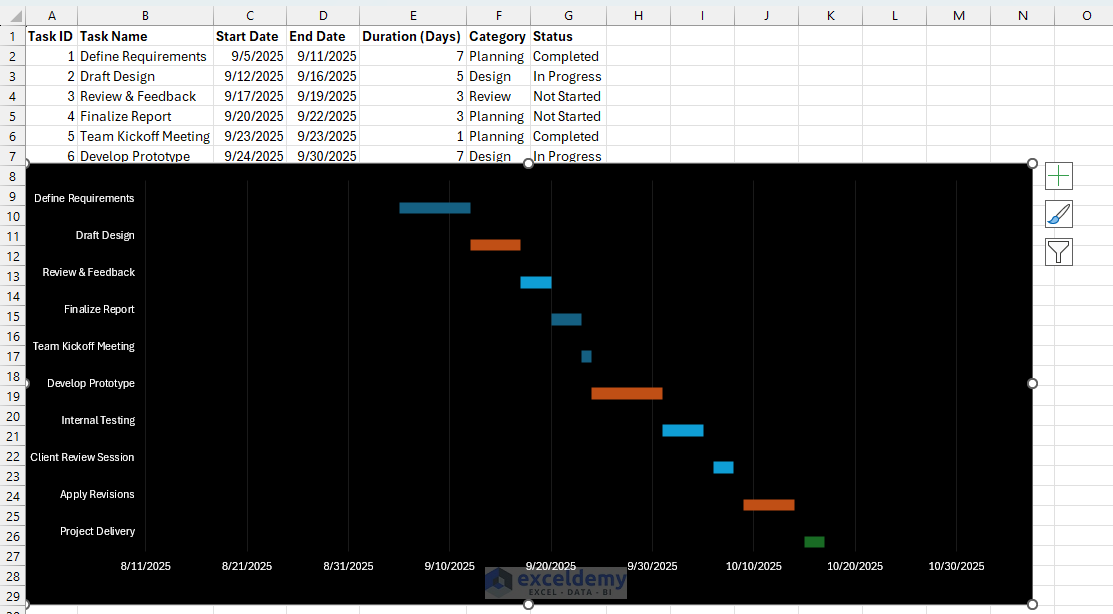
Customize:
- Select the Chart >> use a solid fill
- Change bar colors based on category
- Add gridlines or weekly markers for clarity
Step 3: Choosing the Right Method
- Conditional Formatting Gantt:
- Best for quick tracking inside Excel
- Flexible for editing and progress updates
- Good for personal or small team projects
- Stacked Bar Gantt:
- More professional-looking
- Great for presentations or reports
- Easier to customize visually (colors, milestones, progress bars)
Conclusion
By following the above methods, you can create a lightweight project management tool with a Gantt-like view. It can manage tasks, visualize timelines, and keep projects on track, all without leaving the Excel environment. Excel is best as a lightweight solution when:
- You’re managing small to mid-sized projects
- You don’t need real-time collaboration
- Your team is already comfortable with spreadsheets
For large projects with dependencies, resource allocation, or multiple teams, dedicated project management software (e.g. Microsoft Project, Asana, or Trello) may be more appropriate.
Get FREE Advanced Excel Exercises with Solutions!
