Method 1 – Manual Periodic Table
1.1. Insert Data in Properties Table
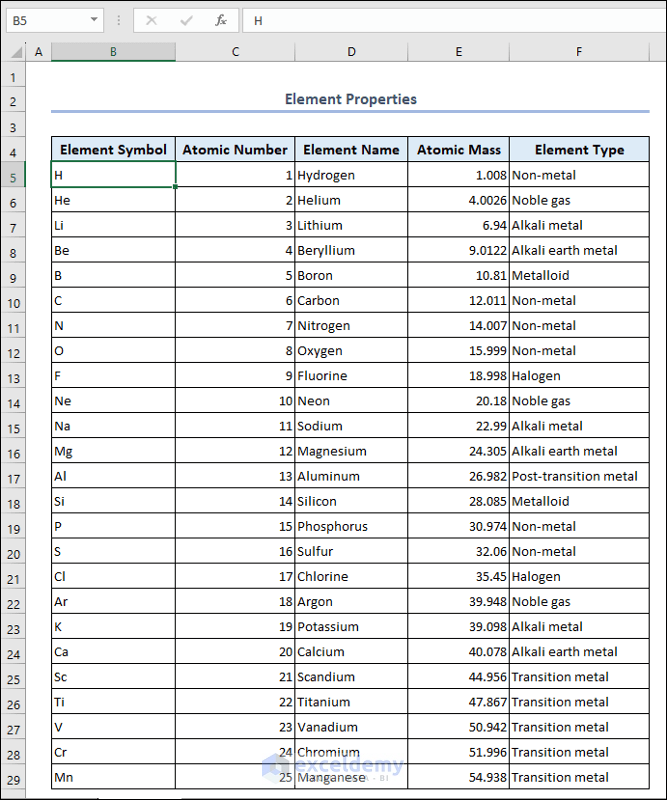
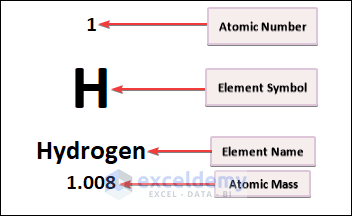
Each element of a periodic table has a unique set of properties. These properties refer to various characteristics, trends, and relationships shown by the elements of the periodic table. The key properties are as follows.
Symbol: Each element has its own symbol, a one—or two-letter abbreviation used to represent the chemical element.
Atomic Number: Atomic number refers to the number of protons in an element. This is a unique property of any element.
Atomic Mass: Atomic mass refers to the weight or mass of an atom of a specific element. It includes the mass of the protons, neutrons, and electrons in the atom. We measure it in Atomic Mass Unit (amu).
Element Type: Element type refers to classifying elements into different categories based on their properties and characteristics. These categories help to understand the general behavior of other elements.
We collected the properties of 118 elements in a tabular form. This property table is essential to create a periodic table.
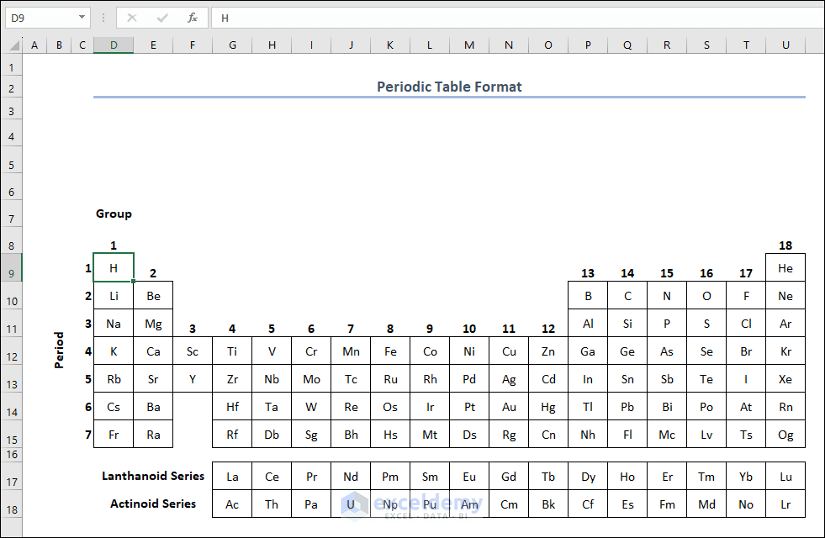
1.2. Create Periodic Table Format
- The columns with the group numbers from 1–18.
- The rows with the period numbers from 1–7.
- Enter the symbol of each element in appropriate cells depending on their group number and period number.
- You should adjust the formatting of the table as needed. You can adjust the row height and column width. You may change the font size, colors, and cell borders to make the table more visually appealing and easier to understand.
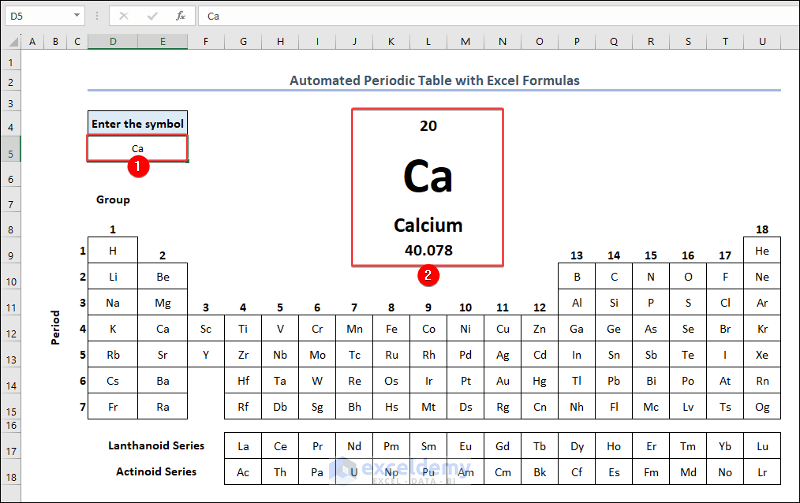
1.3. Automate Periodic Table with Excel Formulas
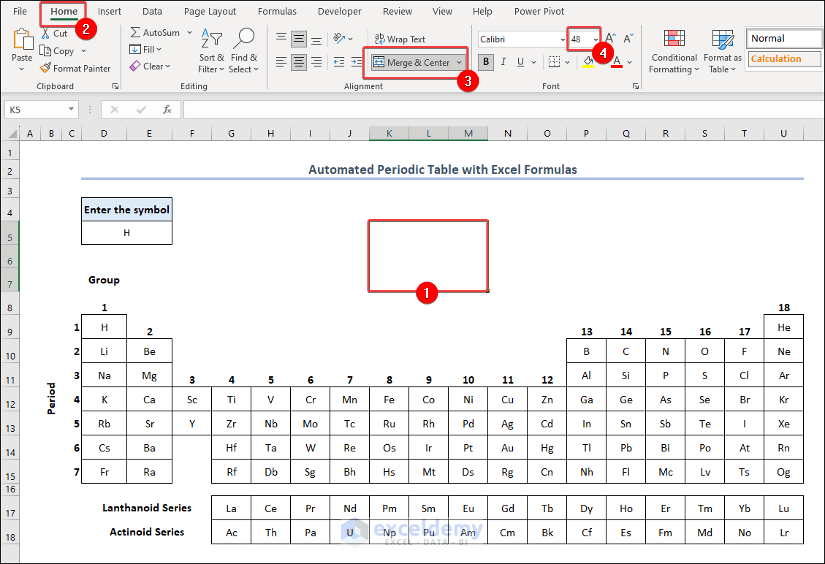
- Put any element name in cell D5.
- Merge & Center to range D5:E5.
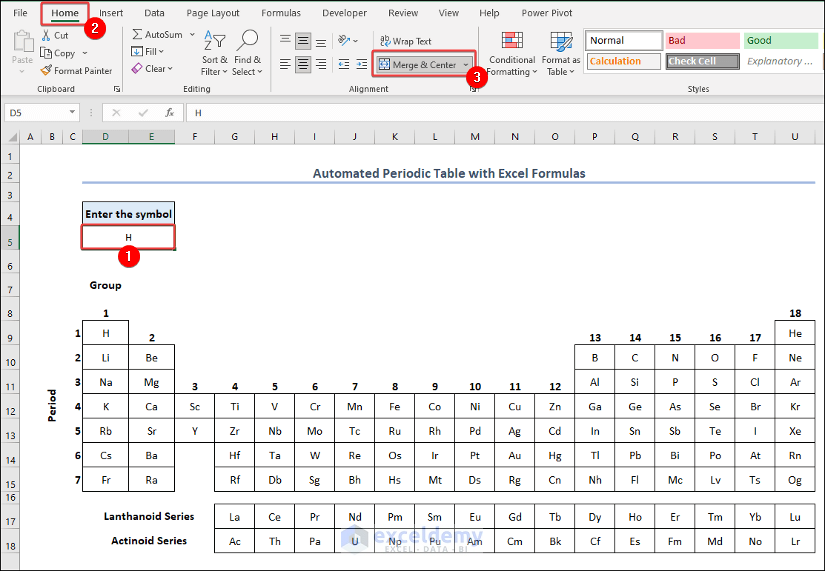
- Merge & Center to range K4:M4, put font size 16.
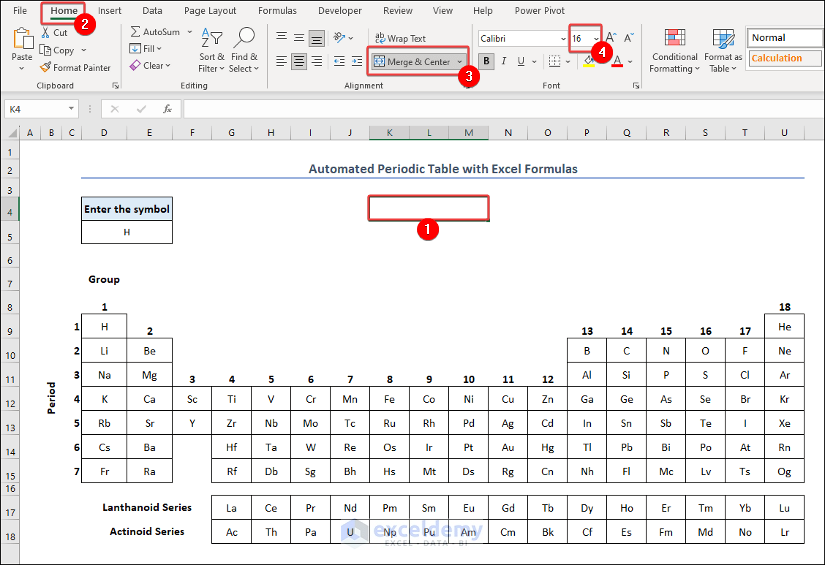
- Merge & Center to range K5:M7, put font size 48.
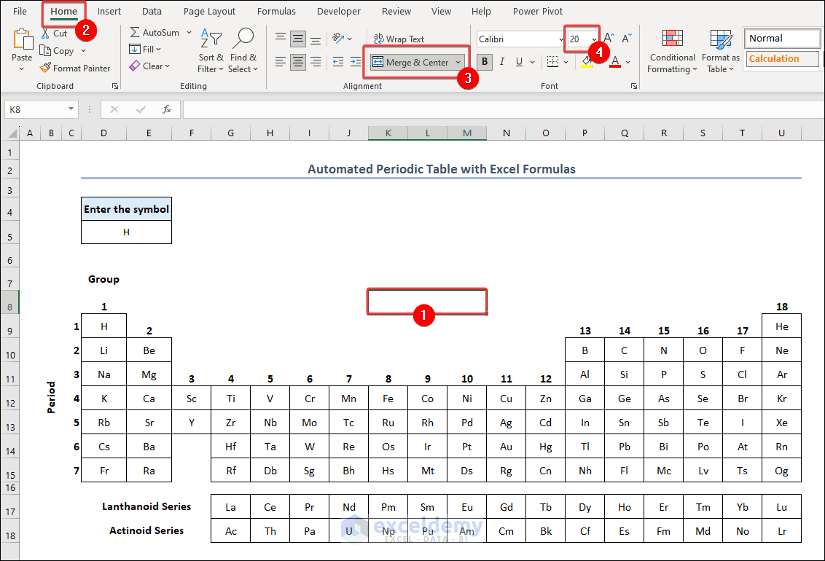
- Merge & Center to range K8:M8, put font size 20.
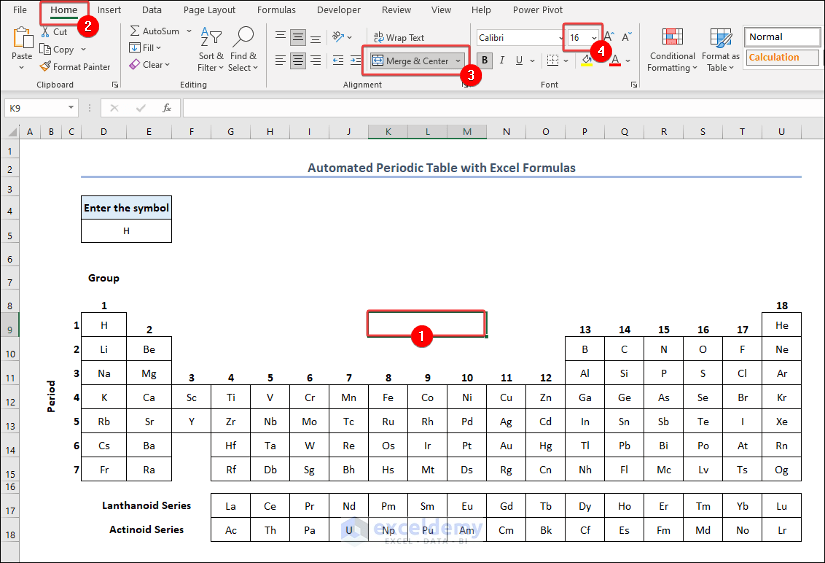
- Merge & Center to range K9:M9, put font size 16.
- Formula in cell K4:
=IFERROR(VLOOKUP($D$5, Properties!$B$5:$F$123,2,FALSE), "")- Formula in cell K5:
=IFERROR(VLOOKUP($D$5, Properties!$B$5:$F$123,1,FALSE), "")- Formula in cell K8:
=IFERROR(VLOOKUP($D$5, Properties!$B$5:$F$123,3,FALSE), "")- Formula in cell K9:
=IFERROR(VLOOKUP($D$5, Properties!$B$5:$F$123,4,FALSE), "")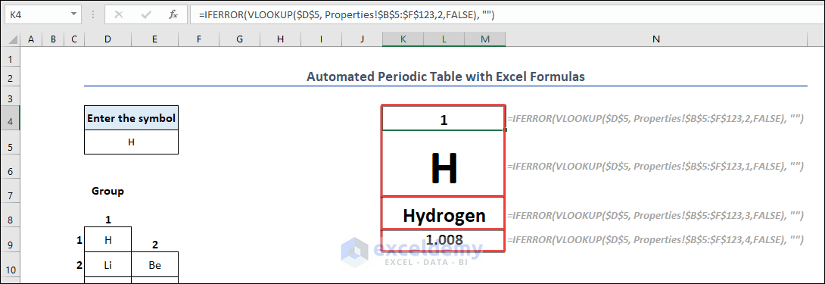
Formula Breakdown
- VLOOKUP($D$5, Properties!$B$5:$F$123,2,FALSE)
The VLOOKUP function looks for the value of cell D5 in range B5:F123 from the Properties worksheet. If the value matches, it returns a value from the second column (2) of the specified range. False denotes the exact match.
Result: 1
- IFERROR(VLOOKUP($D$5, Properties!$B$5:$F$123,2,FALSE), “”)
The IFERROR function returns the value of the VLOOKUP function. If there is an error, it returns an empty string.
Result: 1
- You will see the Atomic Number in cell K4, Element Symbol in cell K5, Element Name in cell K8, and Atomic Mass in cell K9.
- Change the element symbol in cell D5, you will see the properties of that element in range K4:K9.
Method 2 – Interactive Periodic Table
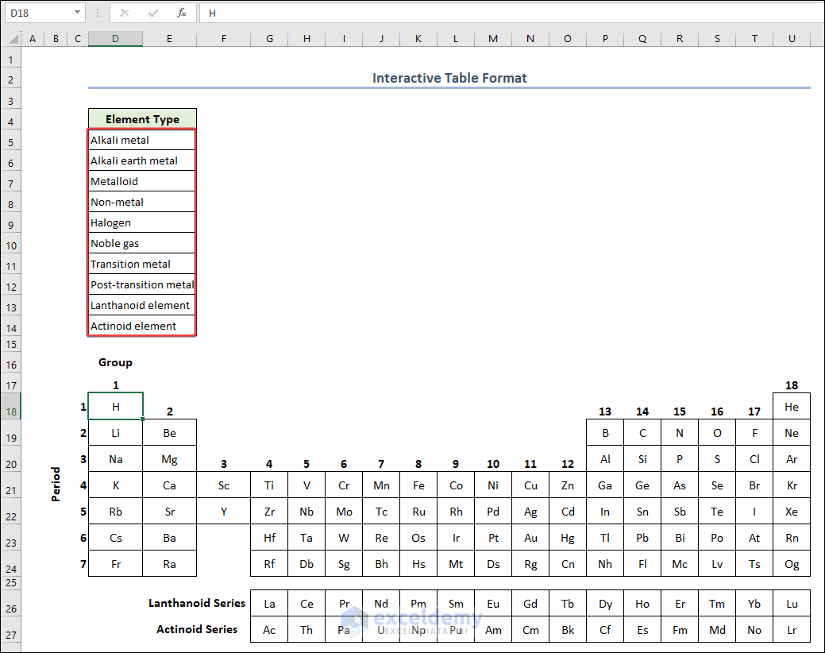
2.1. Create Interactive Table Format
- Create a periodic table format just like the previous method.
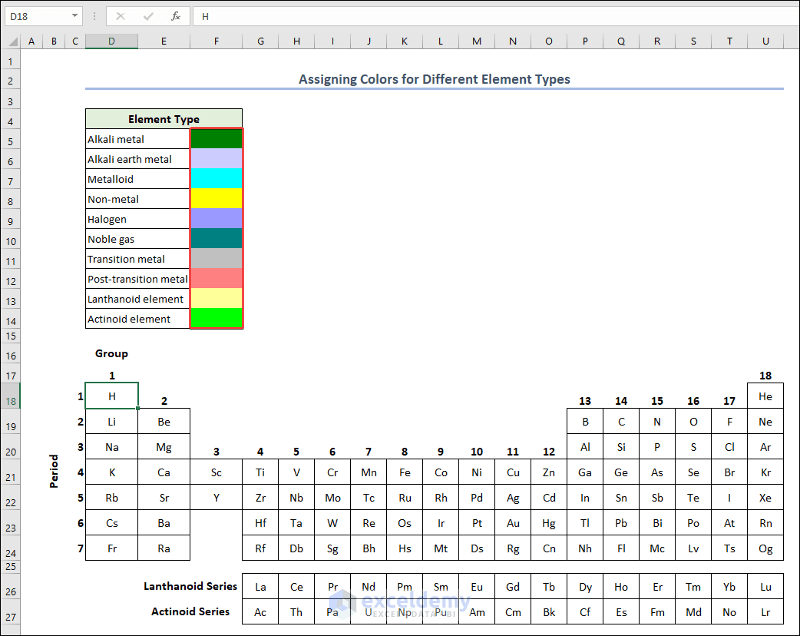
- The property table of the Properties worksheet records a total of 10 types of elements. Add the element types in range D5:D14.
2.2. Assign Colors for Different Element Types
- Launch the VBA Macro Editor from your workbook. Follow this article: How to Write VBA Code in Excel.
- Paste the following code in your VBA Macro Editor.
- Press the Run button or F5 key to run the code.
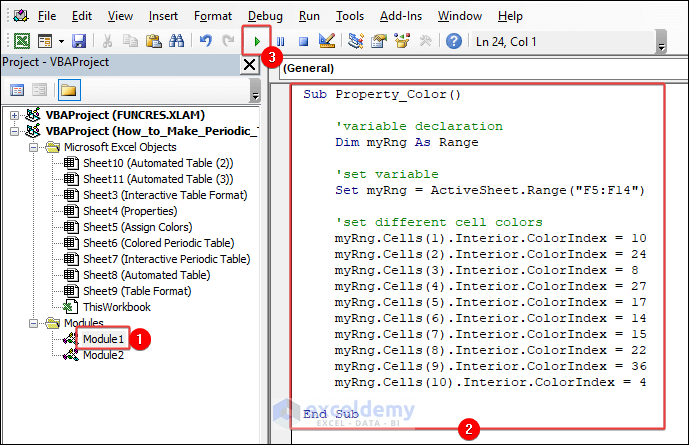
Sub Property_Color()
    'variable declaration
    Dim myRng As Range
    'set variable
    Set myRng = ActiveSheet.Range("F5:F14")
    'set different cell colors
    myRng.Cells(1).Interior.ColorIndex = 10
    myRng.Cells(2).Interior.ColorIndex = 24
    myRng.Cells(3).Interior.ColorIndex = 8
    myRng.Cells(4).Interior.ColorIndex = 27
    myRng.Cells(5).Interior.ColorIndex = 17
    myRng.Cells(6).Interior.ColorIndex = 14
    myRng.Cells(7).Interior.ColorIndex = 15
    myRng.Cells(8).Interior.ColorIndex = 22
    myRng.Cells(9).Interior.ColorIndex = 36
    myRng.Cells(10).Interior.ColorIndex = 4
End Sub- You will see different colors assigned for various types of elements in range F5:F14.
VBA Breakdown
myRng.Cells(1).Interior.ColorIndex = 10
    myRng.Cells(2).Interior.ColorIndex = 24
    myRng.Cells(3).Interior.ColorIndex = 8
    myRng.Cells(4).Interior.ColorIndex = 27
    myRng.Cells(5).Interior.ColorIndex = 17
    myRng.Cells(6).Interior.ColorIndex = 14
    myRng.Cells(7).Interior.ColorIndex = 15
    myRng.Cells(8).Interior.ColorIndex = 22
    myRng.Cells(9).Interior.ColorIndex = 36
    myRng.Cells(10).Interior.ColorIndex = 4
This portion of code takes each cell of the myRng range and assigns different colors to each cell in the specified range.
2.3. Assign Colors to Periodic Table Based on Element Type
- Paste the following code into a new module.
- Press the Run button or F5 key to run the code.
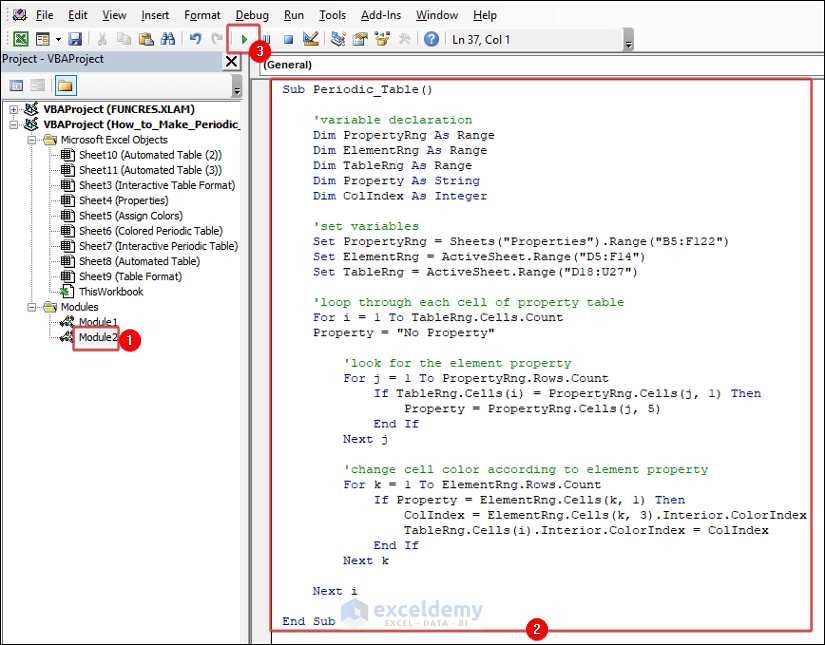
Sub Periodic_Table()
    'variable declaration
    Dim PropertyRng As Range
    Dim ElementRng As Range
    Dim TableRng As Range
    Dim Property As String
    Dim ColIndex As Integer
    'set variables
    Set PropertyRng = Sheets("Properties").Range("B5:F122")
    Set ElementRng = ActiveSheet.Range("D5:F14")
    Set TableRng = ActiveSheet.Range("D18:U27")
    'loop through each cell of property table
    For i = 1 To TableRng.Cells.Count
    Property = "No Property"
        'look for the element property
        For j = 1 To PropertyRng.Rows.Count
            If TableRng.Cells(i) = PropertyRng.Cells(j, 1) Then
                Property = PropertyRng.Cells(j, 5)
            End If
        Next j
        'change cell color according to element property
        For k = 1 To ElementRng.Rows.Count
            If Property = ElementRng.Cells(k, 1) Then
                ColIndex = ElementRng.Cells(k, 3).Interior.ColorIndex
                TableRng.Cells(i).Interior.ColorIndex = ColIndex
            End If
        Next k
    Next i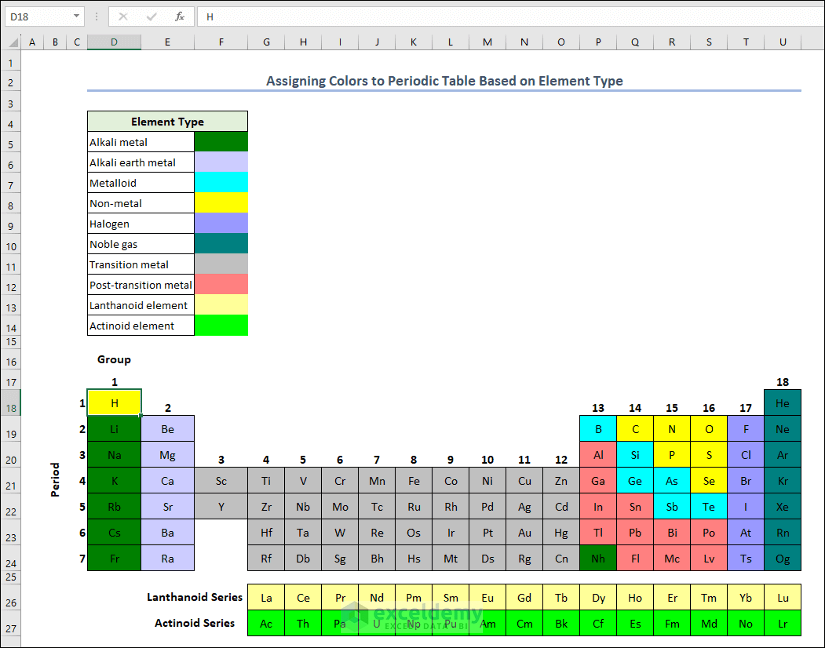
End Sub- You will see the periodic table elements getting colored according to the assigned color based on their element types.
VBA Breakdown
For i = 1 To TableRng.Cells.Count
    Property = "No Property"
        For j = 1 To PropertyRng.Rows.Count
            If TableRng.Cells(i) = PropertyRng.Cells(j, 1) Then
                Property = PropertyRng.Cells(j, 5)
            End If
Next j- In this portion of the code, two nested loops iterate through TableRng and PropertyRng ranges. For each loop in TableRng range, a variable named Property is initiated with a value No Property. The inner loop then checks if the value of the current cell in the TableRng range matches any value in the first column of the PropertyRng range. The Property variable is updated with the corresponding value from the fifth column of the PropertyRng range. The inner loop searches for matches, updating Property variable with the value of the last match found. Once the inner loop completes, the outer loop moves to the next cell in the TableRng range and repeats the process. So, the Property variable holds the property value associated with the last matching entry in the PropertyRng range for each cell in the TableRng range, or No Property if no matches were found.
For k = 1 To ElementRng.Rows.Count
            If Property = ElementRng.Cells(k, 1) Then
                ColIndex = ElementRng.Cells(k, 3).Interior.ColorIndex
                TableRng.Cells(i).Interior.ColorIndex = ColIndex
            End If
        Next k
Next i- In this portion of the VBA code, two nested loops match the property associated with each cell in the TableRng range with the element properties in the ElementRng range. If a match is found, the corresponding cell in the TableRng range is colored based on the color index (ColIndex) retrieved from the ElementRng range. This process keeps repeating for all cells in the TableRng range, resulting in colored cells based on their associated element properties.
2.4. Make Interactive Periodic Table
- Paste the following code in the worksheet module of Interactive Periodic Table worksheet.
- Save the code.
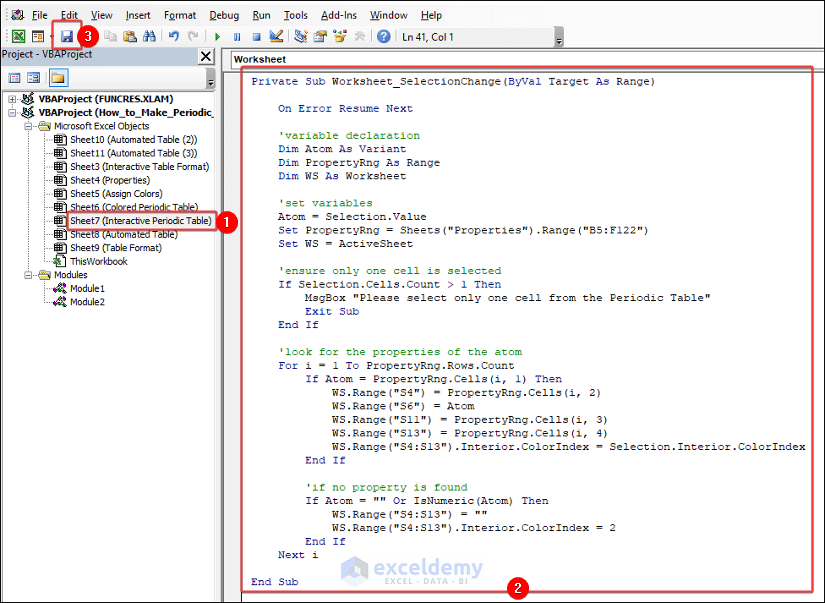
Private Sub Worksheet_SelectionChange(ByVal Target As Range)
    On Error Resume Next
    'variable declaration
    Dim Atom As Variant
    Dim PropertyRng As Range
    Dim WS As Worksheet
    'set variables
    Atom = Selection.Value
    Set PropertyRng = Sheets("Properties").Range("B5:F122")
    Set WS = ActiveSheet
    'ensure only one cell is selected
    If Selection.Cells.Count > 1 Then
        MsgBox "Please select only one cell from the Periodic Table"
        Exit Sub
    End If
    'look for the properties of the atom
    For i = 1 To PropertyRng.Rows.Count
        If Atom = PropertyRng.Cells(i, 1) Then
            WS.Range("S4") = PropertyRng.Cells(i, 2)
            WS.Range("S6") = Atom
            WS.Range("S11") = PropertyRng.Cells(i, 3)
            WS.Range("S13") = PropertyRng.Cells(i, 4)
            WS.Range("S4:S13").Interior.ColorIndex = Selection.Interior.ColorIndex
        End If
        'if no property is found
        If Atom = "" Or IsNumeric(Atom) Then
            WS.Range("S4:S13") = ""
            WS.Range("S4:S13").Interior.ColorIndex = 2
        End If
    Next i
End Sub- Click a cell inside the periodic table in the Interactive Periodic Table worksheet; you will see the property of the element of that cell. But if you select multiple cells, a warning dialog box will appear.
VBA Breakdown
If Selection.Cells.Count > 1 Then
        MsgBox "Please select only one cell from the Periodic Table"
        Exit Sub
End If- This portion of the VBA code checks the number of currently selected cells. If the number of selected cells exceeds 1, It displays a warning message in a MsgBox to alert the user. The code exits the subroutine using the Exit Sub command, preventing the rest of the code from executing.
For i = 1 To PropertyRng.Rows.Count
        If Atom = PropertyRng.Cells(i, 1) Then
            WS.Range("S4") = PropertyRng.Cells(i, 2)
            WS.Range("S6") = Atom
            WS.Range("S11") = PropertyRng.Cells(i, 3)
            WS.Range("S13") = PropertyRng.Cells(i, 4)
            WS.Range("S4:S13").Interior.ColorIndex = Selection.Interior.ColorIndex
End If- This portion of the VBA code iterates through each row of the PropertyRng range to find a match between the value of the selected cell (Atom) and the values in the first column of each row. When a match is found, some properties of the PropertyRng range are displayed in the worksheet. These properties include data from the matched row’s second, third, and fourth columns, which are placed within range S4:S13. Moreover, the background color of range S4:S13 is set to match the background color of the selected cell.
If Atom = "" Or IsNumeric(Atom) Then
            WS.Range("S4:S13") = ""
            WS.Range("S4:S13").Interior.ColorIndex = 2
        End If
Next i- When the selected cell is either empty or contains a numeric value, range S4:S13 is cleared. The range’s background color becomes white.
Things to Remember
There are a few things to remember while making a periodic table in Excel.
- Be careful with the source range of the VLOOKUP function.
- Use different colors for each element property.
- Make sure that the properties in the property table are accurate.
Frequently Asked Questions
1. What are the representative elements in a periodic table?
Representative elements are the elements in groups 1, 2, and 13 to 18 of the periodic table. They display a wide range of chemical properties and participate in numerous chemical reactions.
2. What is the significance of noble gas?
We refer to each element of group 18 as a noble gas. Noble gas is chemically inert. It does not take part in chemical reactions due to its stable electron configurations.
3. What are isotopes?
Isotopes have the same number of protons in their center, but they can have a different number of neutrons. This makes them a bit heavier or lighter versions of the same element.
Download Practice Workbook
You can download this practice workbook while going through the article.
Get FREE Advanced Excel Exercises with Solutions!
