
Image by Editor | Midjourney
Excel is a powerful tool for Excel inventory management; it helps to track stock levels, optimize costs, and ensure efficient operations. FIFO (First-In, First-Out) and LIFO (Last-In, First-Out) are two commonly used inventory valuation methods. In this article, we will show FIFO/LIFO analysis by using a structured dataset.
FIFO (First-In-First-Out)
- FIFO assumes that the oldest inventory is sold first.
- This method closely follows the natural flow of goods (e.g., perishable items like food and medicine).
- Advantage: Provides a higher net income when prices are rising, as older, lower-cost inventory is used first.
- Disadvantage: Higher net income results in higher taxes.
LIFO (Last-In-First-Out)
- LIFO assumes that the newest inventory is sold first.
- This method is beneficial for inflationary periods when newer stock is more expensive.
- Advantage: Reduces taxable income during rising prices by using higher-cost inventory first.
- Disadvantage: Ending inventory may be undervalued as it consists of older stock.
Step 1: Creating the Inventory Dataset
To analyze FIFO and LIFO, you need to create a dataset that includes purchase and sales records.
- Include the following columns for inventory management:
- Date
- Item
- Transaction Type
- Quantity
- Unit Cost
- Total Cost
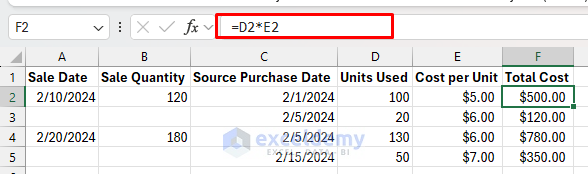
Calculate the Total Cost:
=D2*E2
This formula multiplies the unit cost by quantity.

Step 2: FIFO Analysis in Excel
FIFO assumes that the oldest inventory items are sold first. To implement FIFO:
- Sort Data: Arrange the data in chronological order (oldest purchases first).
- Track Inventory Usage:
- Maintain a running inventory.
- Deduct sold quantities from the earliest available stock.
- Calculate Cost of Goods Sold (COGS):
- Then you can use Excel formulas to determine which stock batches are used.
FIFO Dataset Format:
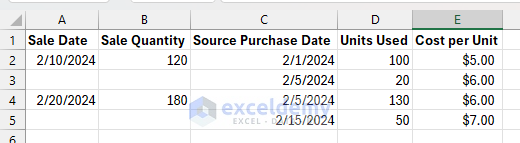
Total Cost in FIFO:
- Select cell F2 and insert the following formula.
Formula:
=D2*E2
This formula will calculate the total cost in batches depending on the sale quantity.
You can also use the following formula to calculate the total cost.
Formula:
=IF(SUM($B$2:B2)<=D2, D2*E2, (D2-SUM($B$2:B2)+B2)*E2)
In this formula, column B represents sale quantity, column D represents source purchase quantity, and column E represents unit cost.
Step 3: LIFO Analysis in Excel
LIFO assumes that the newest inventory items are sold first. The process is similar to FIFO but deducts from the most recent purchases first.
Total Cost in LIFO:
Formula:
=D2*E2
This formula calculates the total cost based on the batch arrangement.

You can also use the following formula to calculate the total cost.
Formula:
=IF(SUM($B$2:B2)<=D2, D2*E2, (D2-SUM($B$2:B2)+B2)*E2)
In this formula, column B represents sale quantity, column D represents source purchase quantity, and column E represents unit cost.
Step 4: Comparing FIFO vs. LIFO
To analyze the impact of FIFO vs. LIFO, compare the COGS (Cost of Goods Sold) and Ending Inventory Value.
COGS (LIFO):
=SUM(FIFO!F2:F5)
COGS (FIFO):
=SUM(LIFO!F2:F3)
Ending Inventory Value (FIFO):
=SUM(Dataset!D2:D4)-SUM(FIFO!B2:B5)
Ending Inventory Value (LIFO):
=SUM(Dataset!D2:D4)-SUM(LIFO!B2:B3)
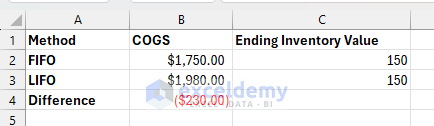
Key Insights:
- FIFO results in lower COGS during inflation, leading to higher profits but higher tax liability.
- LIFO results in higher COGS, reducing taxable income but showing lower profits.
Conclusion
You can analyze the FIFO and LIFO in Excel to track stock efficiently and optimize financial decisions. Understanding these methods is crucial for accountants, supply chain managers, and business owners. By following this tutorial, you can implement FIFO/LIFO calculations in Excel and make informed inventory decisions.
Get FREE Advanced Excel Exercises with Solutions!
