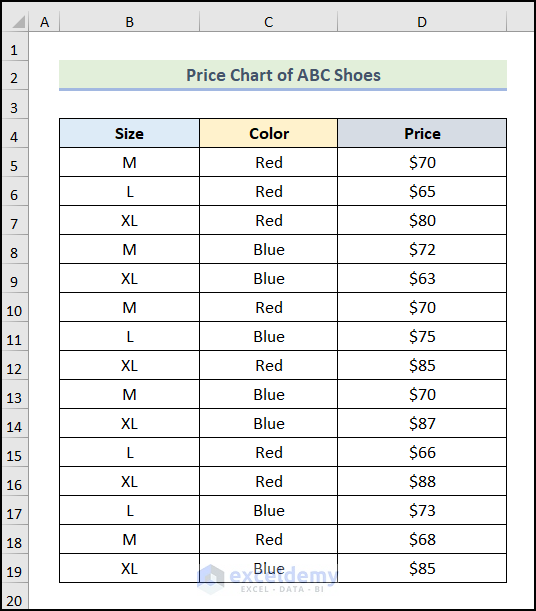
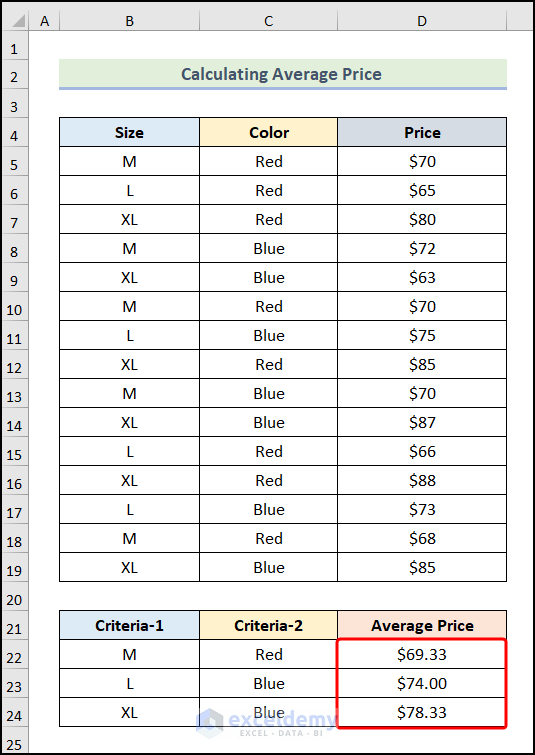
Example 1 – Calculating the Average Price
Our dataset is a Price Chart of Shoes. We’ll determine the Average Price based on a few factors.
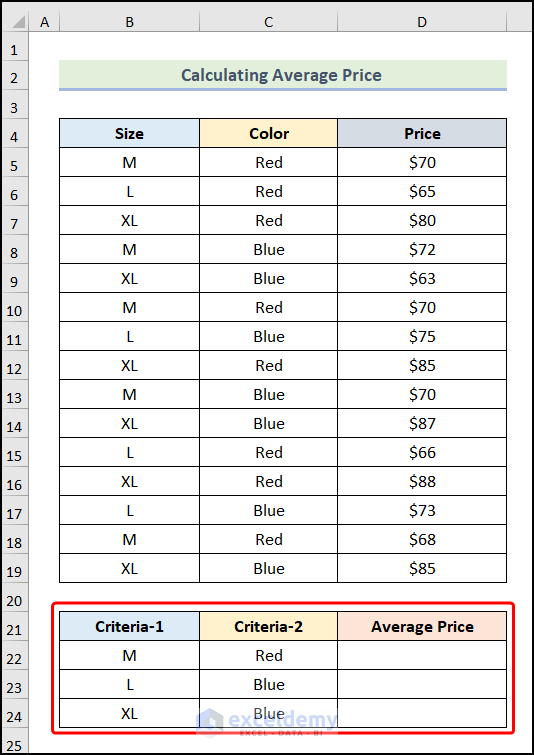
Steps:
- Create a table as marked in the following image in your worksheet.
- Enter the formula given below in cell D22.
=AVERAGEIFS($D$5:$D$19,$B$5:$B$19,B22,$C$5:$C$19,C22)- Press Enter.
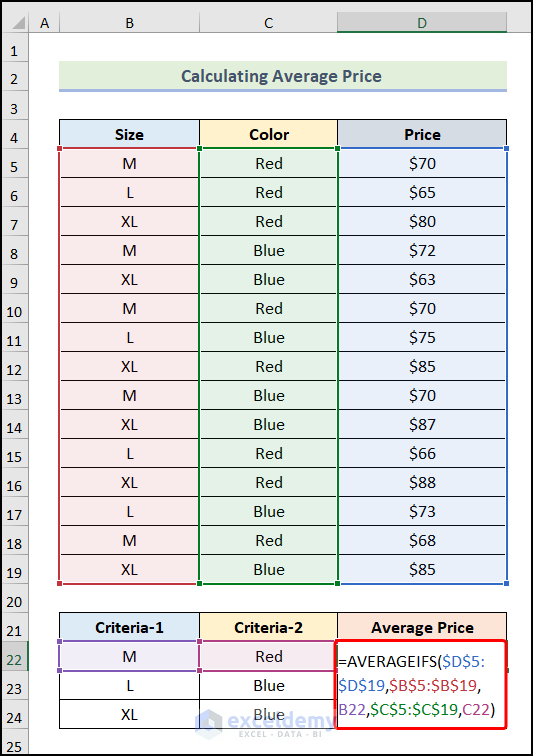
- You will get the Average Price for Size M shoes in Red Color.
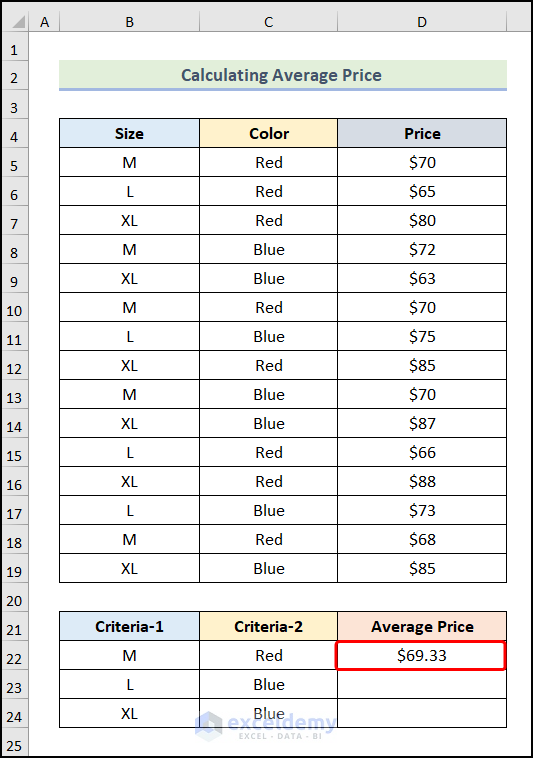
- Use the AutoFill feature to get the rest of the outputs as demonstrated in the following picture.
Read More: How to Use Excel AVERAGEIFS Function with Multiple Criteria
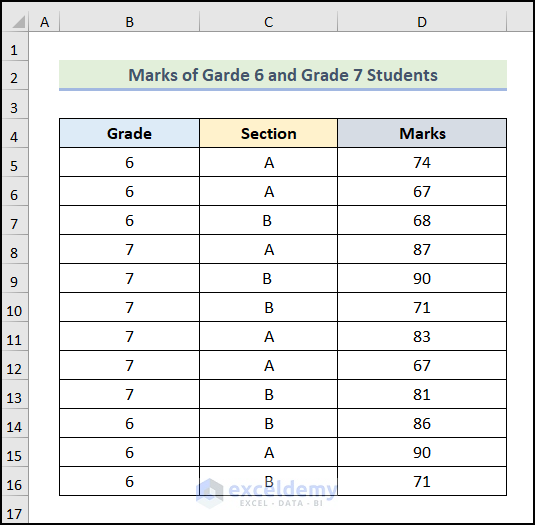
Example 2 – Computing the Average Marks
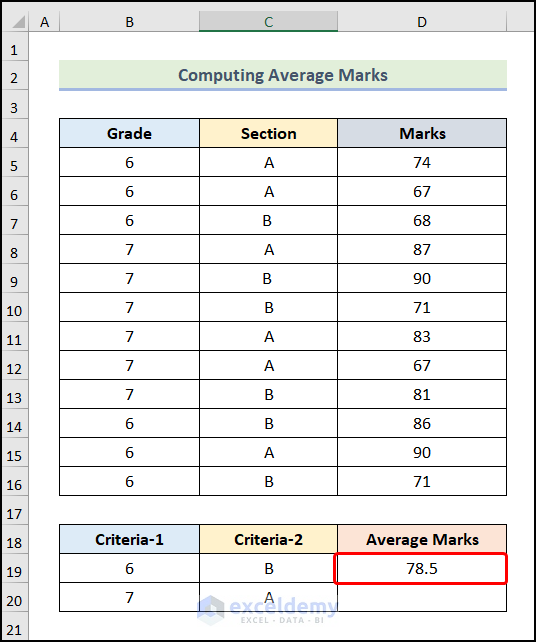
We have the Marks of Grade 6 and Grade 7 Students as our dataset. We’ll calculate the Average Marks of the students based on Grade and Section.
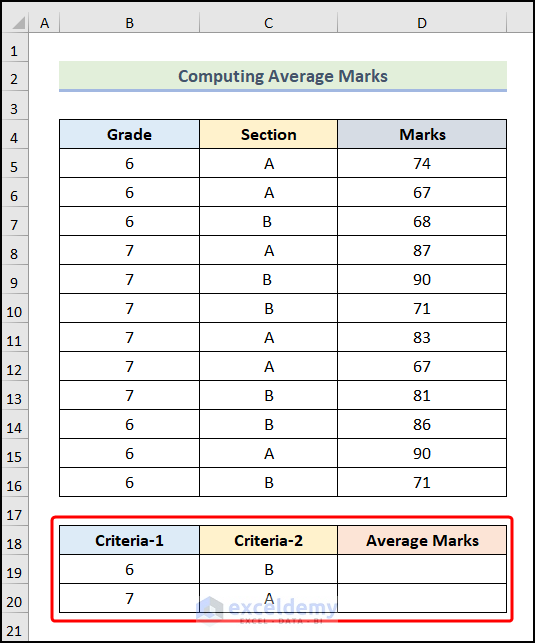
Steps:
- Create a table for the criteria and results.
- Enter the following formula in cell D19.
=AVERAGEIFS($D$5:$D$16,$B$5:$B$16,B19,$C$5:$C$16,C19)- Hit Enter.
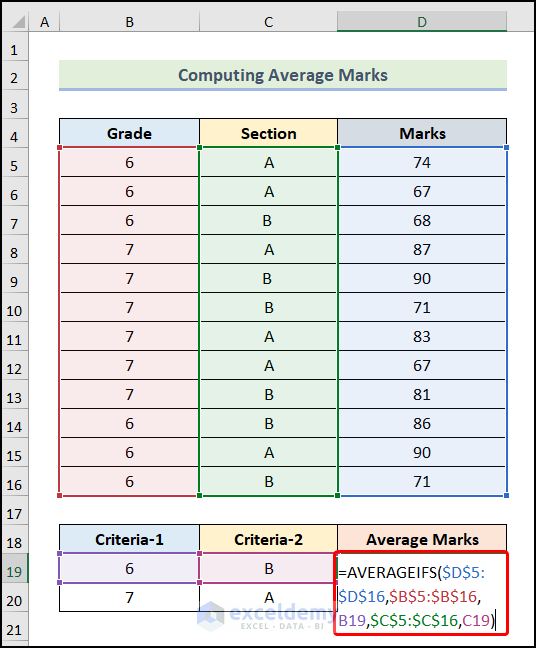
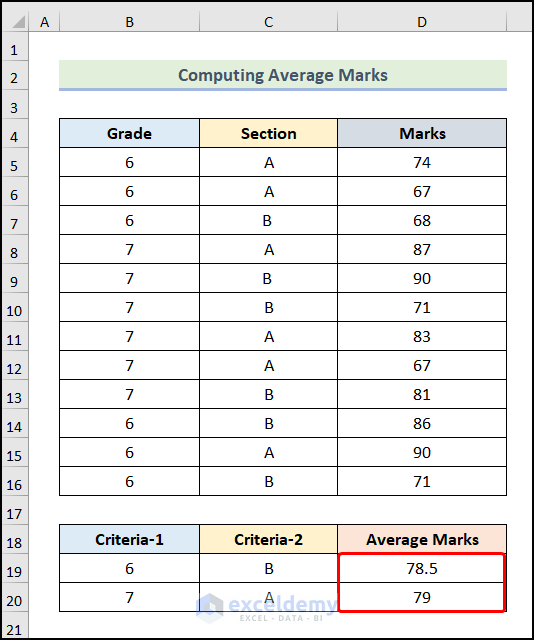
Here are the results.
- by using the AutoFill option, you can get the remaining outputs.
How to Calculate the Average of Multiple Columns Based on a Single Condition
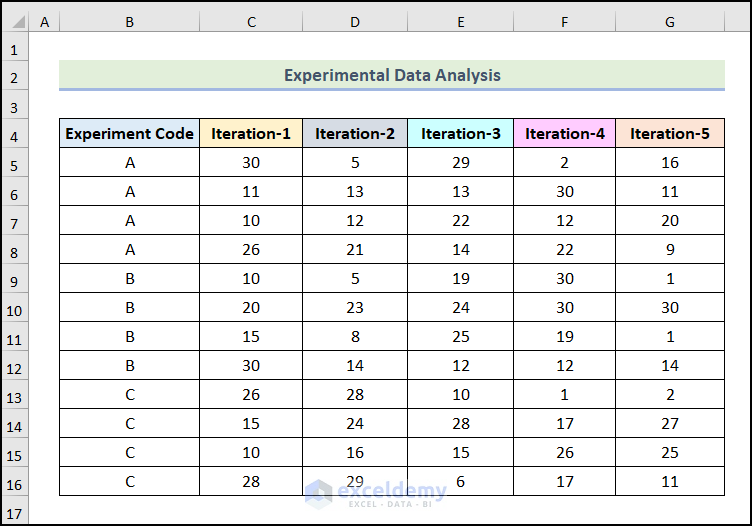
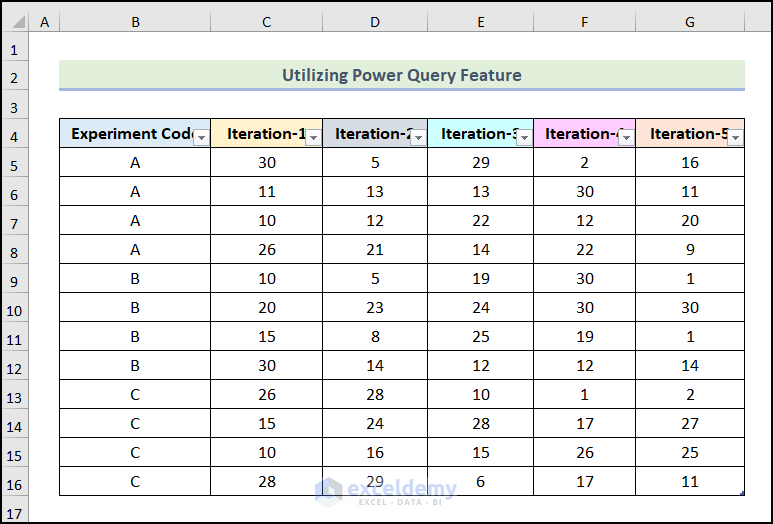
We have an Experimental Data Analysis as our dataset with 3 Experiment Codes. Each Experiment has 4 sets of data for 5 Iterations. We’ll calculate the Average of each Experiment data for all Iterations.
Method 1 – Applying AVERAGE and FILTER Functions
Steps:
- Create a table for the results.
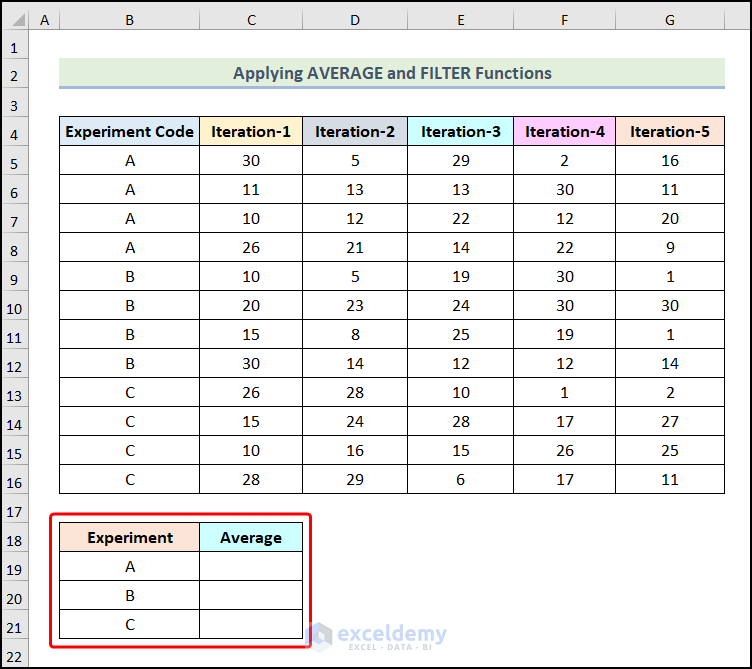
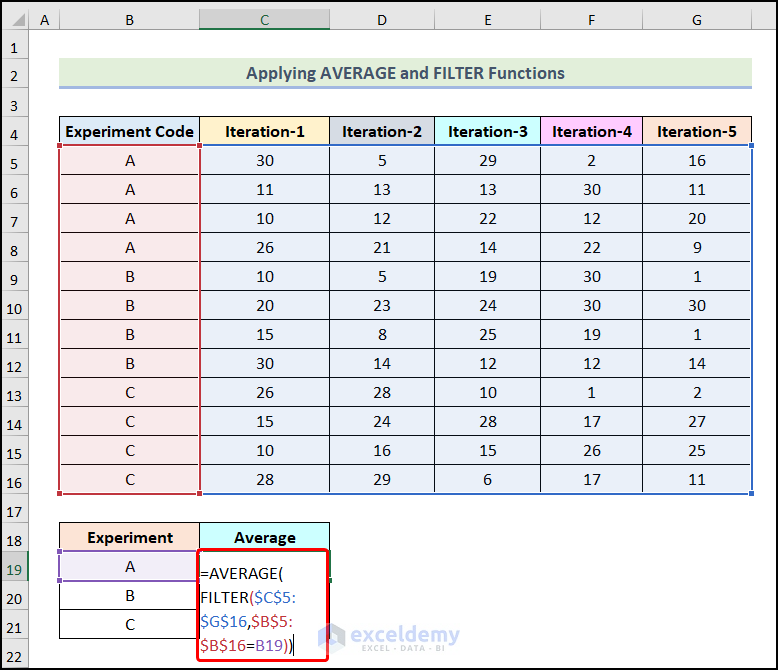
- Enter the formula given below in cell C19.
=AVERAGE(FILTER($C$5:$G$16,$B$5:$B$16=B19))Formula Breakdown
- FILTER($C$5:$G$16,$B$5:$B$16=B19) → Returns the filtered data from the range $C$5:$G$16 based on a condition.
- $C$5:$G$16 → The array argument.
- $B$5:$B$16=B19 →Refers to the include argument.
- Output → {30,5,29,2,16;11,13,13,30,11;10,12,22,12,20;26,21,14,22,9}.
- AVERAGE(FILTER($C$5:$G$16,$B$5:$B$16=B19)) → Becomes AVERAGE({30,5,29,2,16;11,13,13,30,11;10,12,22,12,20;26,21,14,22,9}).
- Output → 16.40.
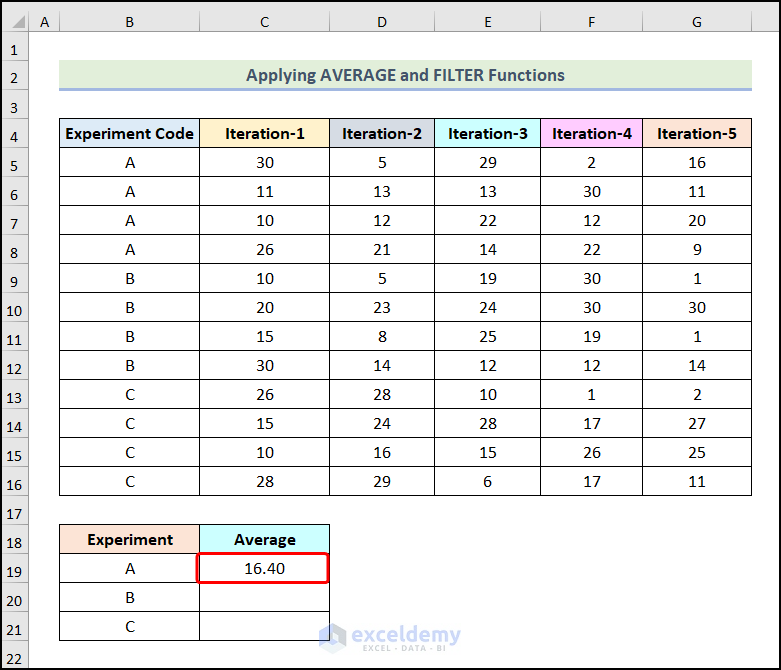
- Press Enter.
- You will have the Average of all the Iterations of Experiment A.
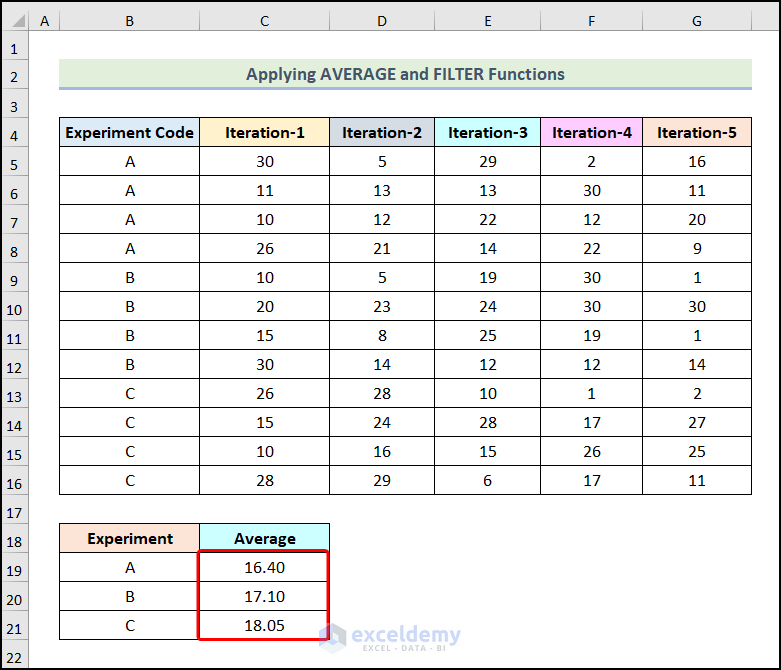
- Use the AutoFill option to get the remaining outputs.
Read More: Excel AVERAGEIFS with Multiple Criteria in Same Range
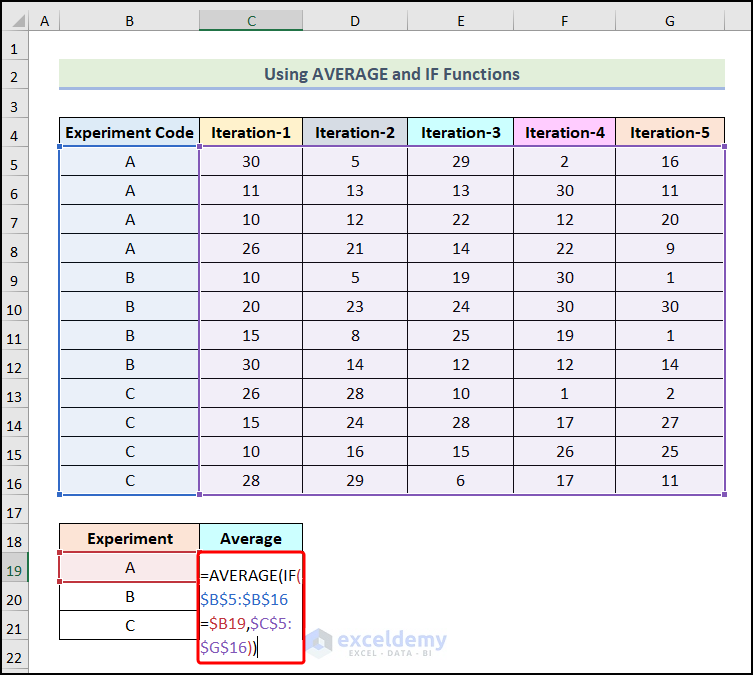
Method 2 – Using AVERAGE and IF Functions
Steps:
- Create a table for the results.
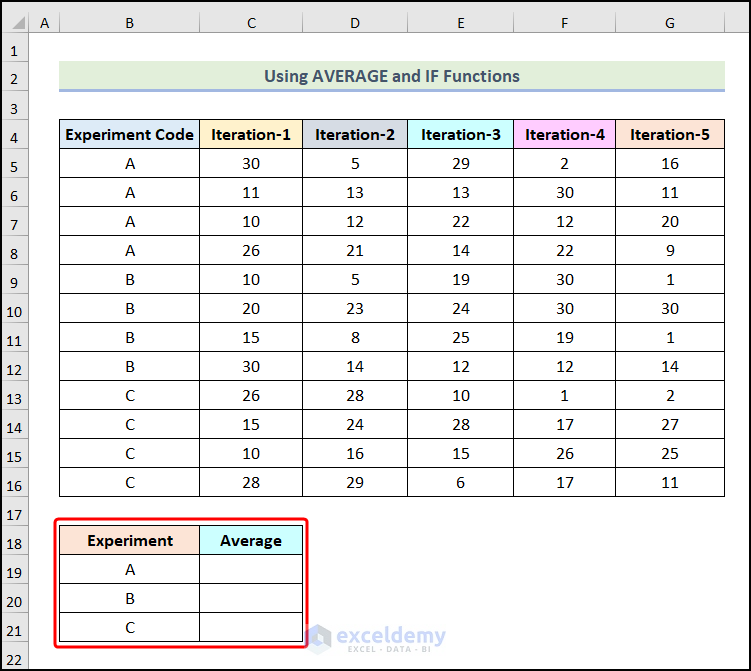
- Enter the following formula in cell C19.
=AVERAGE(IF($B$5:$B$16=$B19,$C$5:$G$16))The AVERAGE function will return the average of the cells that satisfies the IF condition.
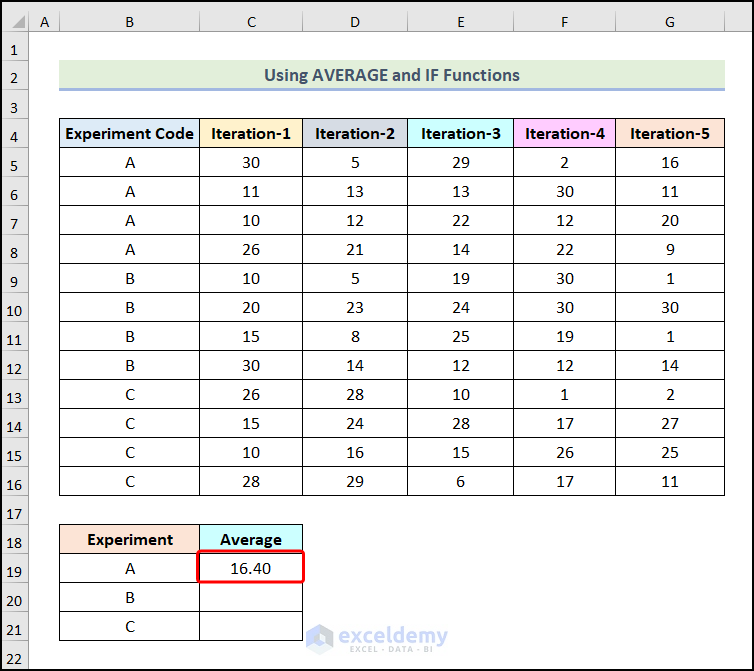
- Press Enter.
- You will get the Average value of Experiment A for all Iterations.
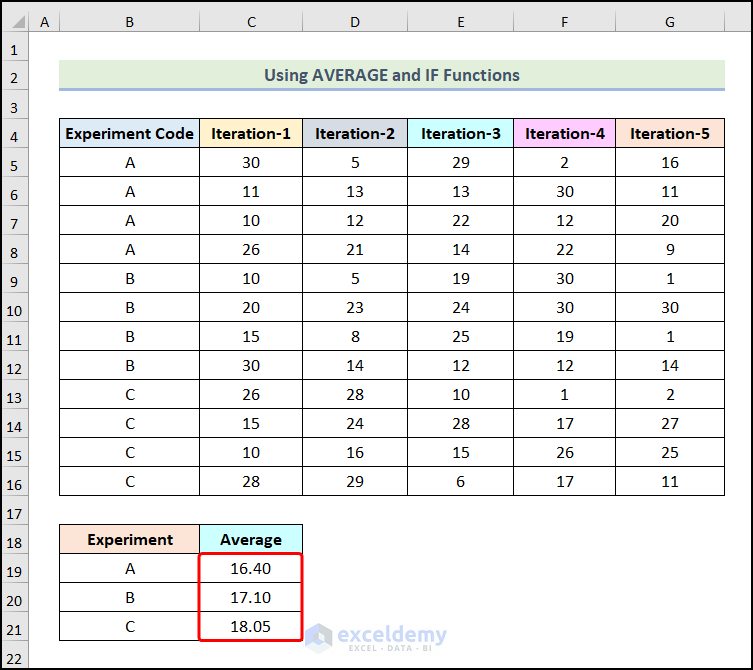
- Use the AutoFill option to fill in the table.
How to Calculate the Average of Multiple Columns Based on Multiple Conditions
Steps:
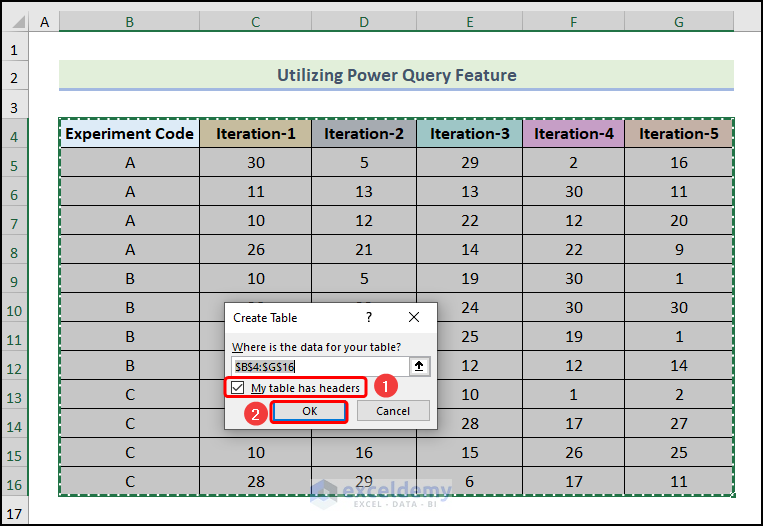
- Select your entire dataset and press the keyboard shortcut Ctrl + T.
- Check the box for My table has headers in the Create Table dialogue box.
- Click on OK.
- You will get the following output on your worksheet.
- Select your table and go to the Data tab from the Ribbon.
- Choose the From Table/Range option from the Get & Transform Data group.
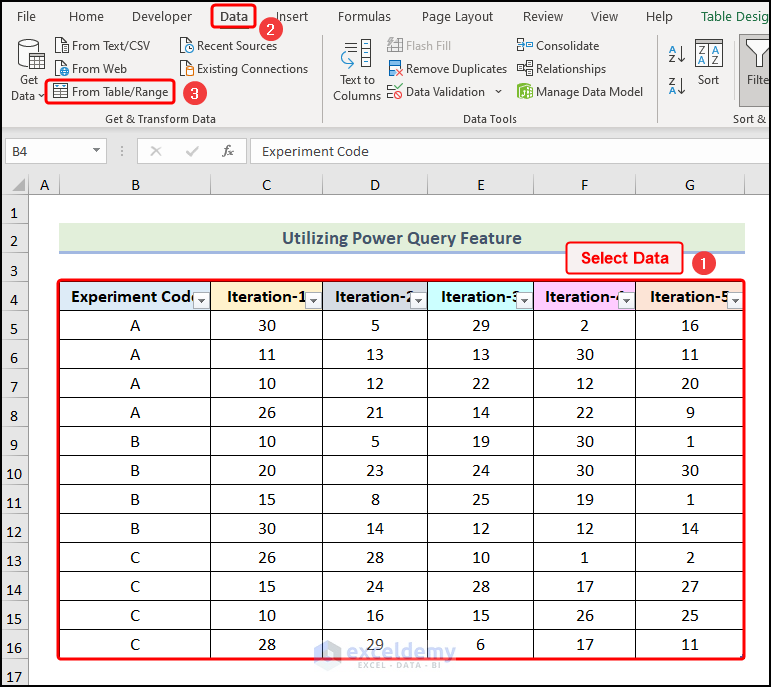
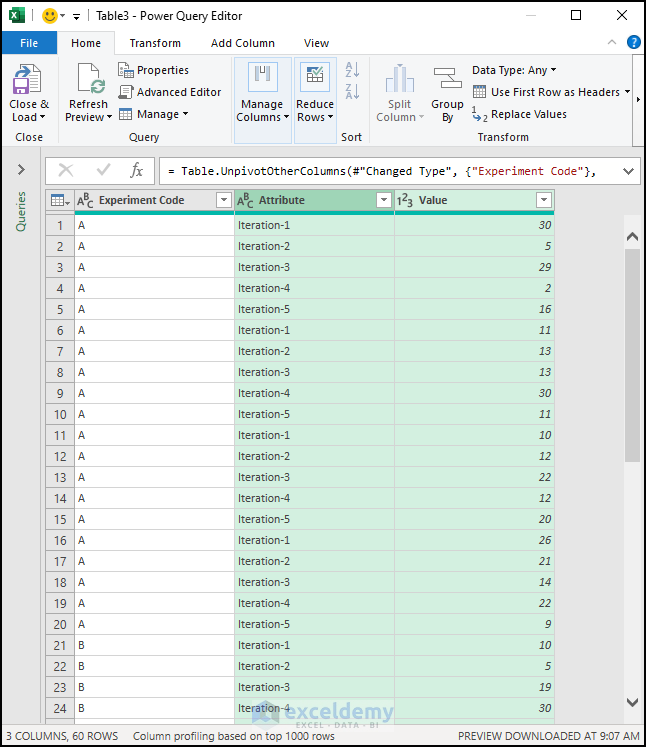
- The Power Query Editor window will open.
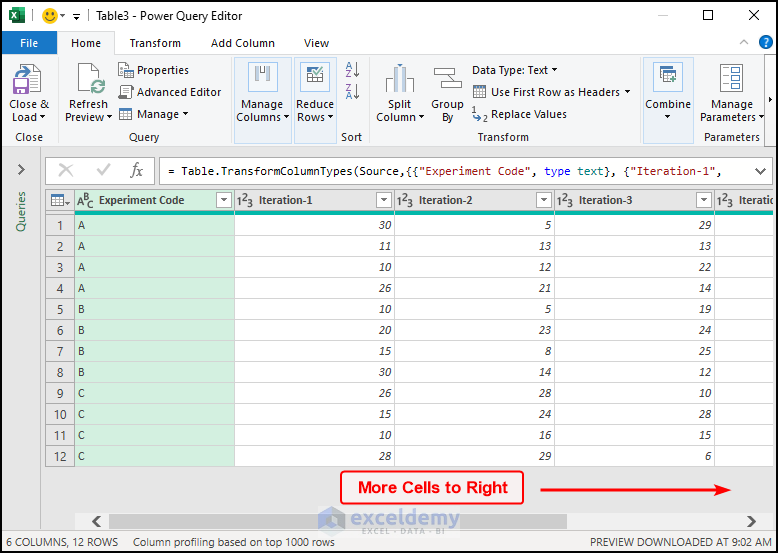
- Right-click on the Experiment column.
- Choose the Unpivot Other Columns option.
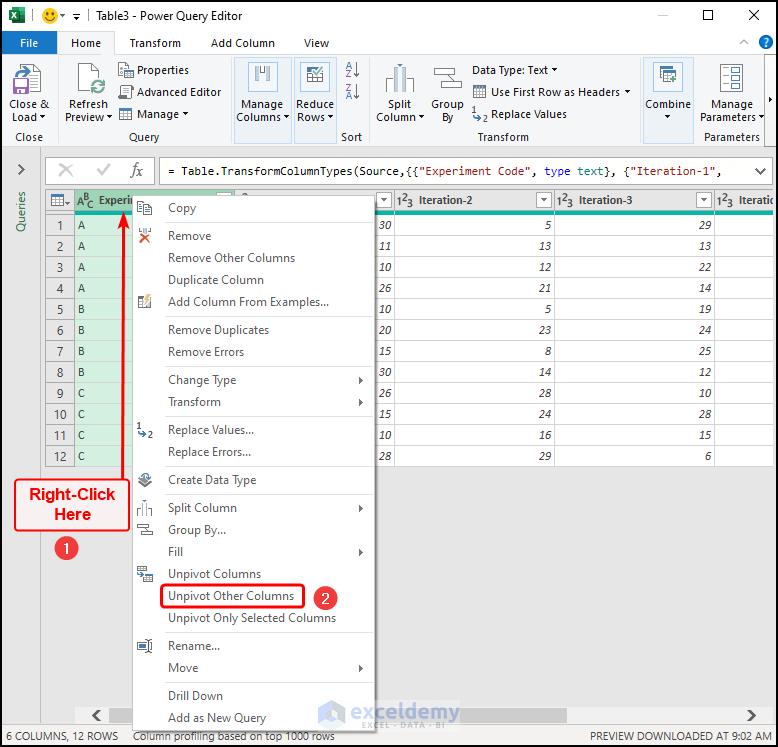
- Your dataset will look like the following picture.
- Click on the Close & Load option.
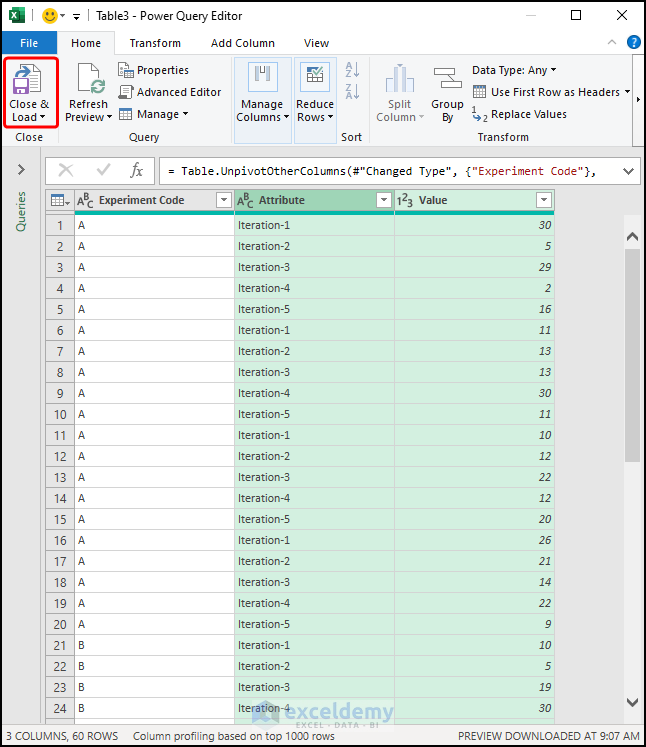
- You will be redirected to your workbook with your modified dataset.
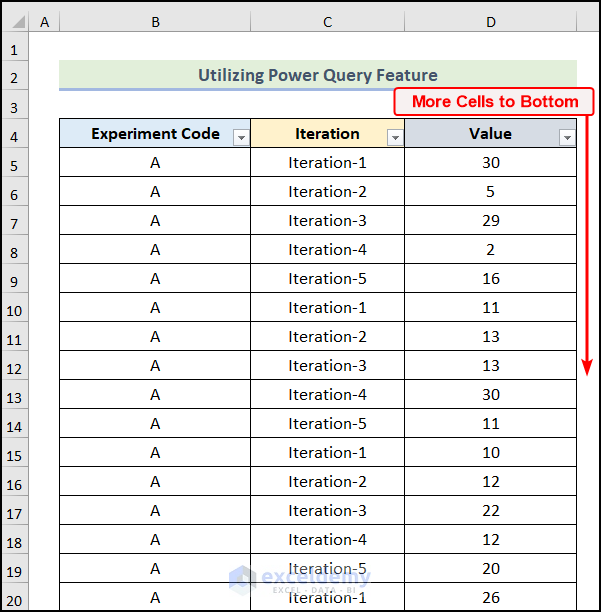
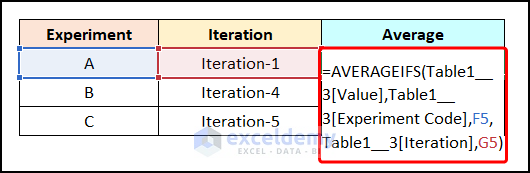
- Create a table as shown in the image below.
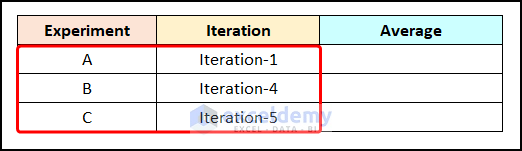
- Enter the following formula in cell H5.
=AVERAGEIFS(Table1__3[Value],Table1__3[Experiment Code],F5,Table1__3[Iteration],G5)The AVERAGEIFS function will return the average of the cells of the Value column based on the specified conditions.
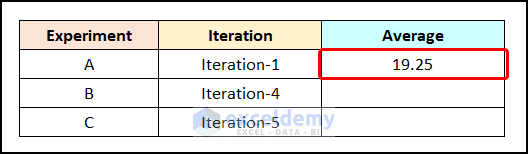
- Press Enter.
- You will get the Average of Experiment A for Iteration-1.
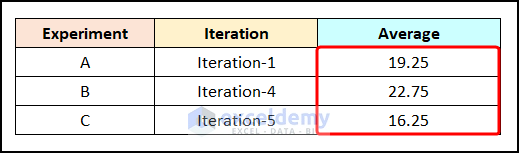
- Use the AutoFill feature to get the rest of the outputs.
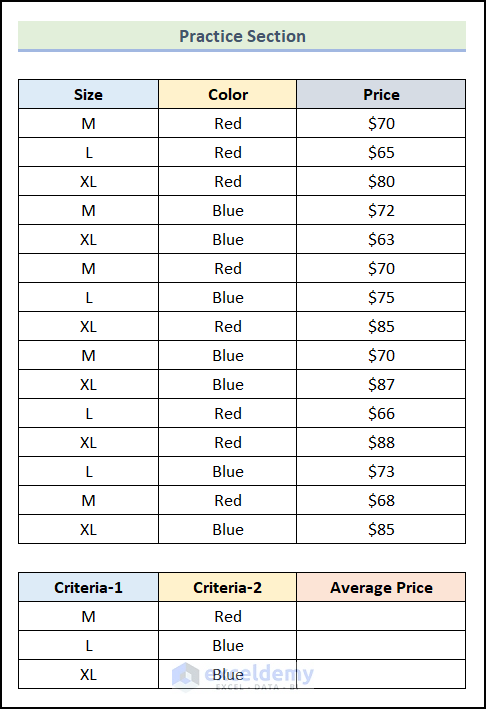
Practice Section
In the Excel Workbook, we have provided a Practice Section on the right side of the worksheet.
Download the Practice Workbook
Related Articles
- How to Apply AVERAGEIFS Function Between Two Dates in Excel
- AVERAGEIFS Function with “Not Equal to” Criteria
<< Go Back to Excel AVERAGEIFS Function | Excel Functions | Learn Excel
Get FREE Advanced Excel Exercises with Solutions!
