In statistical analysis, researchers may often analyze the behavior of a set of data through various statistical parameters such as the median, mode, standard deviation, skewness, and so on. Similarly, sometimes they need to evaluate the Kurtosis of a set of data. Nowadays, Excel simplifies work because you don’t need to understand the rigorous physique to calculate those values. Kurtosis describes how peaked or flat a distribution is in relation to the normal distribution. A relatively peaked distribution is indicated by a positive Kurtosis. A relatively flat distribution is indicated by negative Kurtosis. In this article, we will talk about how to calculate Kurtosis in Excel.
Introduction to Kurtosis
In a general norm, the distributed data of a phenomenon is plotted in a 2D graph, and the resulting curve tends to move in an upward direction known as the Bell curve. However, Kurtosis is a statistical metric that demonstrates how many data clusters at a frequency distribution’s end or highest point.
Based on the shape of the curved line, Kurtosis can be classified as mesokurtic, leptokurtic, or platykurtic.
When Kurtosis is approximately 3, the distribution is known as Mesokurtic, while the term Platykurtic is denoted if its value is less than 3. However, the plotted curve’s shape is not as similar as the well-known Bell Curve. Same goes for Leptokurtic when the Kurtosis value exceeds 3.
Formula to Calculate Kurtosis
Despite having a biased estimation if you do not have the full-scale data of a given phenomenon, we will calculate the Kurtosis using the Population Kurtosis Formula in this article. It is denoted mathematically by the following formula:
Kurtosis =Fourth Moment value/Square of second Moment valueWhere,
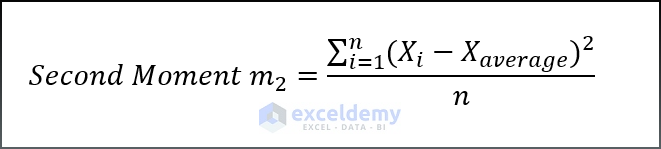
and,
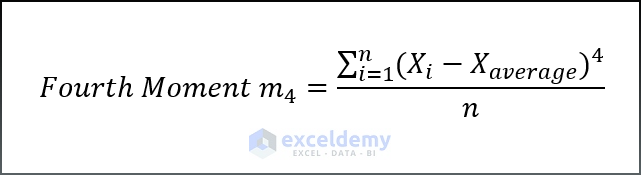
Here,
- n= Sample size
- Xi= sample value
- Xavaerage= mean value of the sample values.
How to Calculate Kurtosis in Excel: 2 Easy Methods
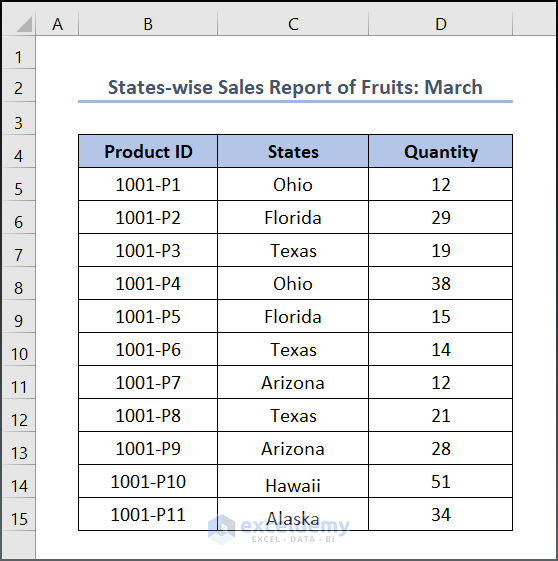
We take into account a random variable x and a data collection of size n, S = {x1, x2,…, xn} that contains all possible x values. The data set may reflect the entire population under study or merely a sample taken from it. Let’s assume we have a dataset, namely “States-wise Sales Report of Fruits: March”. You can use any dataset suitable for you.
Here, we have used the Microsoft Excel 365 version; you may use any other version according to your convenience.
1. Applying Arithmetic Formula
The very first method that we are going to apply is based on the above-mentioned arithmetic formula. For doing so, we will calculate the mean value, then calculate the second and fourth moment values, and finally determine the Kurtosis value based on the given data.
📌 Steps:
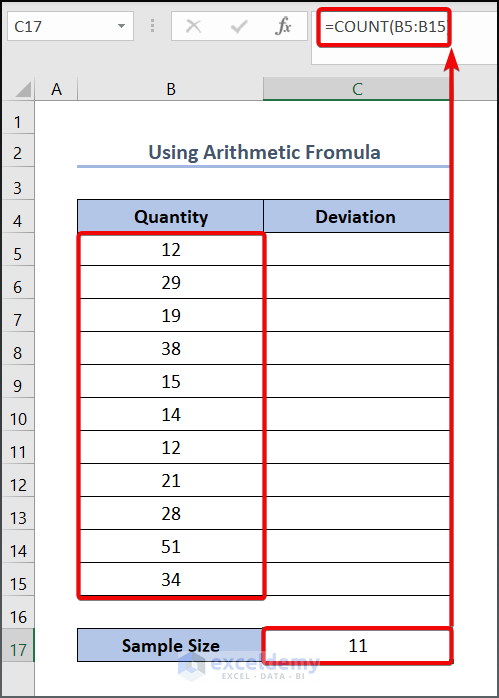
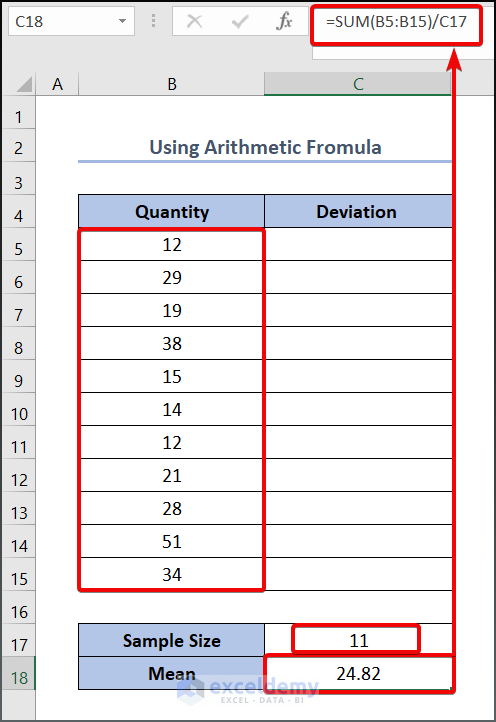
- Firstly to determine the sample size of our dataset, write the following formula in the C17 cell.
=COUNT(B5:B15)
- Now to calculate the mean value write the following formula in the C18 cell.
=COUNT(B5:B15)
Here, B5:B15 refers to the numerical values of each data and C17 represents the sample size.
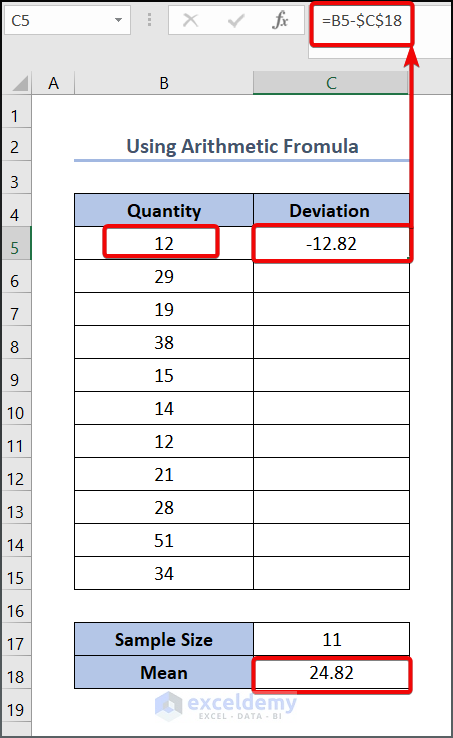
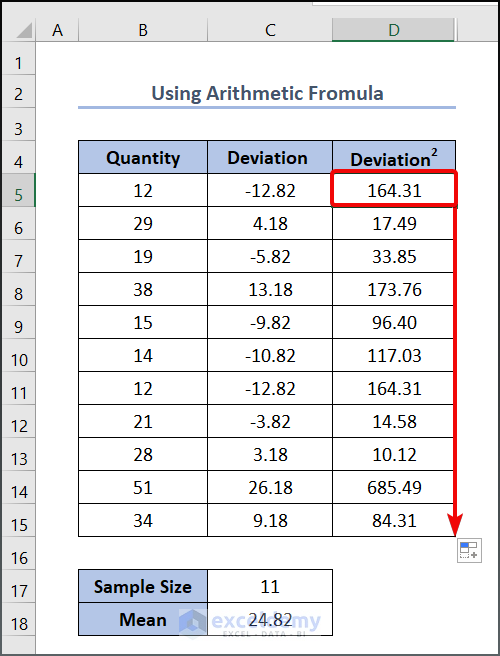
- Now it’s time to calculate the deviation of each value from the mean value. Write the following formula in the C5 cell.
=B5-$C$18
As you can see, we have locked the C18 cell because we have to use it to get the other value.
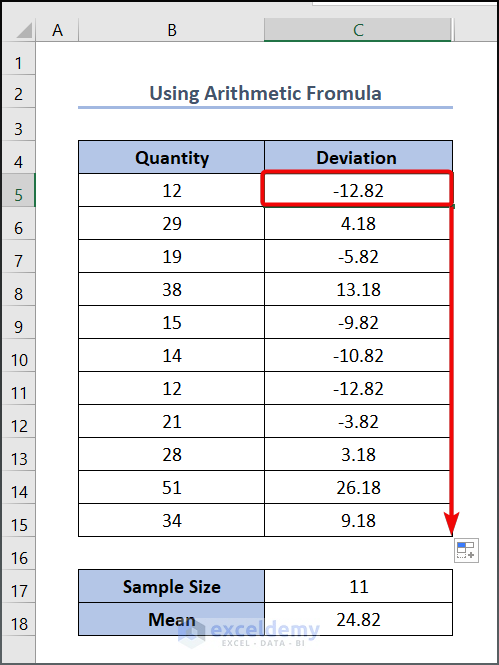
- Drag the Fill Handle tool to get the other values.
- Enter the following formula in cell D5 to calculate the squared value of the deviation.
=C5^2
- Press OK to see the output.
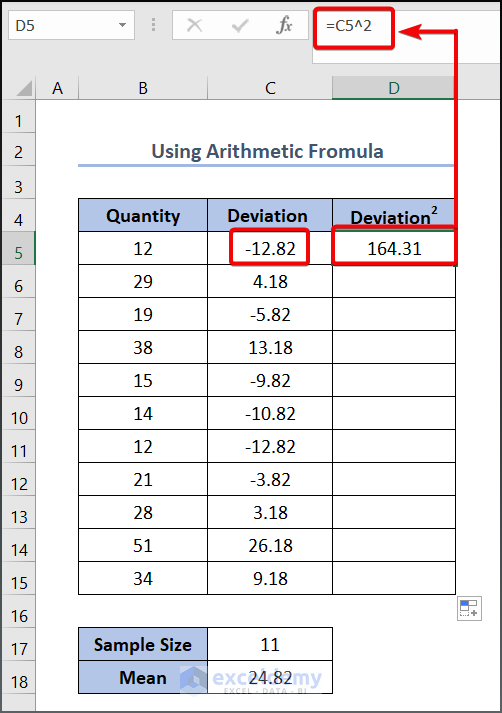
- Drag the Fill Handle tool to get the other values.
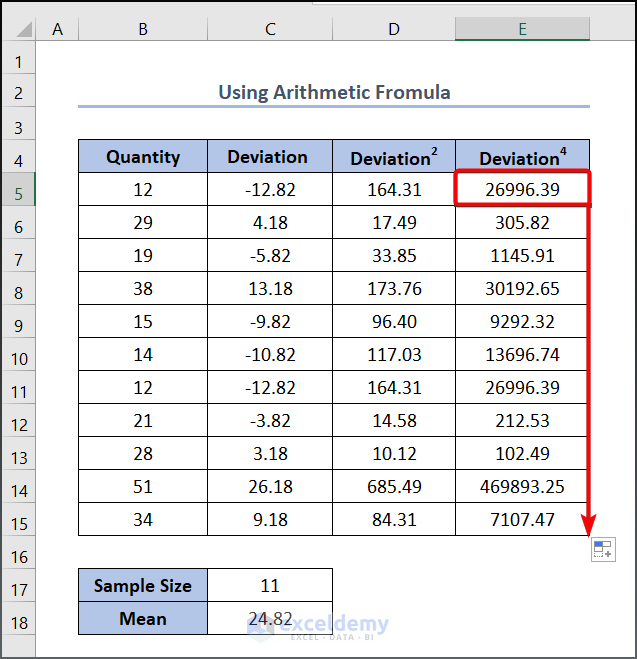
- Now, enter the following formula in cell E5.
=C5^4
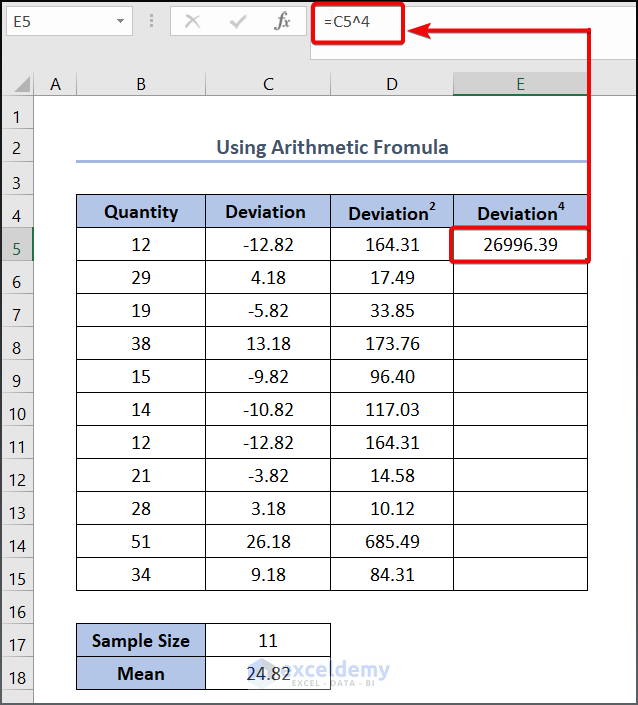
- Lower the cursor to the E15 cell to use the AutoFill tool.
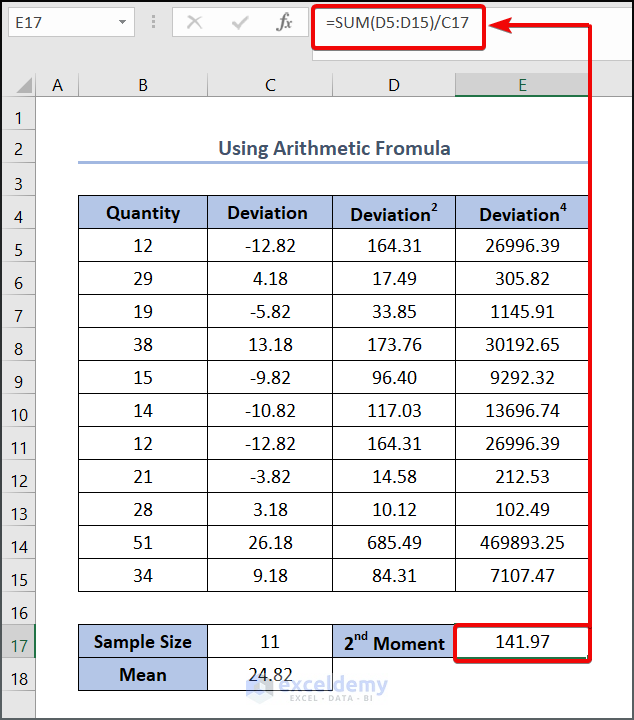
- Now it’s time to calculate the second moment. Write the following formula in the E17
=SUM(D5:D15)/C17
- Press the Enter button to see the output as given below.
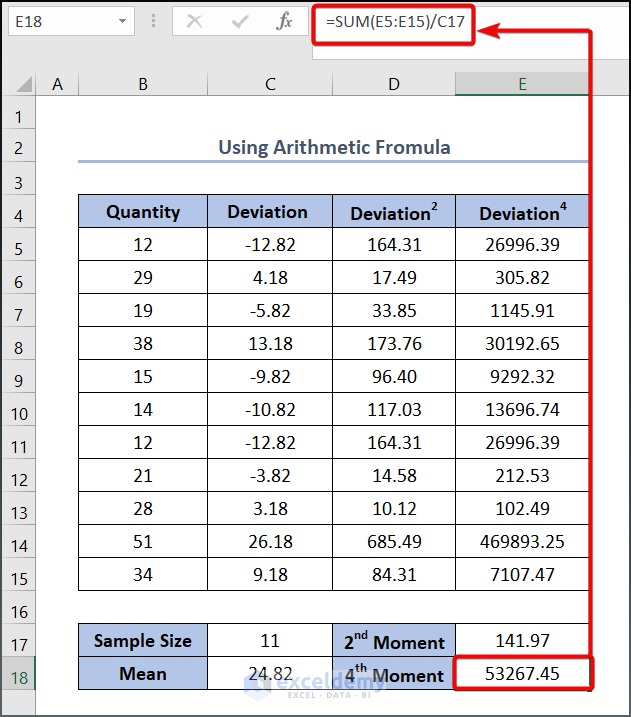
- To calculate the fourth moment, put the formula in the E18 cell.
=SUM(E5:E15)/C17
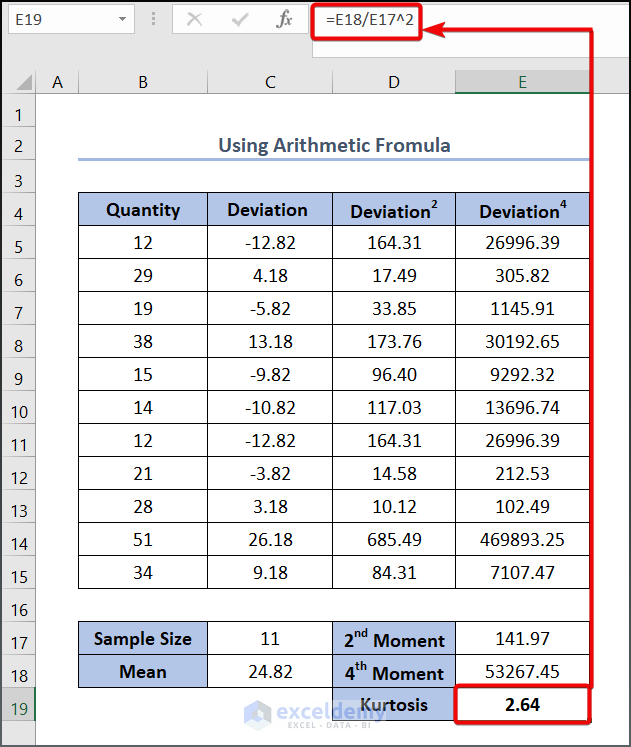
- We are on the verge of calculating the Kurtosis value. Enter the following formula in the E19 cell.
=E18/E17^2
Here, E17 refers to the second moment value, and E18 refers to the fourth moment value.
- Press Enter to see the output as below.
Read More: How to Calculate Skewness in Excel
2. Using KURT Function
If we found the above-mentioned formula repetitive and monotonous, Excel provides a function that will assuage your pain. Here we will incorporate the KURT function to calculate the Kurtosis value of our given dataset.
📌 Steps:
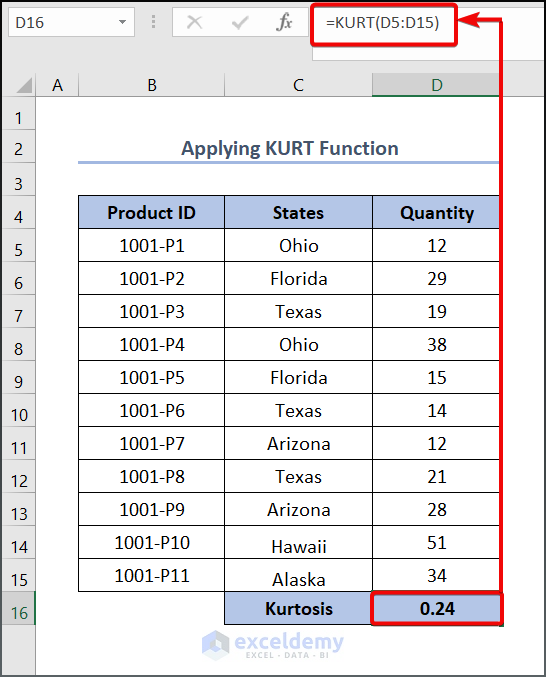
- Write the following function in D16 cell.
=KURT(D5:D15)
- Press the Enter key to see the output.
Easy task! Doesn’t it?
Now you might wonder why the Kurtosis values are different despite having the same dataset in those two methods. The reason for this is that the KURT function in Microsoft Excel was created using the Sample Kurtosis Formula rather than the formula depicted above.
Read More: How to Calculate Coefficient of Skewness in Excel
Things to Remember
- The maximum argument the KURT function can hold is 30. Thus if your dataset is larger than 30, you will face trouble using this function.
- Similarly, the minimum number of arguments to get the output from the KURT function is 4. So if your sample size is less than 4, then an error will occur. To avoid such a situation, you have to input a value, even zero as your argument to fulfill the minimum requirement.
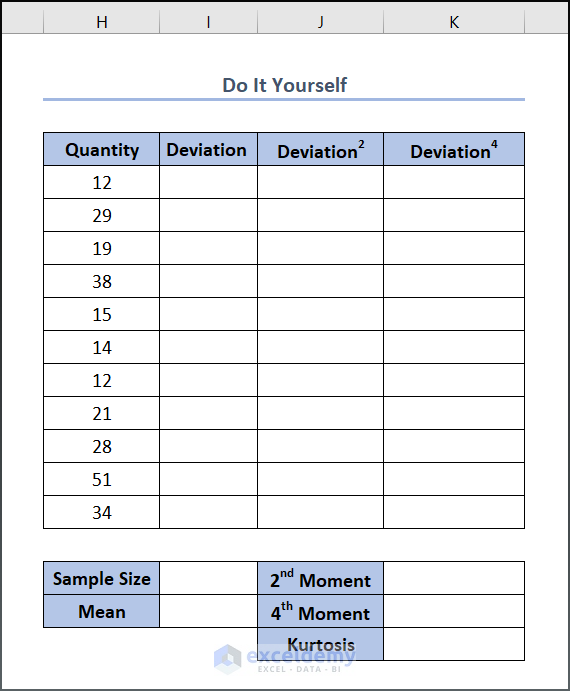
Practice Section
We have provided a Practice section on the right side of each sheet so you can practice yourself. Please make sure to do it yourself.
Download Practice Workbook
You can download and practice the dataset that we have used to prepare this article.
Conclusion
In this article, we have discussed how to calculate Kurtosis in Excel. As you have already understood, there are some limitations to using the second method. So, make sure your data is sufficient enough before applying this method. Further, if you have any queries, feel free to comment below and we will get back to you soon.
Related Articles
<< Go Back to Skewness and Kurtosis in Excel | Excel for Statistics | Learn Excel
Get FREE Advanced Excel Exercises with Solutions!
