Whenever we need to compare and visualize data, we use an Excel chart to represent it. Sometimes we need to change the series color according to our presentation theme. Changing series color in an Excel chart is an easy task to do. Need to learn how to change series color in an Excel chart? You are in the right place. Here we covered some basic and easy steps to change the chart color in Excel. So, let’s start.
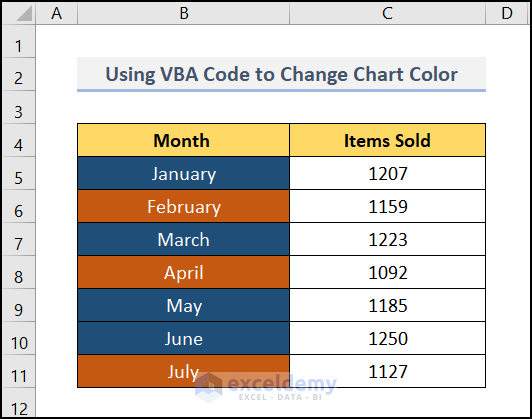
Making an Excel chart is pretty basic. Here we have a chart of Month-wise Items Sold. We take the first 7 months of the year and their corresponding items sold. Then we make a chart with this data. Now, we want to change the series color on this Excel chart.
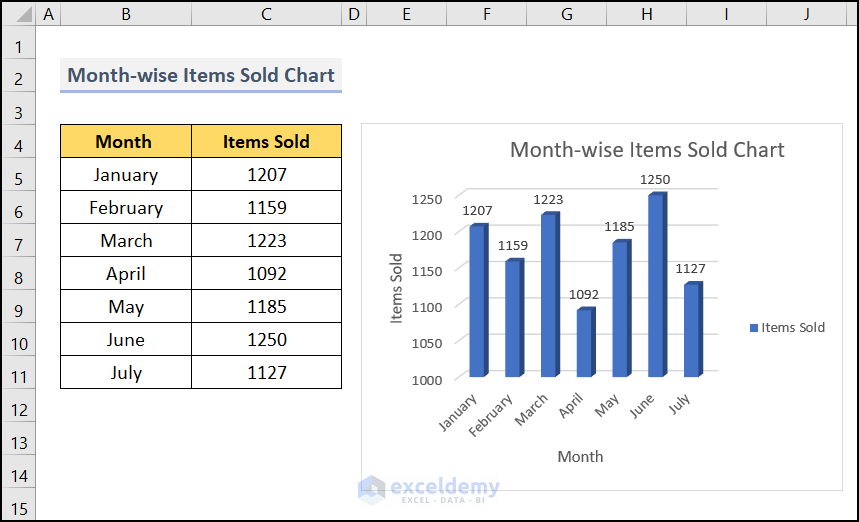
Here, we have used Microsoft Excel 365 version, you may use any other version according to your convenience.
1. Changing Color Fill for the Bars
When we made a chart, we can see longitudinal bars which take the value of the Y-axis. After entering the series, you can change the color of the bar using the Fill from the series options of Format Data Series. You need to follow the steps to change the series color in the Excel chart.
📌 Steps:
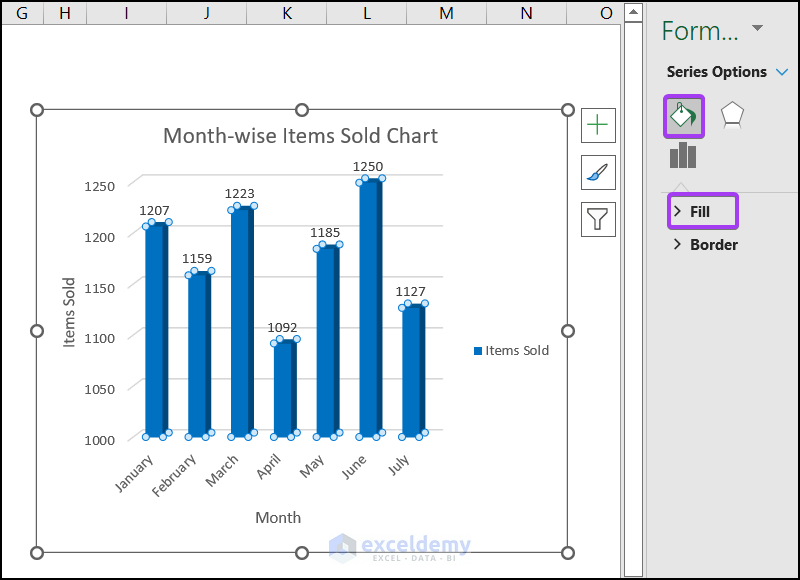
- Firstly, click on any bar of your chart. Then a sidebar named Format Data Series will appear.
- From the Series Options select Fill.
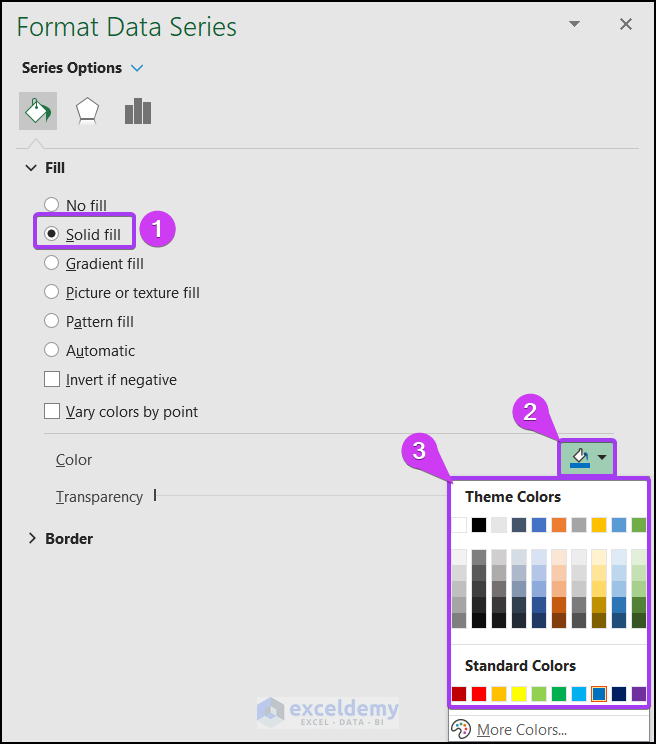
- You may see a lot of options under Fill. Select Solid fill.
- Then select a color you wanted to apply in the chart bars from the Theme Colors options.
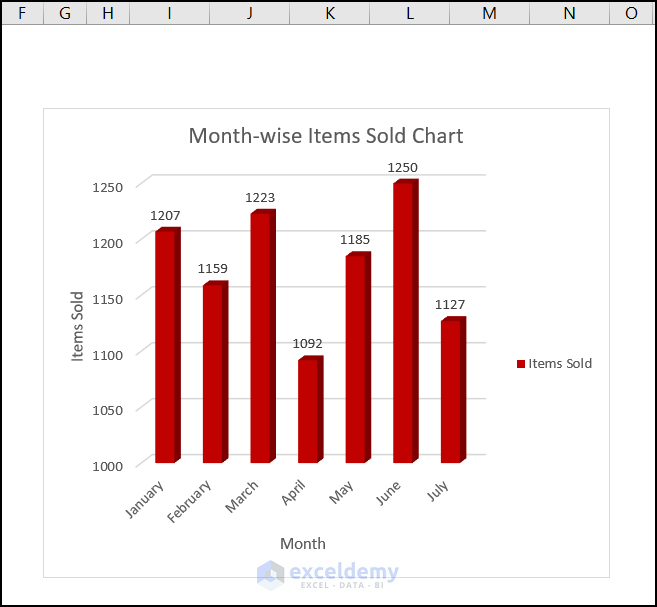
- Finally, the color of your bar will be changed according to your choice. Here you can see that we chose the red color to fill our bars.
2. Using Different Colors for Each Bar
Sometimes, you may need to fill each of the chart bars with distinct colors to make your chart more stylish and good looking. By choosing a different color for each bar, your chart will be more attractive and decorated according to your presentation theme. You have to go through some simple steps to do that. Luckily, we have covered this here.
📌 Steps:
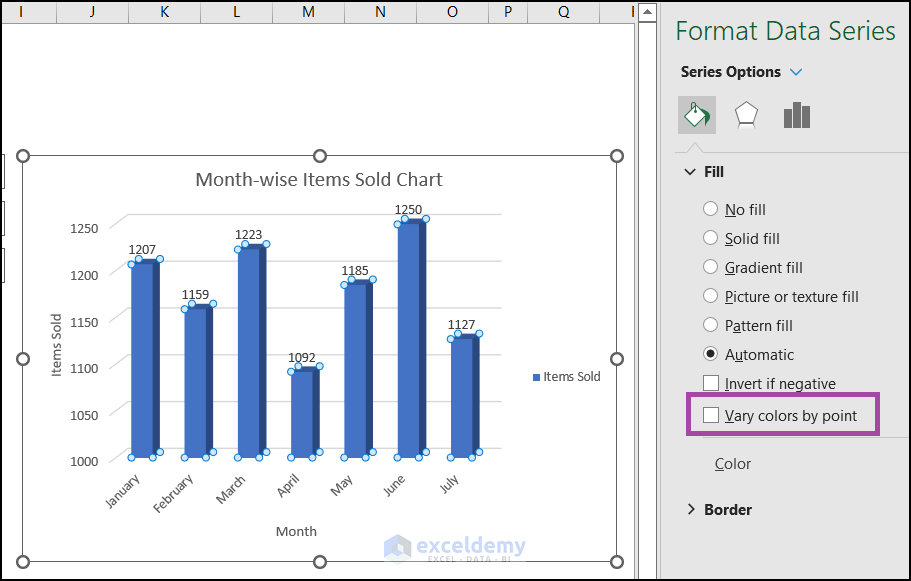
- Initially, select any place of the chart bars >> go to Format Data Series >> select Fill.
- After that, under the Fill option, there is an option named Vary colors by point. So, check the box before the option.
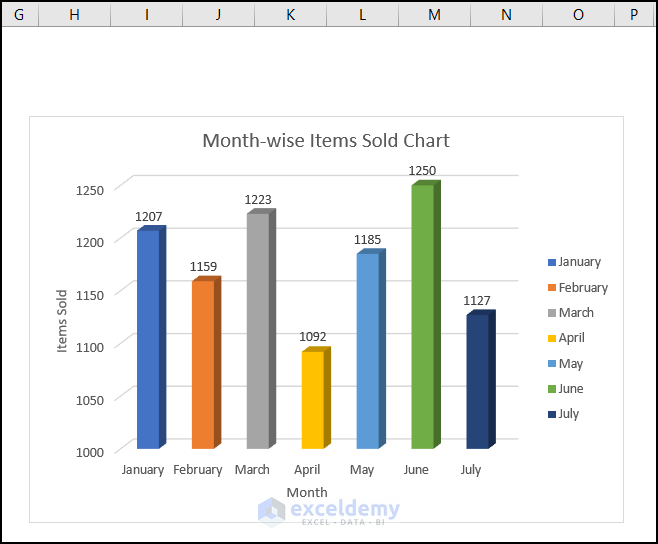
- After checking the box your bar of the chart will look just like the below.
3. Adjusting the Borders of the Chart Bars
The borders of the chart bars can also be changed according to your preference. The appearance of the chart bars will be more polished and well-shaped by adjusting the borders of the chart bars.
📌 Steps:
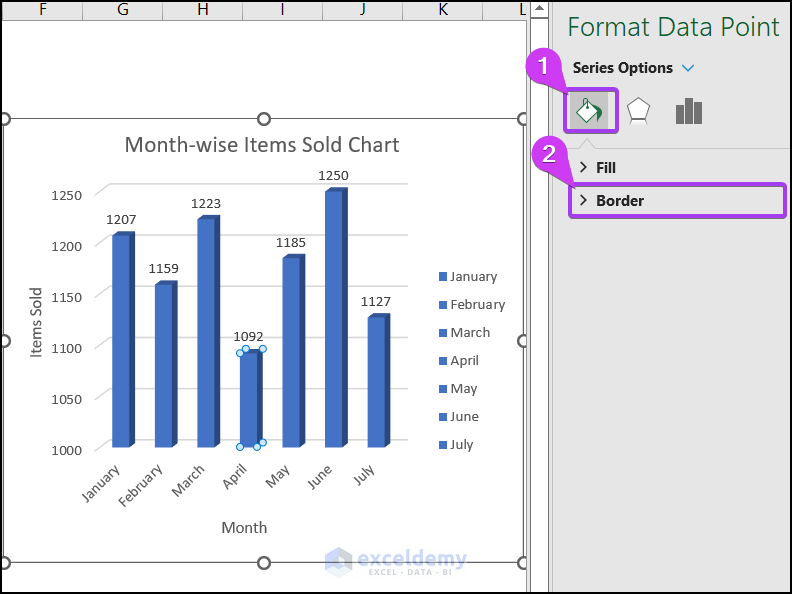
- First of all, select a bar and go to the Series Options under Format Data Point.
- Select the Border option.
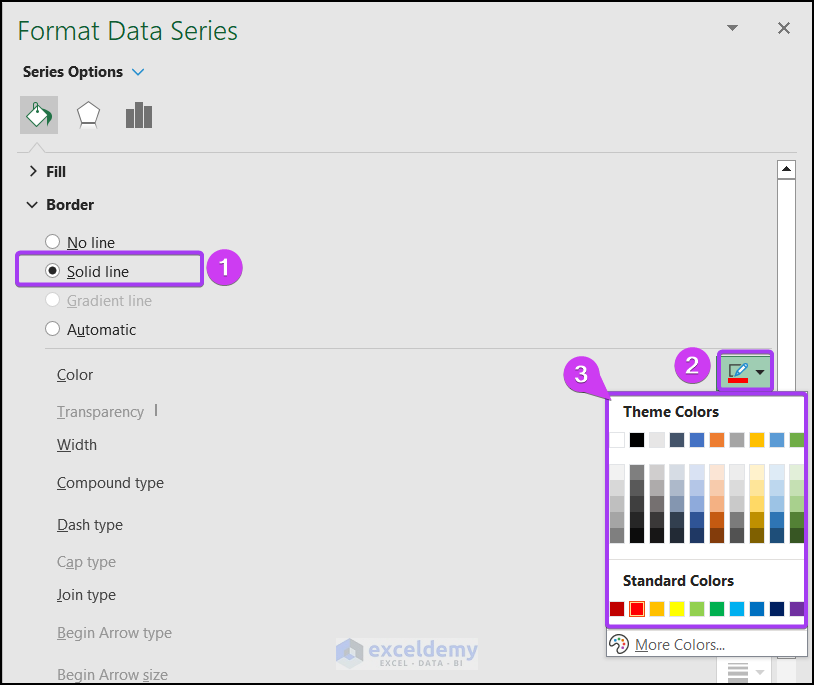
- Then, under the Border section, there are many options, and from there select Solid line.
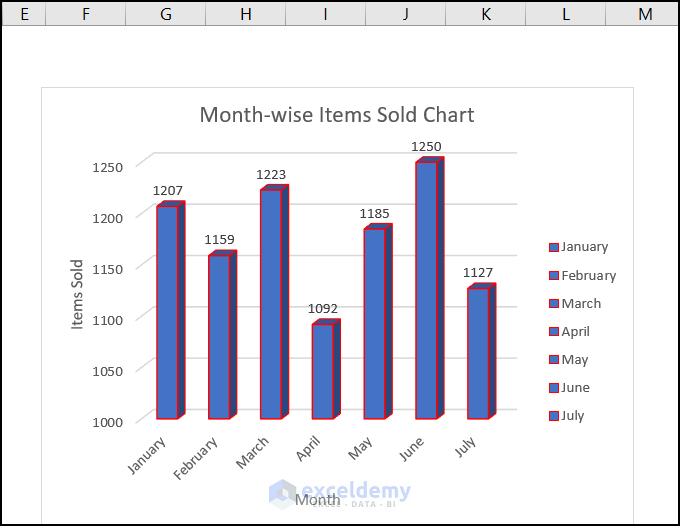
- Then select the Theme Colors option. Here we took the red color for our chart bar borders.
- Finally, your appearance will look like the image below.
4. Using Chart Styles
Now we know what you are thinking. Is there any way to color the chart without going to the Format Data Series? Luckily, we have covered one method from which you can color the chart from Chart Styles. Follow the simple steps to do so.
📌 Steps:
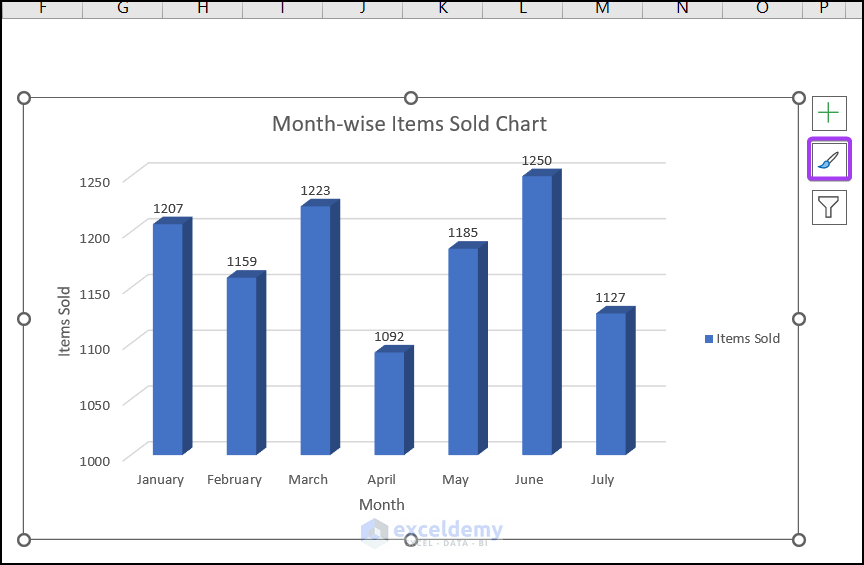
- Primarily, select the chart. Three options will pop up as you select the chart. They are Data Elements, Chart Styles, and Chart Filters.
- Then, select the Chart Styles from there.
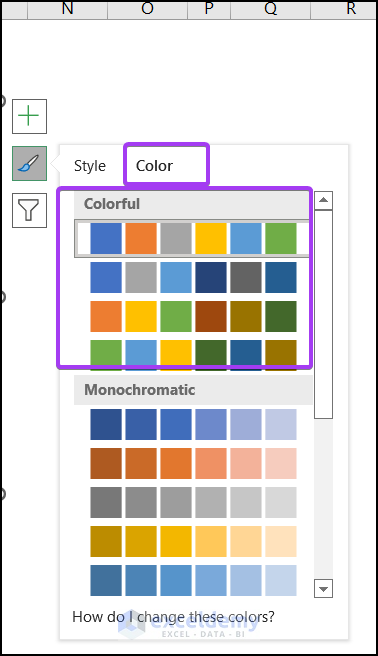
- After that, select the Color under the Chart Styles according to your choice.
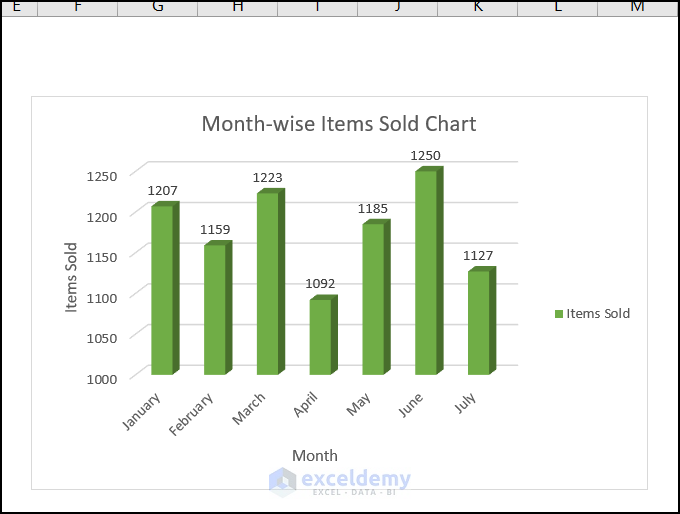
- Finally, we have changed the color of our chart bars. As you see, here we chose the green color for our chart bars.
Read More: How to Format Data Series in Excel
5. Using VBA Code to Change Series Color in Excel Chart
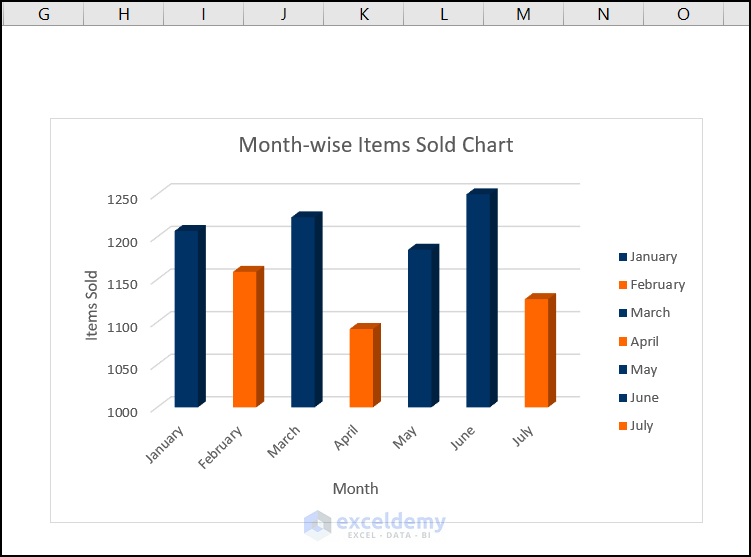
The VBA code also can change the color of the chart bars. But to do that you have to color your X-axis column value first. Here in our dataset, we colored the Month column according to our preference. After running the VBA code, the color of each bar in the chart will be changed based on the specified color.
📌 Steps:
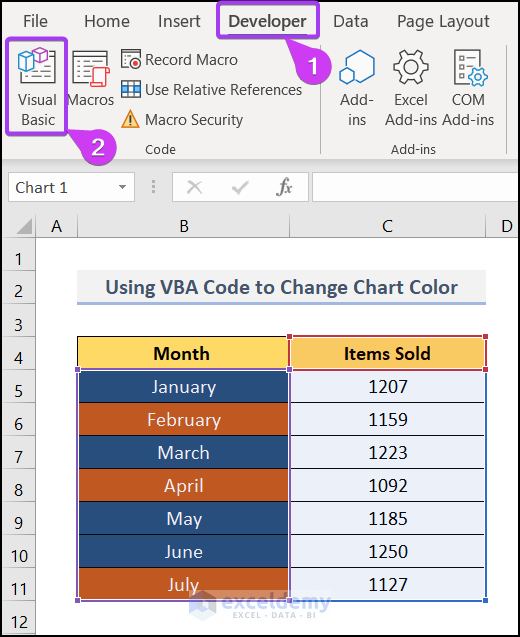
- Firstly, go to the Developer tab (You can enable the Developer tab from the File option) >> select the Visual Basic command.
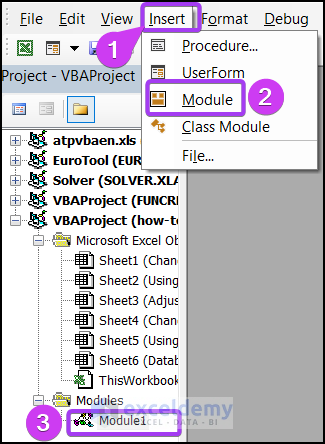
- Later, a new window will open. Then select Insert >> Module >> Module1.
- After that, write down the VBA code below and run the code with the F5 key.
Sub Series_Color_VBA()
Dim rn As Range
Dim s As String
Dim b As Integer
Dim a As Integer
For b = 1 To ActiveSheet.ChartObjects.Count
s = ActiveSheet.ChartObjects(b).Name
With Sheet5.ChartObjects(s).Chart.SeriesCollection(1)
Set rng = ActiveSheet.Range(Split(Split(.Formula, ",")(1), "!")(1))
For a = 1 To rng.Cells.Count
.Points(a).Format.Fill.ForeColor.RGB = ThisWorkbook.Colors(rng.Cells(a).Interior.ColorIndex)
Next a
End With
Next b
End Sub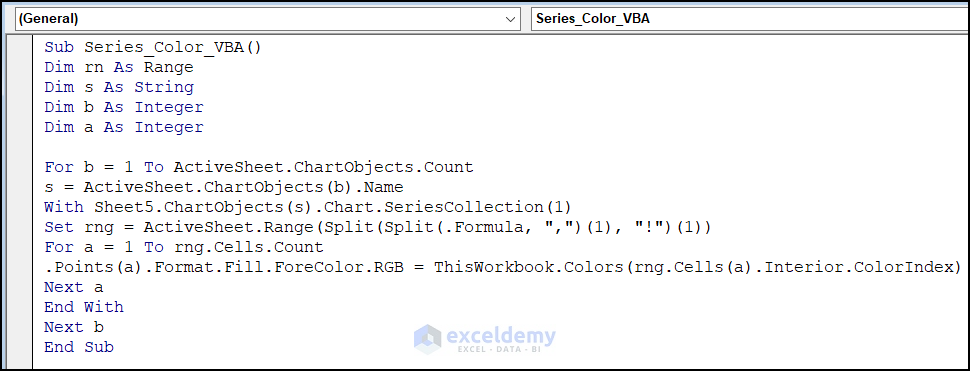
- Finally, your chart bar colors will be changed to what you specified the color before in the Month column.
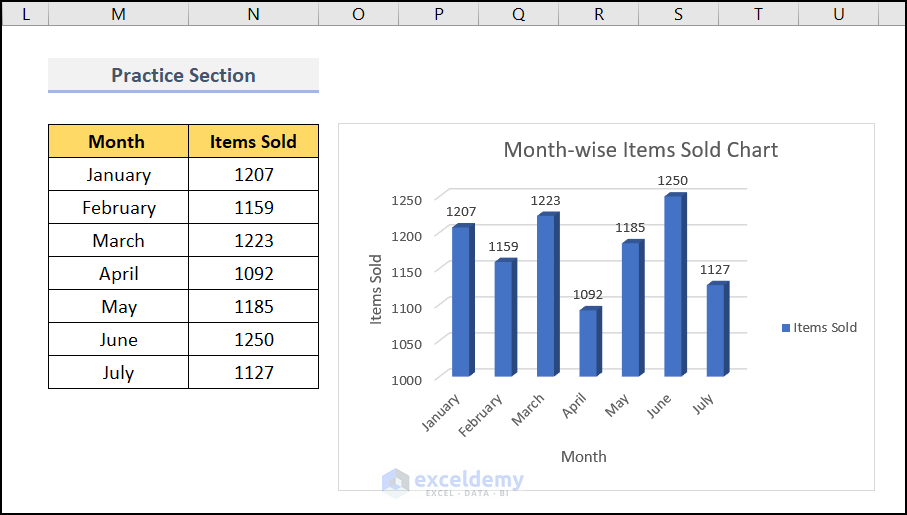
Practice Section
We have provided a practice section on each sheet on the right side for your practice. Please do it by yourself.
Download Practice Workbook
Download the following practice workbook. It will help you to realize the topic more clearly.
Conclusion
That’s all about today’s session. These are some easy methods to change series color in an Excel chart in excel Please let us know in the comments section if you have any questions or suggestions. For a better understanding please download the practice sheet.
Related Articles
<< Go Back To Data Series in Excel | Excel Charts | Learn Excel
Get FREE Advanced Excel Exercises with Solutions!
