Excel is the most widely used tool when it comes to dealing with huge datasets. We can perform myriads of tasks of multiple dimensions in Excel. In this article, I will explain how to apply Holt-Winters exponential smoothing in Excel. This method is useful for forecasting.
Introduction to Holt-Winters Exponential Smoothing
Holt-Winters method is an advanced method to forecast values. It considers seasonality, and trend effects while predicting the forecast. That is why the values represent the actual values except for some randomness.
The formula to calculate the forecast value using Holt-Winters Exponential Smoothing in Excel is
Ft+k = (Lt+k*Tt)*St-m+k
Where, F = Forecasted Value
L = Level
T = Trend
M = 4 for the quarterly period, 12 for the monthly period
S = Seasonality Index
Perform Holt Winters Exponential Smoothing in Excel: 11 Easy Steps
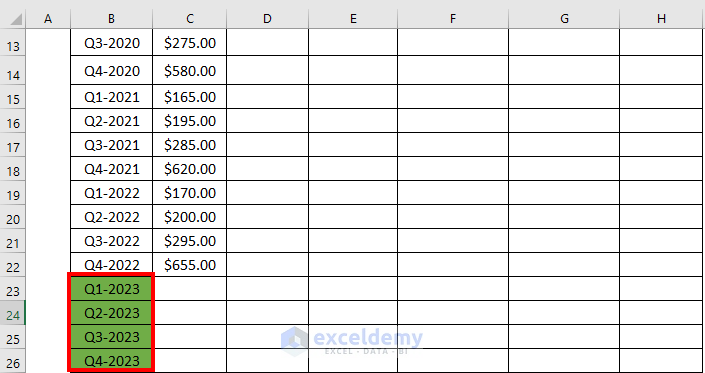
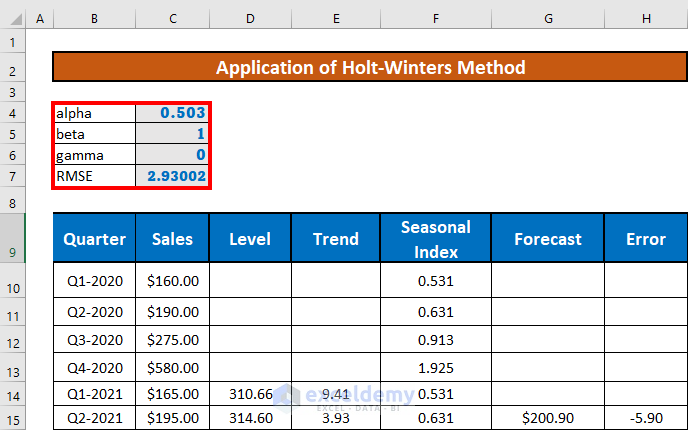
This is the dataset for today’s article. We have quarterly sales up to 2022.
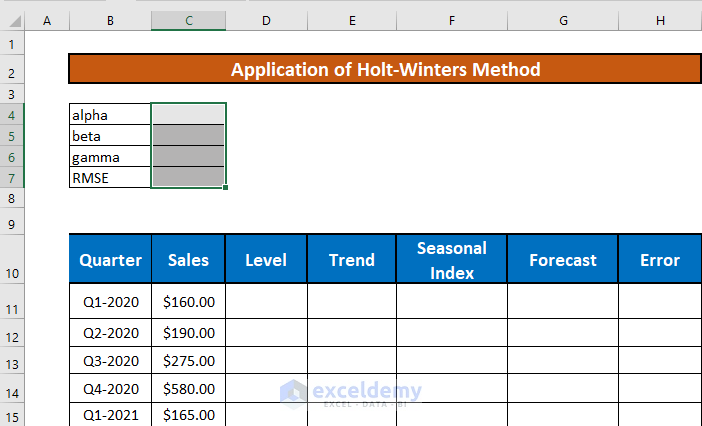
We will calculate the forecasted values for 2023.
Step 1: Assign Random Alpha, Beta & Gamma Value
The first task is to assign some random values for the constants alpha, beta, and gamma.

We will later optimize these values.
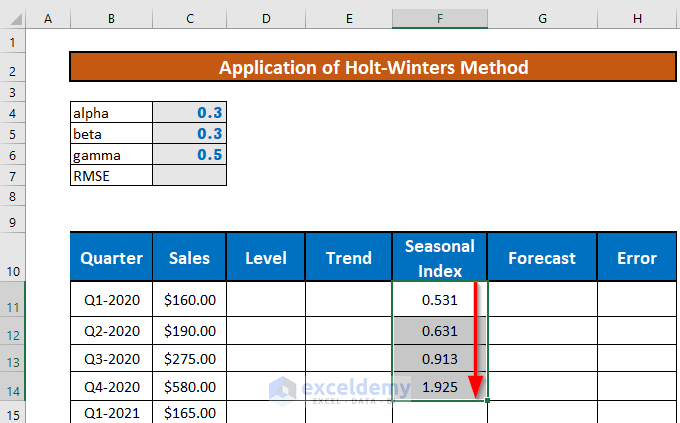
Step 2: Calculate Initial Seasonal Index
After that, we will determine the initial seasonal index for the first 4 quarters. We will determine the initial seasonal indexes by dividing the sales of each quarter by the average sales of the first 4 quarters. We will use the AVERAGE function to do so.
- Go to F11 and write down the following formula.
=C11/AVERAGE($C$11:$C$14)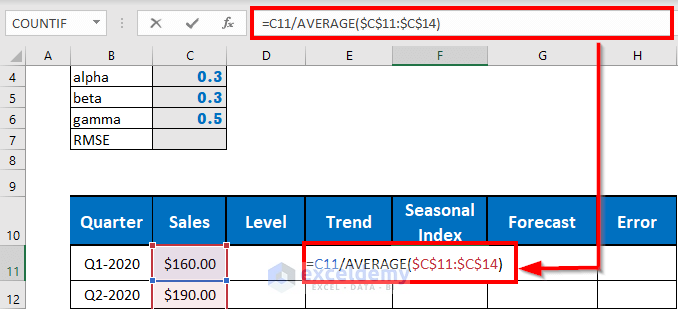
- Now, press ENTER. Excel will return the output.
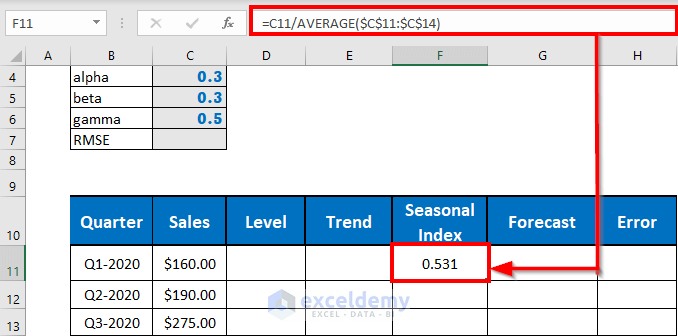
- After that, use the Fill Handle to AutoFill up to F14.
Step 3: Determine Initial Level and Trend
It’s time to calculate the initial level and trend for the dataset.
The initial level is the level for the 5th quarter since there are 4 quarters in a year.
The formula for the initial Level is,
L5 = Y5/S1
Where, Y5= Sales for the 5th Quarter.
S1= Seasonal Index for 1st Quarter.
To determine it,
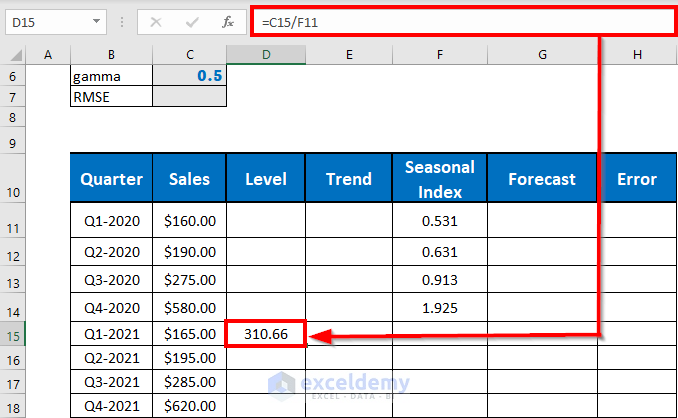
- Go to D15 and write down the formula
=C15/F11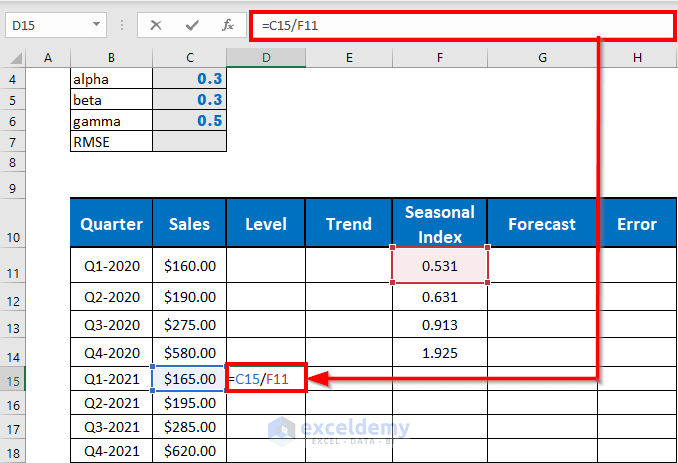
- Now, press ENTER. Excel will return the output.
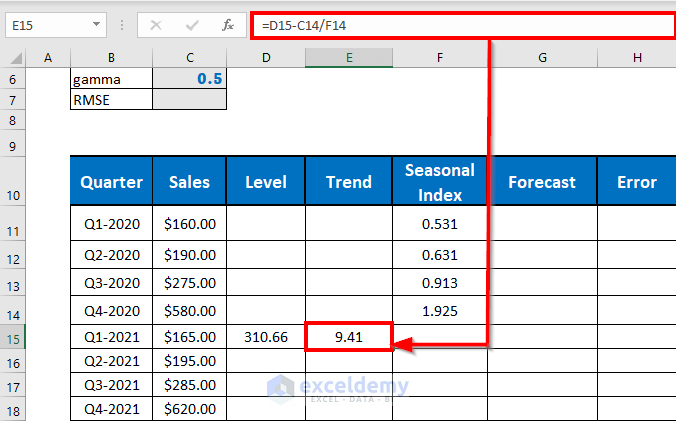
This time I will calculate the initial trend (which is also for the 5th quarter). The formula for the initial trend is,
T5 = L5-Y4/S4
Where, L5 = Level for 5th Quarter.
Y4 = Sales for the 4th Quarter.
S4 = Seasonal Index for 4th Quarter.
To calculate it,
- Go to E15 and write down the formula,
=D15-C14/F14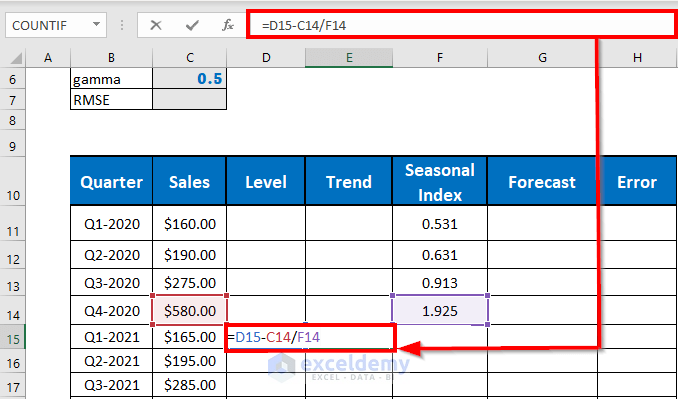
- Press ENTER to get the output.
Step 4: Calculate Next Seasonal Indexes
Now, we will calculate the next seasonal indexes using our general formula. The general formula to calculate the seasonal index is,
St = ɣ(Yt/Lt)+(1-ɣ)St-m
Where
L = Level.
T = Trend.
M = 4 for the quarterly period, and 12 for the monthly period.
S = Seasonality Index.
Ɣ = Coefficient.
To calculate the seasonal index,
- Go to F15 and write down the following formula
=$C$6*(C15/D15)+(1-$C$6)*F11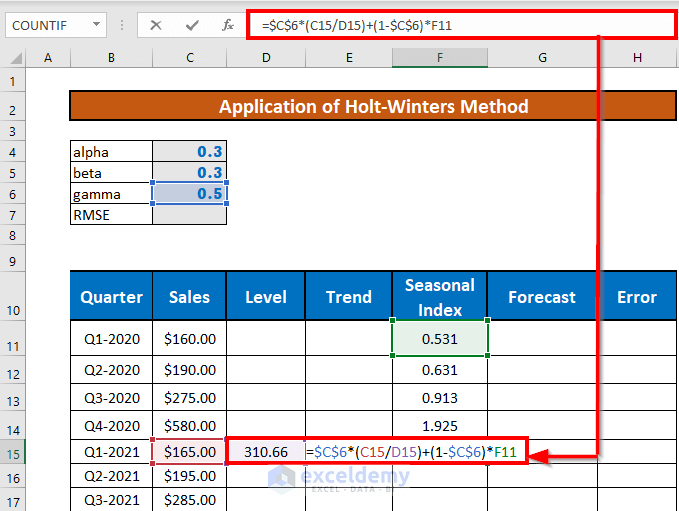
- Press ENTER.
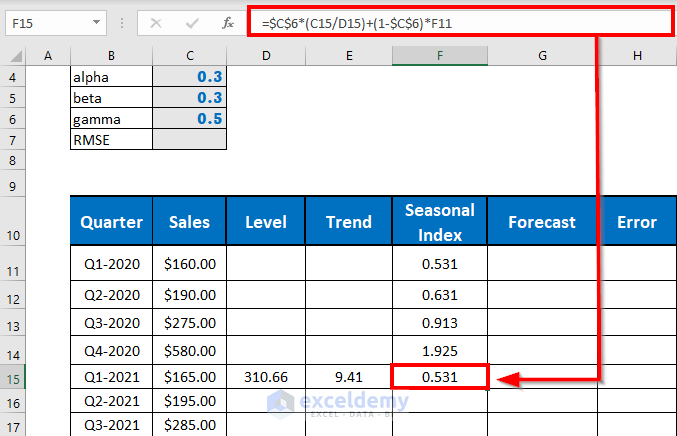
- AutoFill up to F22.
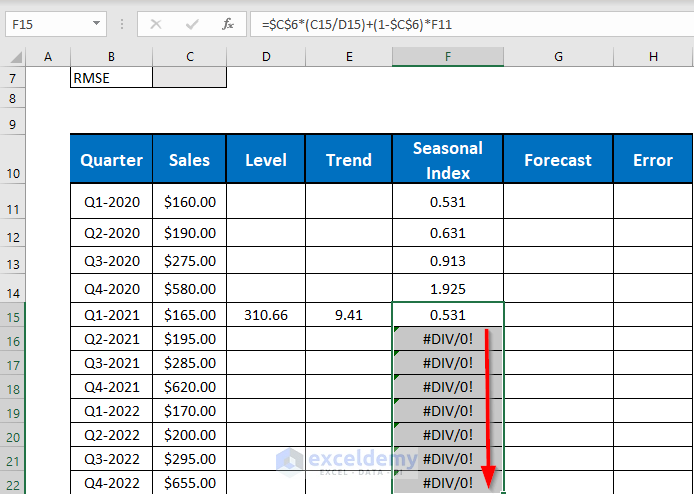
Note: Ignore the error for a while, it will be fine once you measure the next Levels and next Trends.
Step 5: Determine Next Levels
Now I will show how to determine the next levels using the formula,
Lt = α(Yt/St-m)+(1-α)(Lt-1+Tt-1)
Where
L = Level
T = Trend
M = 4 for quarterly period, 12 for a monthly period
S = Seasonality Index
α = Coefficient
- Go to D16 and write down the following formula
=$C$4*(C16/F12)+(1-$C$4)*(D15+E15)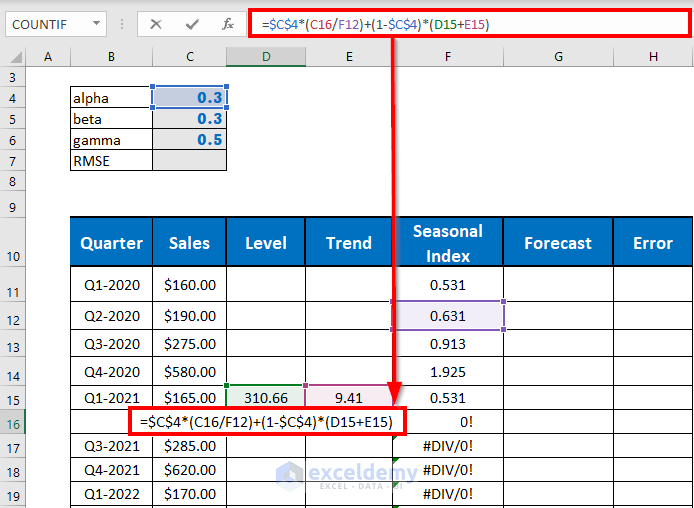
- Press ENTER.
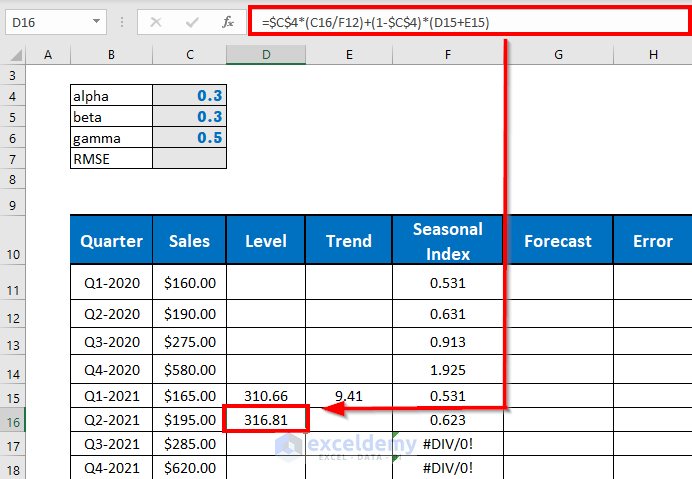
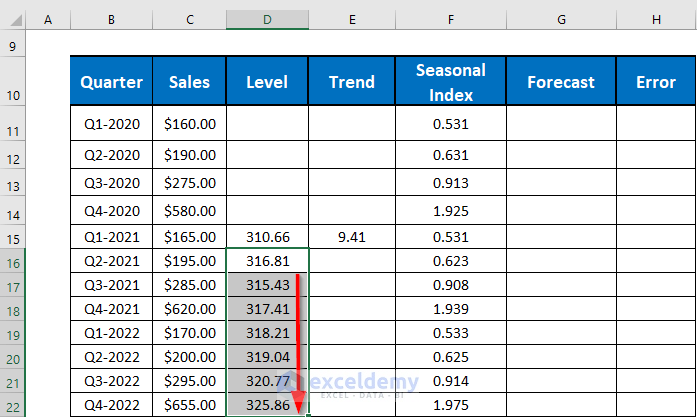
- AutoFill up to D22.
Step 6: Measure Next Trends
Let’s get the idea of the trend effect now. The formula is
Tt= β(Lt-Lt-1)+(1-β)Tt-1
Where
L = Level
T = Trend
M = 4 for quarterly period, 12 for a monthly period
S = Seasonality Index
β= Coefficient
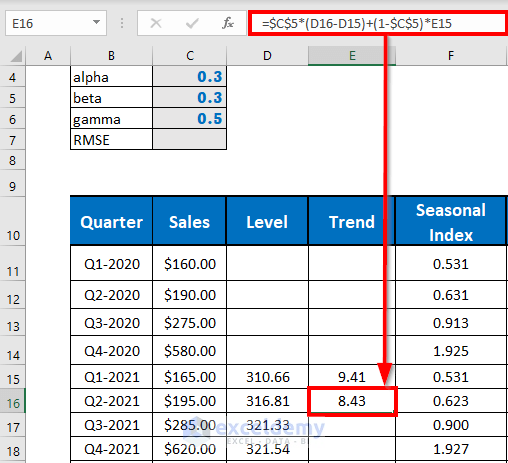
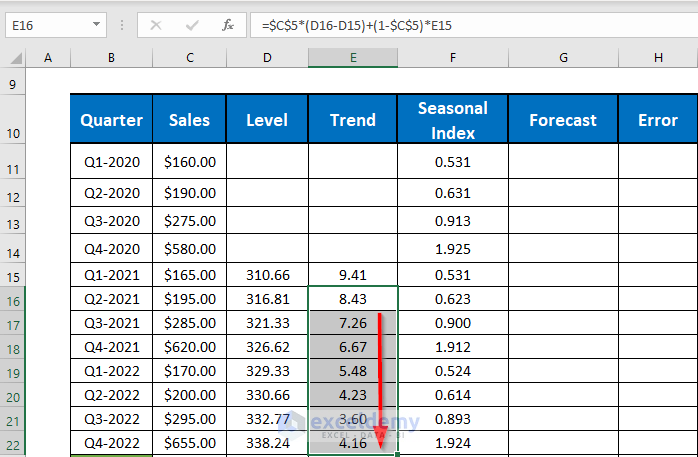
To calculate the trend effect,
- Go to E6 and write down the following formula
=$C$5*(D16-D15)+(1-$C$5)*E15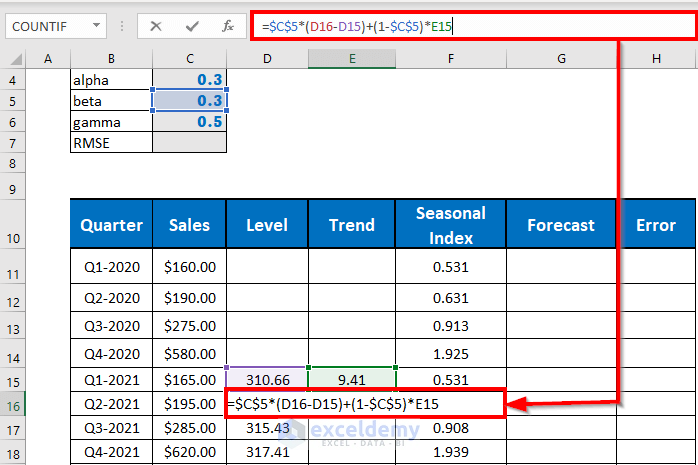
- Press ENTER to continue.
- AutoFill up to E22.
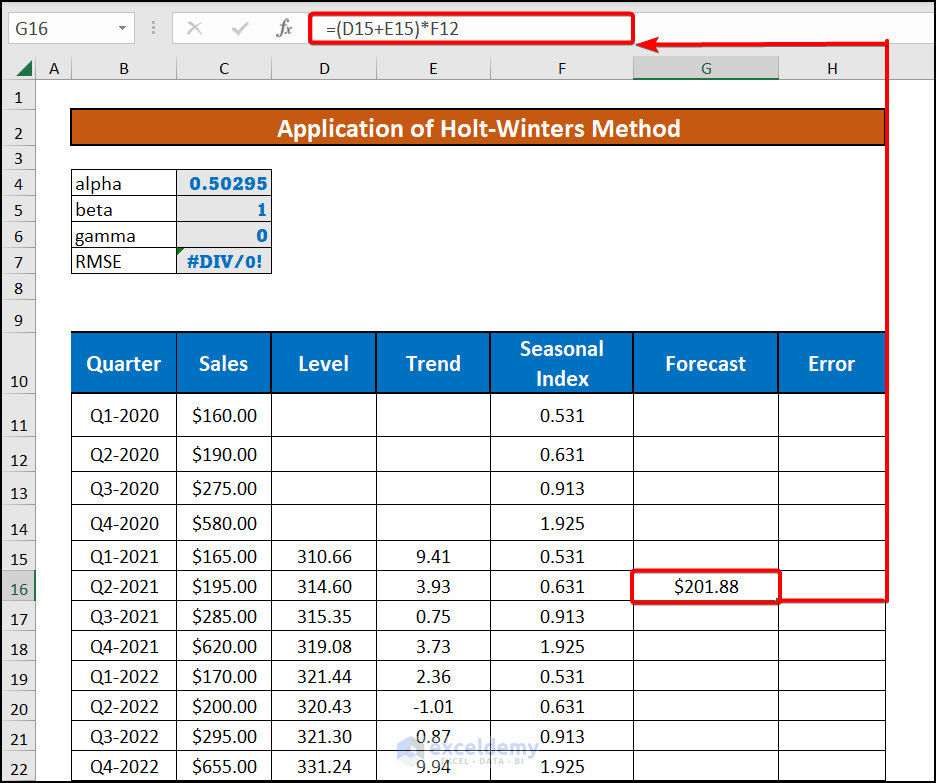
Step 7: Find Forecasted Values to Compare with Actual Sales
Now, we will calculate the forecasted values for comparison with actual sales. The first one will be for quarter 6. The formula to calculate the forecasted values (for comparison) is,
Ft = (Lt-1 + Tt-1)* St-M
So let’s do it.
- Go to G16 and write down the following formula
=(D16+E16)*F12
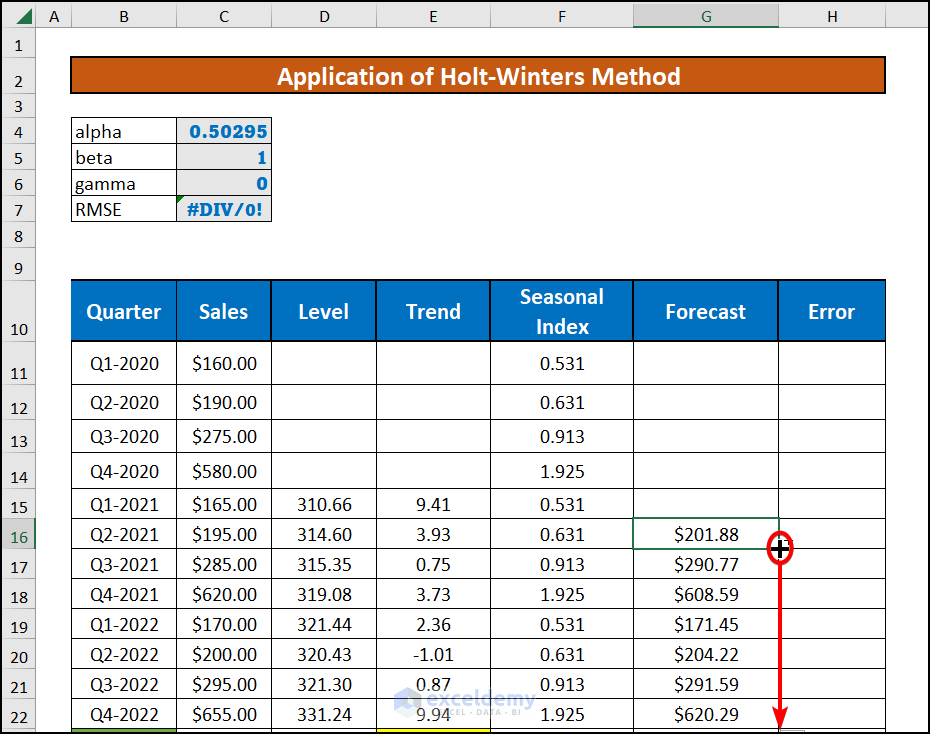
- Press ENTER to go.
- AutoFill up to G22.
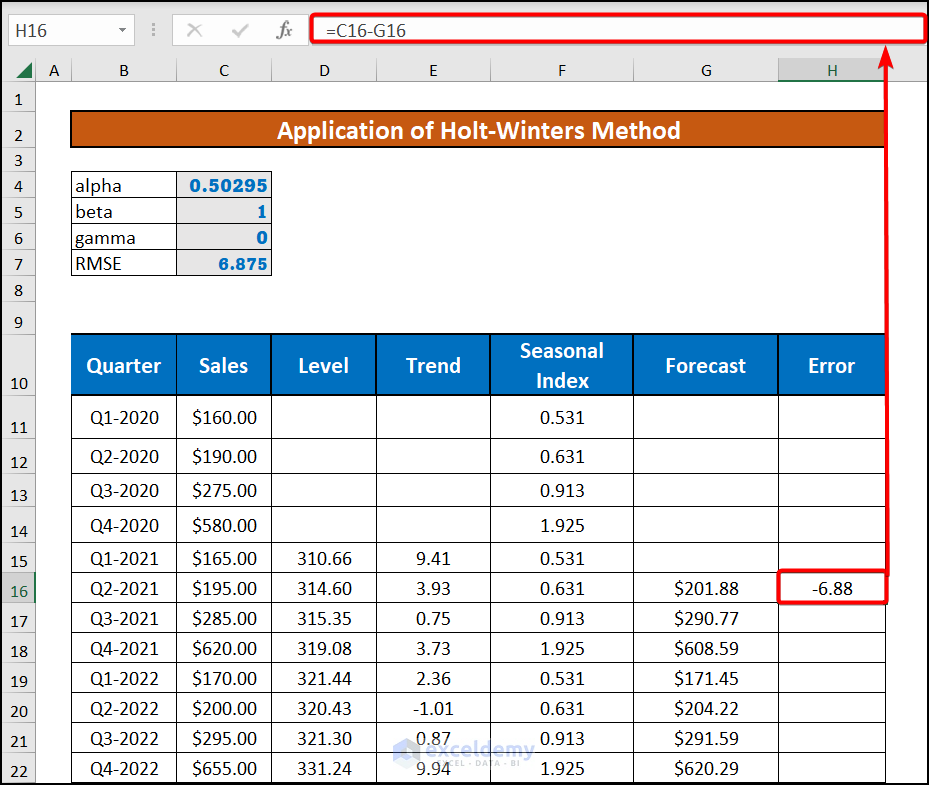
Step 8: Calculate Forecasting Errors
Now, we will calculate the forecasting error by subtracting the forecasted value from the actual sales.
- Go to H16 and write down the formula
=C16-G16
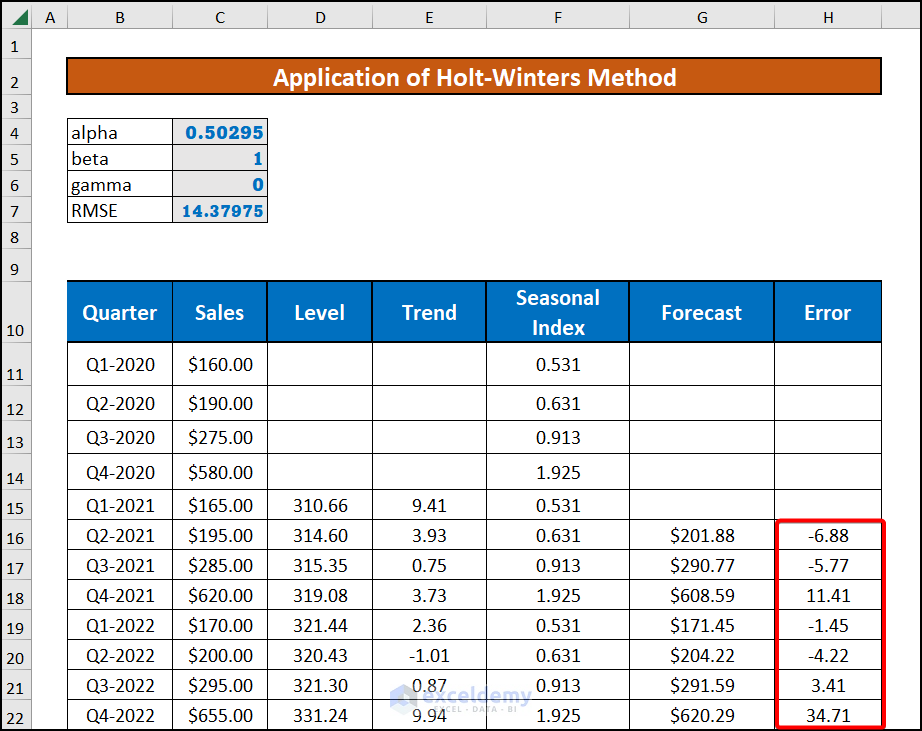
- Then press ENTER.
- AutoFill up to H22 and get the final output like the image below.
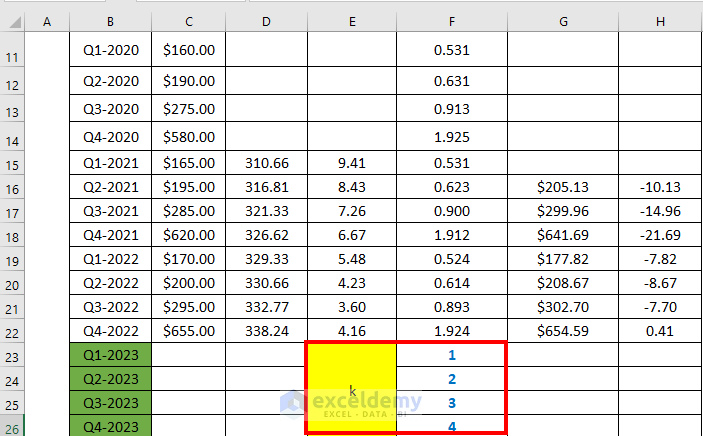
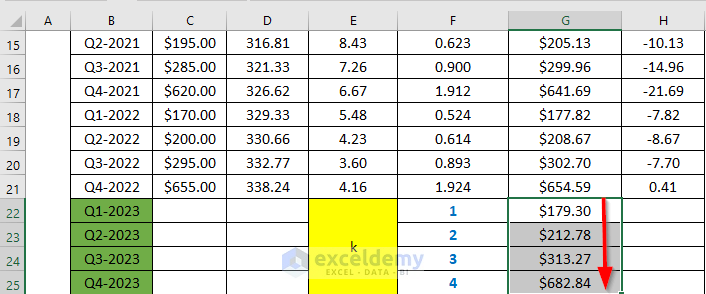
Step 9: Assign K Value for Quarters to Be Forecasted
It’s time to calculate the forecast. But before that, we must understand the co-efficient k. It represents the future time for forecasting. In our case, we will calculate the forecast for the 4 quarters of 2023. And we have data available for 2022.
So, for the first quarter of 2023, the value of k will be 1, for the 2nd quarter, it will be 2, and so on.
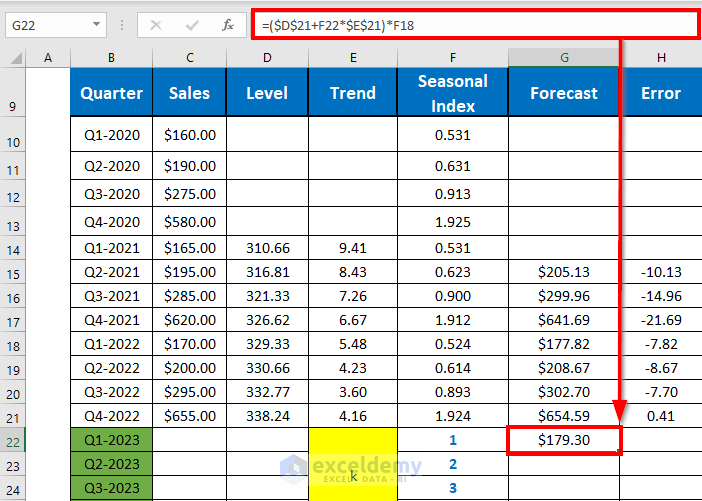
Step 10: Calculate Forecasted Value
Now, we are ready to calculate our forecasted values. We will use the last available Level, Trend, and Seasonality to calculate them.
- Go to G23 and write down the following formula
=($D$22+F23*$E$22)*F19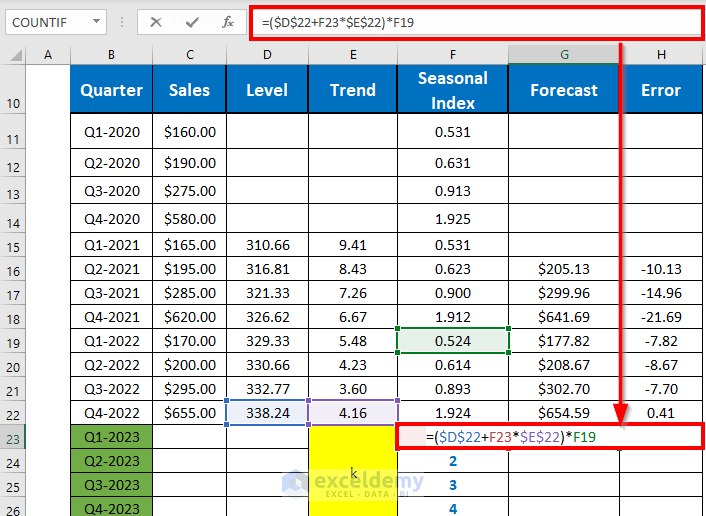
- Then press ENTER to get the output.
- Now, AutoFill up to G25.
Step 11: Optimize Alpha, Beta, and Gamma
Now, to minimize the error, we will optimize the values of alpha, beta, and gamma. We will take the help of an Excel solver to do so.
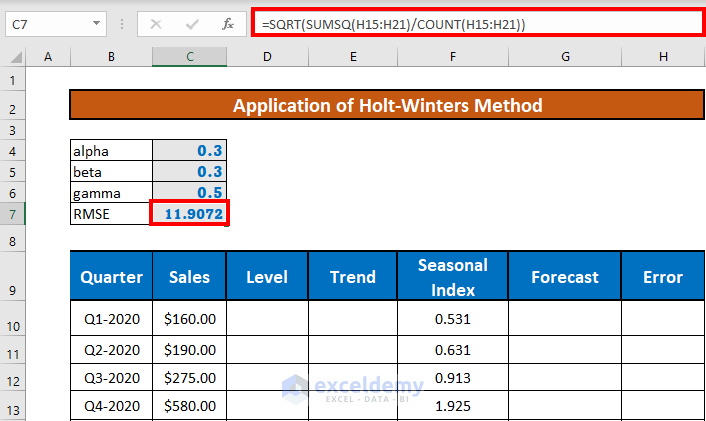
- First, we need to calculate the root mean square error. To do so, go to C7 and write down the following formula
=SQRT(SUMSQ(H15:H21)/COUNT(H15:H21))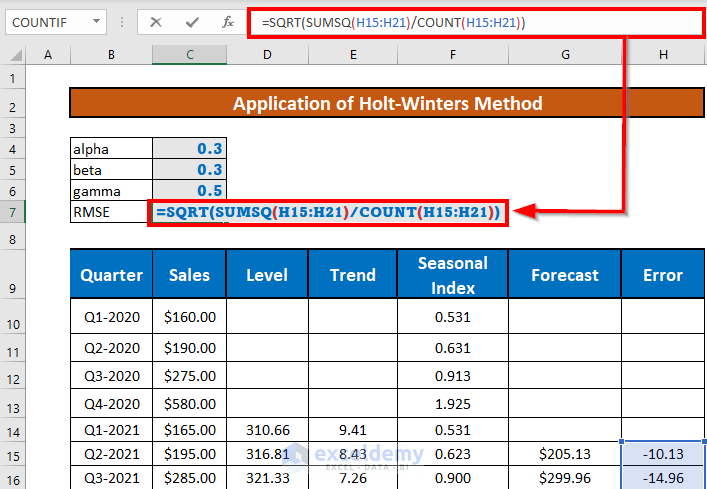
Formula Breakdown:
- COUNT(H15:H21) → Count the number of cells.
- Output → 7
- SUMSQ(H15:H21) → Calculate the sum of the squares of H5:H11.
- Output → 463493653301
- =SQRT(SUMSQ(H15:H21)/COUNT(H15:H21)) → Calculates the RMSE
- =SQRT(992.463493653301/7)
- =SQRT(141.780499093329)
- Output → 9072
- Then, press ENTER.
- Now, go to the Data tab >> select Solver.
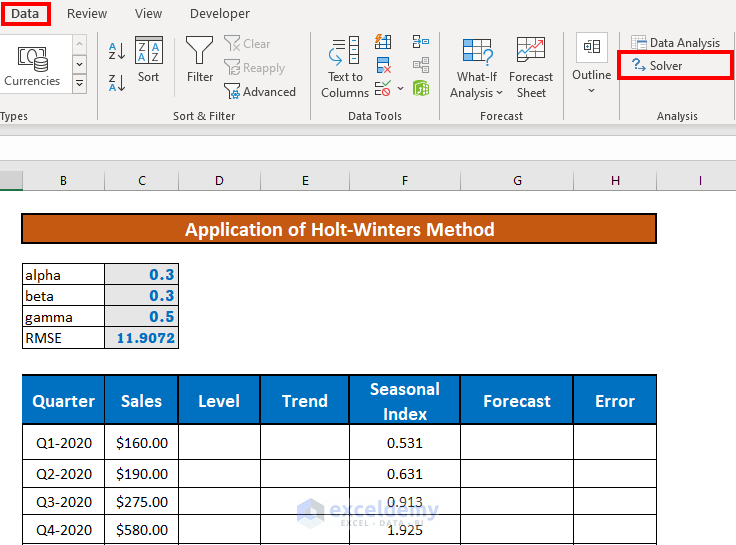
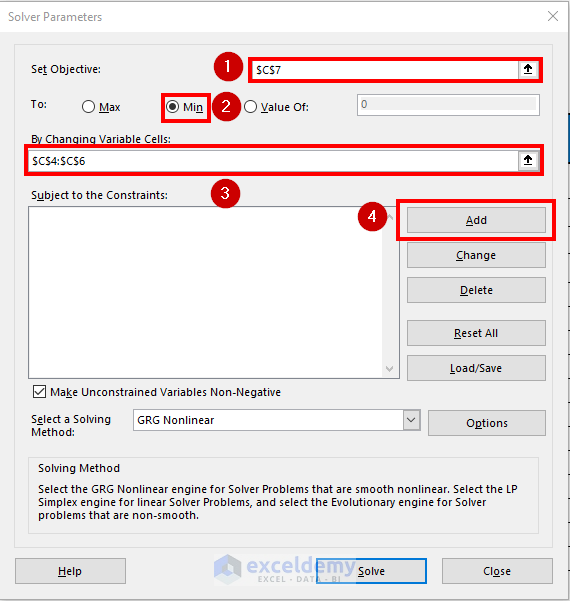
- Solver Parameters window will pop up. Since we want to minimize the error, our objective is to set RMSE to be minimum by changing the values of the coefficients.
- After that, to add constraints, click Add.
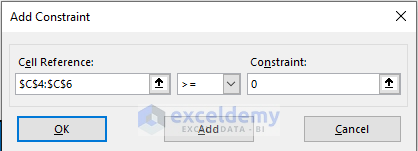
- Add Constraint window will appear. The constraints are 0<=α,४,ß<=1. So to add the first constraint, set the cell reference and value. (see image)
- Similarly, after adding the second constraint, your output will be like this. Then click Solve.
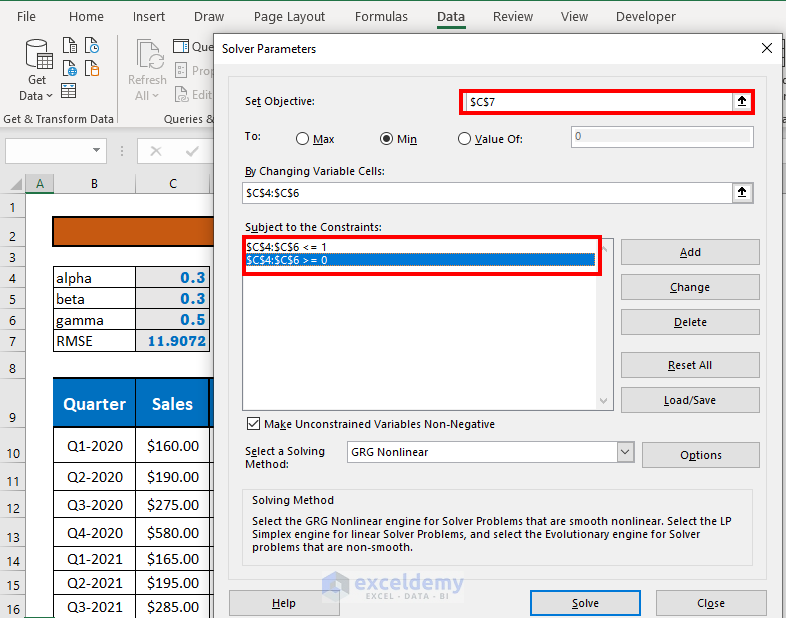
- Excel will minimize the error by optimizing alpha, beta, and gamma.
Things to Remember
- You have to activate the solver add-in.
- We are not concerned about the k value for calculating forecasts that we are going to compare with the available actual sales.
Download Workbook
Download this workbook and practice while going through this article.
Conclusion
In this article, I have explained how to apply Holt-Winters exponential smoothing in Excel. I hope it helps everyone. Please comment if you have any queries.
Related Articles
- How to Calculate Trend Adjusted Exponential Smoothing in Excel
- How to Remove Noise from Data in Excel
- How to Smooth Data in Excel
<< Go Back to Exponential Smoothing in Excel | Solver in Excel | Learn Excel
Get FREE Advanced Excel Exercises with Solutions!

Thanks for Holt’s Winter excel spreadsheet. It helped a Lot. Are there more examples. I enjoyed the one you sent.
Thank you for your kind words.
Have a good day!!
Hola! Estoy intentando usar el pronóstico para kilogramos de un artículo en doce meses, pero no logro que la cantidad de kilogramos del año 2023 tenga sentido. El año 2022 son 3000 kg y el año 2023 1200, algo tengo mal… Por favor, ¿podría pasarme un ejemplo del excel para 12 meses? Gracias!
English: Hello! I’m trying to use the forecast for kilograms of an item in twelve months, but I can’t get the number of kilograms for the year 2023 to make sense. The year 2022 is 3000 kg and the year 2023 is 1200, I have something wrong… Please, could you give me an example of excel for 12 months? Thank you!
Hi JORGE,
It’s a bit difficult to answer this, not seeing your spreadsheet. Can you please send a sample to [email protected]?
Prior to that, check the following Excel file. We have added a 12-month example for you. Let us know if this helps.
Download Link:
Solution.xlsx
Note:
You must have data of 2021 and 2022 for forecasting 2023.
Hi Akib,
I think G16 should be: =(D15+E15)*F12 instead of =(D16+E16)*F12, right?
Thank you.
Hi Quang,
Thanks for your feedback. You are right on this occasion. The formula will be
=(D15+E15)*F12in G16. unfortunately, we have made a mistake here. Thanks to you that you corrected us. We have updated the article.Best wishes to you.
Regards
Fahim Shahriyar Dipto
Excel & Content Developer.