Method 1 – Insert Shapes to Create a Flowchart in Excel
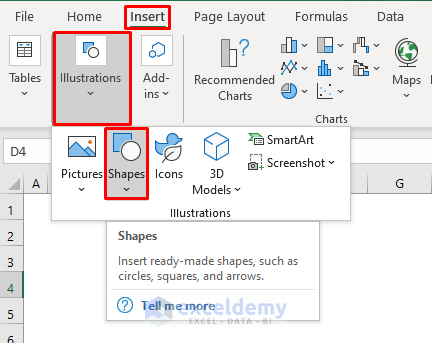
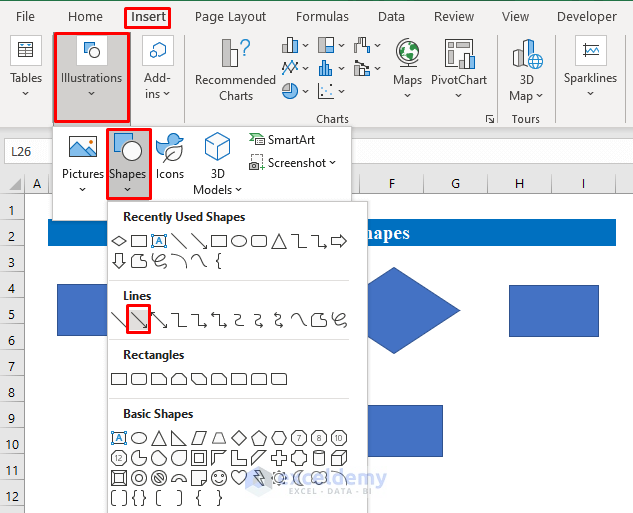
- Go to the “Insert” ribbon and choose “Shapes” from the “Illustrations” section.
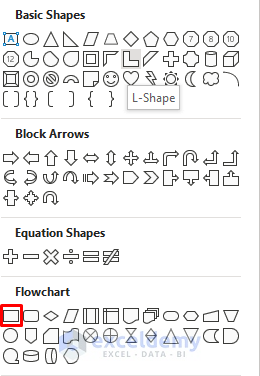
- From the “Shapes” drop-down list, you will find various shapes. We chose a simple rectangle from the ‘flow chart” shape section.
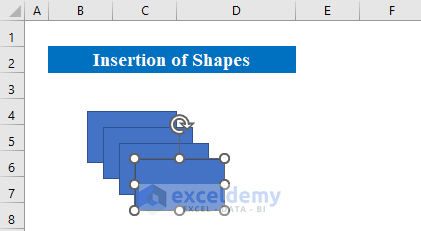
- Draw the shape on your worksheet.
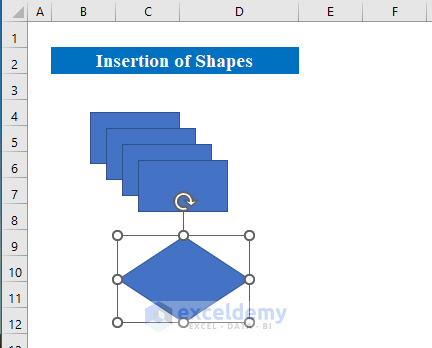
- Press Ctrl+D several times to get some more similar shapes.
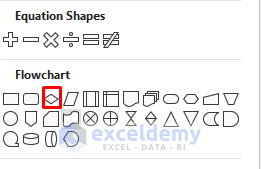
- Repeat the process for more shapes. We selected the “Decision” shape from the list.
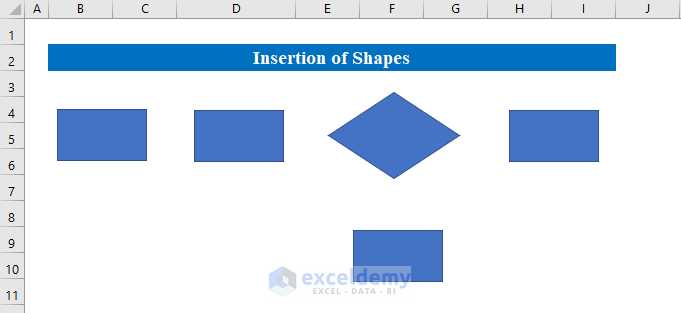
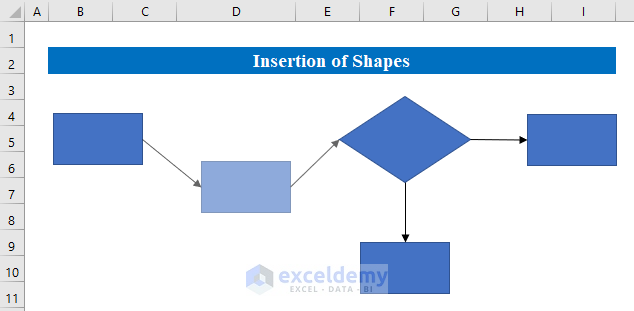
- We have created all our shapes needed to make the flowchart.
- Rearrange the shapes according to your flowchart.
- Go to Insert, select Illustrations, and choose Shapes.
- Choose a line from the “Lines” section. Use the single arrow line (second option).
- Set lines from one box to another.
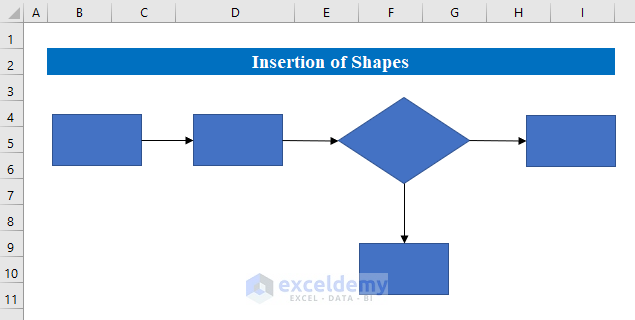
- You can move the shapes and the lines will move accordingly. If you want to avoid diagonals, use the lines with corners (fifth option).
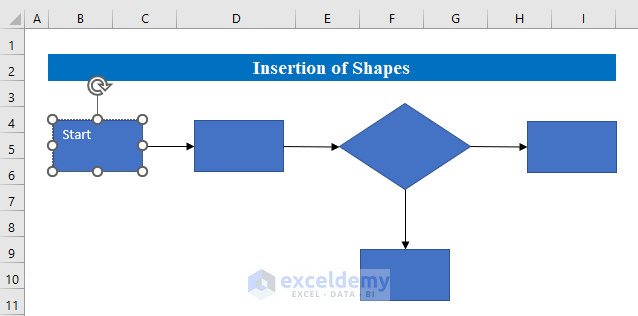
- Double click inside the shape to type text.
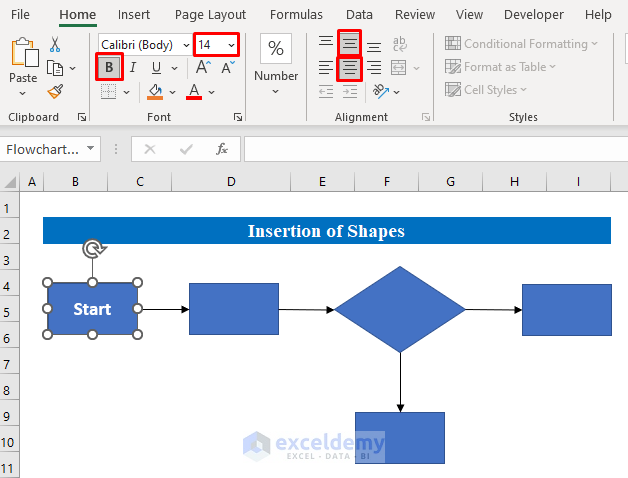
- You can change the format of the data from the Home Tab.
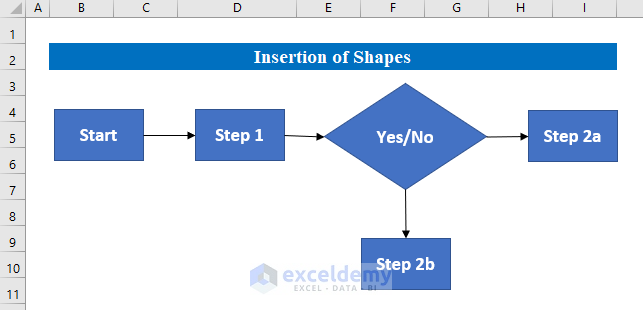
- Thus you can create a flow chart of your choice when you want to create with your own custom design.
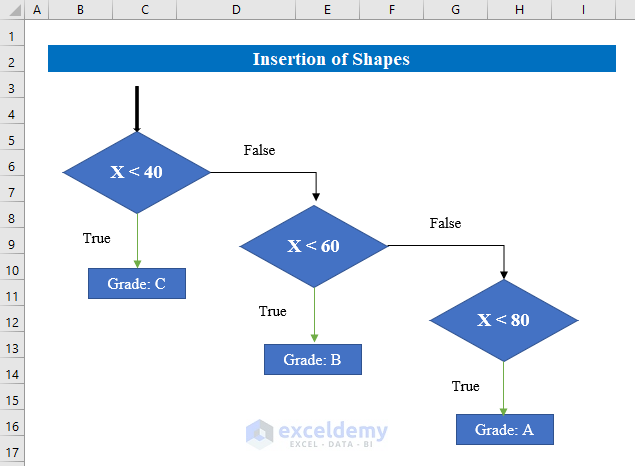
You can check the following example for a better understanding of a flow chart.
Suppose we have some conditions in a dataset.
Conditions:
X < 40: Test 1
“C”: return C if test 1 satisfies.
X < 60 : Test 2
“B”: return B if test satisfies.
X < 80 : Test 3
“A”: return A if test satisfies
Now we are going to explain the conditions with the help of a flow chart in excel.
Read More: How to Make a Yes No Flowchart in Excel
Method 2 – Use SmartArt Graphic to Create a Flowchart in Excel
- Create a workbook and open it.
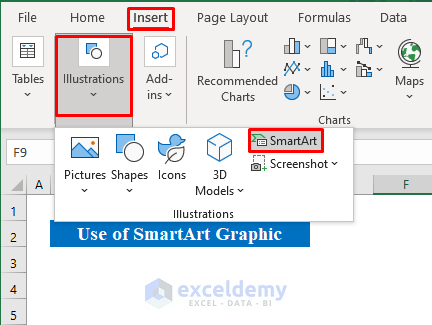
- Go to the Insert tab.
- Select “SmartArt” from the “Illustrations” section.
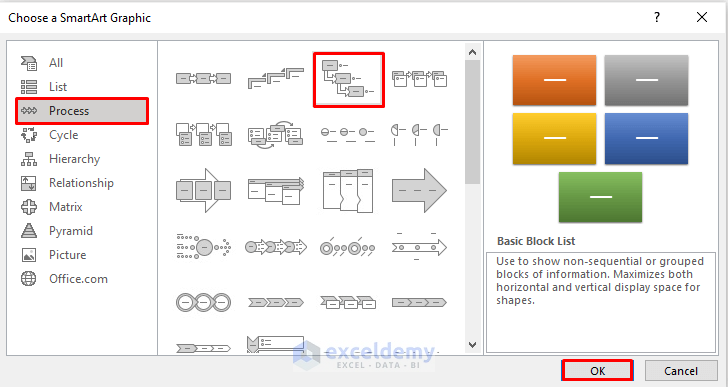
- A new window will appear named “Choose a SmartArt Graphic”.
- Select “Process” and choose a flowchart of your choice.
- Press OK to continue.
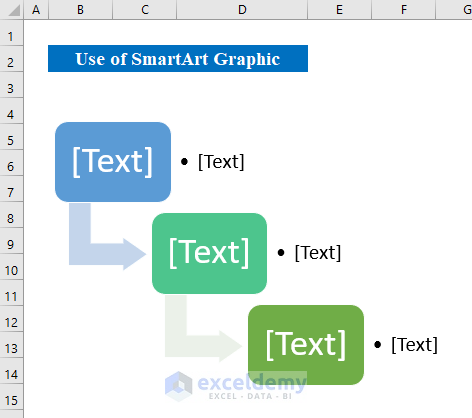
- Check out the following screenshot for an example.
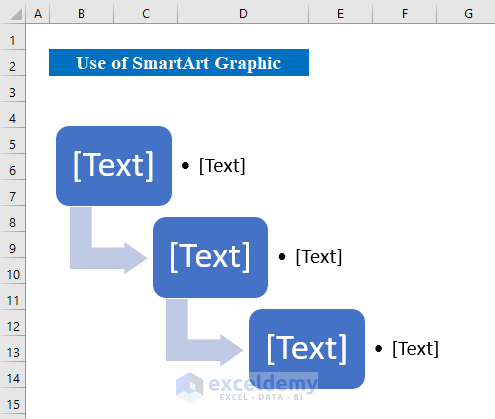
- You can change the color if you want to from the “SmartArt Design” tab.
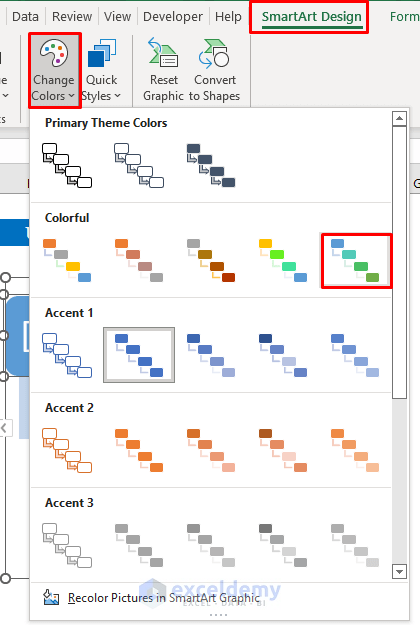
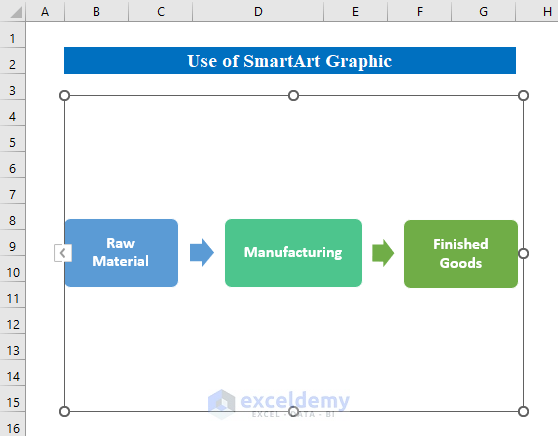
- Here we have changed the color of each cell.
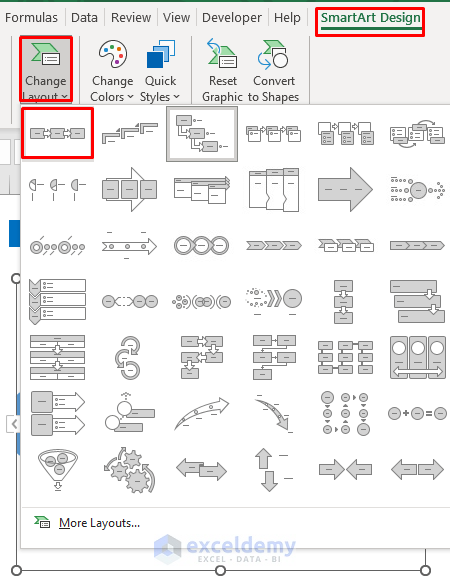
- You can also change the format with the “Change Layout” option in the same tab.
- Fill in the cells with text to complete the flowchart.
Read More: How to Create a Swimlane Flowchart in Excel
Download Practice Workbook
Download this practice workbook to exercise while reading this article.
Related Articles
<< Go Back to Flowchart in Excel | Learn Excel
Get FREE Advanced Excel Exercises with Solutions!
