
Image by Editor | Midjourney
Google Sheets is a dynamic powerful tool that can integrate with Google Workspace and services easily. You can create Google Forms that will be linked to Google Sheets then you can visualize the data using the Data Studio (Locker Studio). In this article, we will show how to use Google Forms for data entry and Google Data Studio for analyzing and visualizing the collected data.
Let’s consider a customer feedback system for your products that collects ratings and comments, and then we will visualize the data in an interactive dashboard.
Step 1: Set Up Google Forms for Data Entry
1. Creating the Google Form
You can create a Google form from the Google Sheets also.
- Open Google Sheets >> Go to the Tools tab >> select Create a new form.
- Or you can go directly to Google Forms and click “+” to create a new form.

- Add relevant questions for your data collection, such as:
- Customer Name (Short answer)
- Email (Optional) (Short answer)
- Product List (Checkboxes)
- Ratings (Linear scale 1-5)
- How would you rate your overall experience?
- How would you rate the quality of the product?
- How would you rate our service?
- What Can Be Improved? (Paragraph)
- Would You Recommend Us? (Yes/No)

2. Link Google Forms to Google Sheets
- Click on the Responses tab in Google Forms.
- Click on View in Sheets to link responses to a Google Sheet.
- Google Forms will automatically create a new sheet and log responses dynamically.

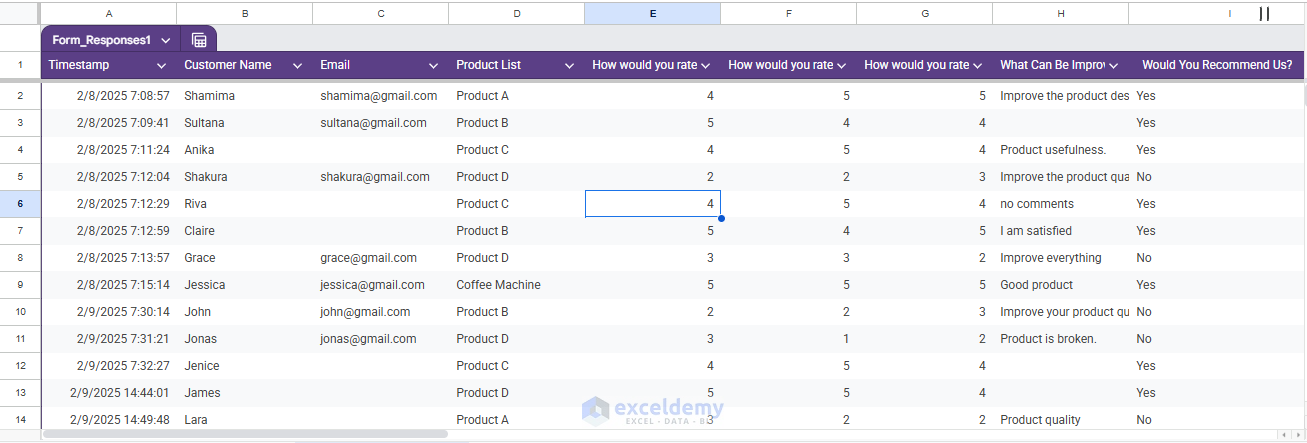
Step 2: Organize Data in Google Sheets
- Open the linked Google Sheets file created in the previous step.
- If you want you can rename the sheet for clarity.
- Ensure column names are clear: Timestamp, Customer Name, Email, Product List, How would you rate your overall experience? How would you rate our service? How would you rate the quality of your product? What Can Be Improved? Would You Recommend Us?
Step 3: Set Up Google Data Studio for Visualization
1. Open Google Data Studio (Locker Studio)
- Go to the Extension tab >> select Locker Studio >> select Create a report.

- A prompt will appear on the left side;
- Select feedback responses spreadsheet as the data source which is Form Responses 1.
- Click on Create.

OR
- Open Google Data Studio.
- Click on the + icon to Create Report >> select Google Sheets as the data source.
- Choose your Google Form data as the dataset.
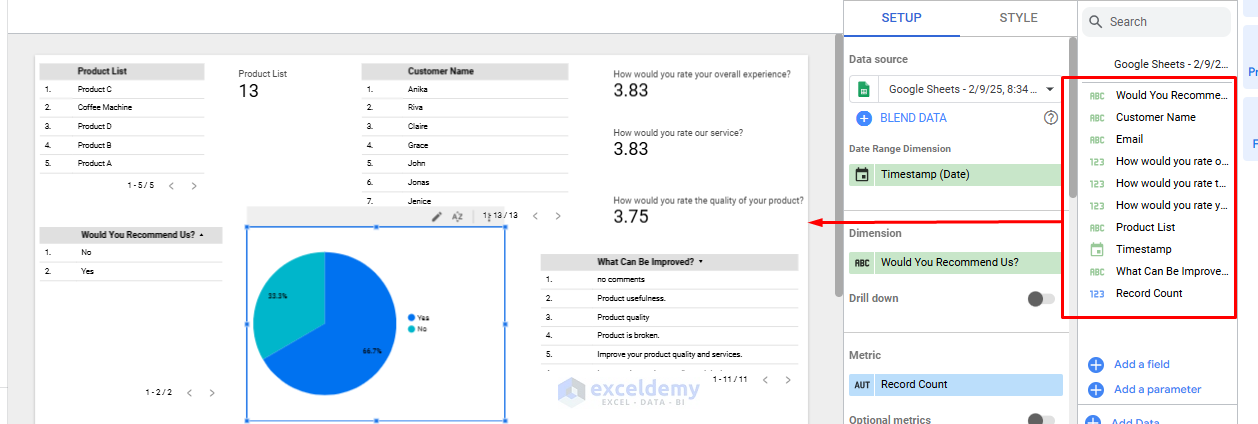
2. Design the Dashboard
Once Google Forms data is imported into the locker studio you will get a dashboard with Data and properties list.
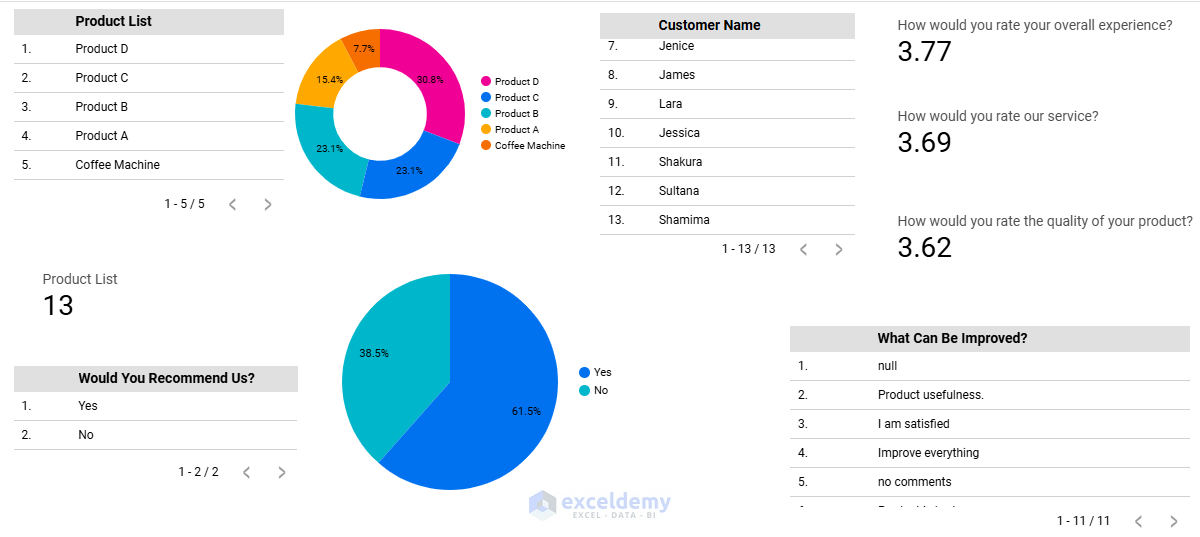
Let’s create a comprehensive dashboard with these elements.

Add Product List:
- Create a table showing all the products.
- Drag the Product List column from the Data section to the Page.
- It will show all the product names in a selectable list.
Product Analysis Section:
- Create a donut chart showing popular orders.
- From the Add Chart >> select Donut chart.
- In the Primary field >> select Product List >> set Aggregation as Count.
Overall Metrics Section:
- Add a scorecard for the total responses for the product:
- From the Add Chart >> select Scorecard chart.
- In the Primary field >> select Product List >> set Aggregation as Count.
- Add average rating scorecards for:
- From the Add Chart >> select Scorecard chart.
- In the Primary field >> select Rating >> set Aggregation as Average.
Recommendation Analysis:
- Create a table showing the recommendation list.
- Drag the Would You Recommend Us? from the Data section to the Page.
- It will bring the selectable recommendation list.
- Create a pie chart showing popular orders.
- From the Add Chart >> select Pie chart.
- In the Primary field >> select Would You Recommend Us? >> set Aggregation as Count.
Feedback Analysis Section:
- Create a table showing recent written feedback.
- Drag the What Can Be Improved? from the Data section to the Page.
- You can add a word cloud visualization for common terms in feedback.
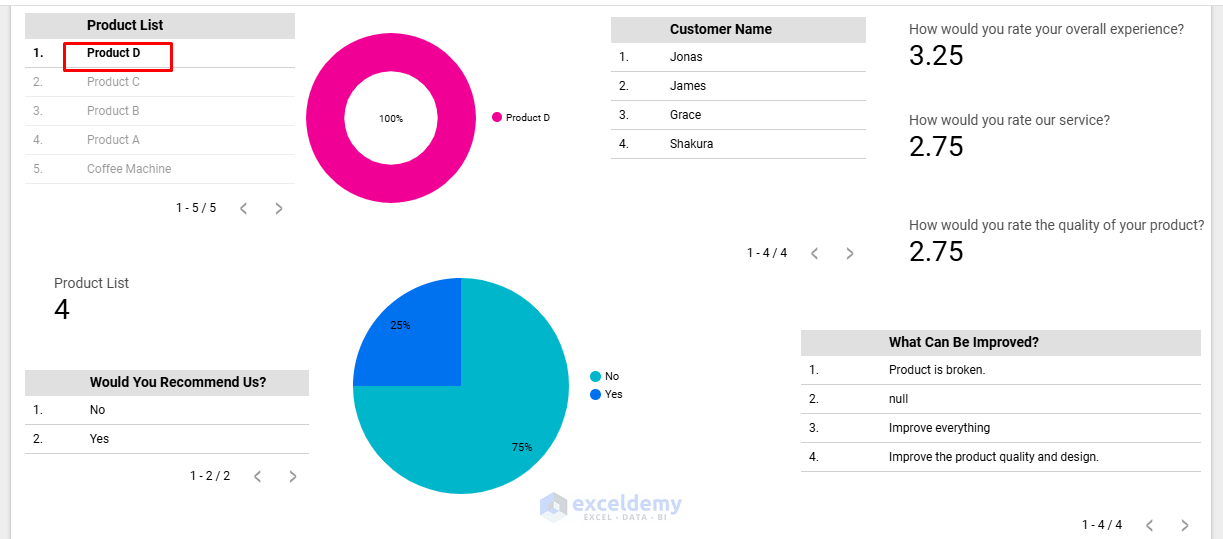
Final Output:
Now, click on any product or other elements to analyze the overall performance of that product or value.
- Here we selected Product D, the dashboard will update every metric for Product D.
3. Share the Dashboard
- Click on View to see the entire dashboard and Edit to edit the dashboard.
- Click Share in Google Locker Studio.
- Set permissions to View Only access for Public.
- To share the link with your team, generate a shareable link for team members or clients.

Step 4: Automate & Update Data
- Google Forms automatically updates Google Sheets with new responses.
- Google Data Studio syncs data in real time.
- Use scheduled reports for regular updates.
Advantages of Google Forms & Data Studio
Advantages:
- No Coding Required: Completely no-code and easy to set up. Mostly drag and drop.
- Automated Data Collection: Google Forms automatically logs responses.
- Dynamic Dashboards: Google Data Studio updates data instantly. Offers selectable table lists and interactive dynamic tables. Each table is connected.
- Easy Querying: With a click, you can filter or query any specific data as tables are connected to each other.
- Secure & Cloud-Based: All data is stored safely in Google Drive.
Limitations:
- Limited Interactivity: You cannot directly edit data in Google Locker Studio.
- Basic Automation: You can’t apply advanced logic for conditional updates.
- Scalability Issues: Best for small to medium datasets.
Conclusion
By using Google Forms, Google Sheets, and Google Data Studio, you can create a fully automated data collection, visualization, and querying system without writing any code. This combination is a perfect solution for customer feedback analysis, task tracking, employee log management, and reporting dashboards. Locker Studio offers plenty of options and features to create a dynamic interactive dashboard. Explore Locker Studio to unleash the power of reporting and data analysis.
Get FREE Advanced Excel Exercises with Solutions!
