
Data preparation consumes a crucial amount of a data scientist’s time. As they frequently work with datasets from multiple sources, data can be messy, wide, inconsistent, unstructured, etc. Power Query eliminates coding from ETL operations through its visual interface, reducing data preparation time from hours to minutes while handling datasets from thousands to millions of rows.
In this tutorial, we will show how data scientists can use Power Query to reshape, merge, and clean at scale.
Why Power Query for Data Scientists?
- No-Code ETL: Drag-and-drop operations with visual previews.
- Efficient Engine: Handles large datasets with ease using lazy evaluation.
- Seamless Integration: Works inside Excel and Power BI, exportable to other tools.
- Reproducible Steps: Each action is recorded as a step for easy audit and automation.
Let’s use a sample dataset to show the use of Power Query.
- Customer Info: Contains customer details.
- Monthly Transactions: Purchase amounts per month.
- Support Tickets: Customer-reported issues.
Load the Data into Power Query
In Excel:
- Go to the Data tab >> select Get Data >> select From Workbook or From CSV.
- Load each of the three data sets into Power Query.
- Click Transform Data to open the Power Query Editor.
In Power BI:
- Go to Home tab >> select Get Data >> select Excel/CSV.
- Load each of the datasets.
- Select Transform Data after loading.
1. Clean at Scale: Data Quality Operations
Power Query offers multiple tools to clean large datasets efficiently.
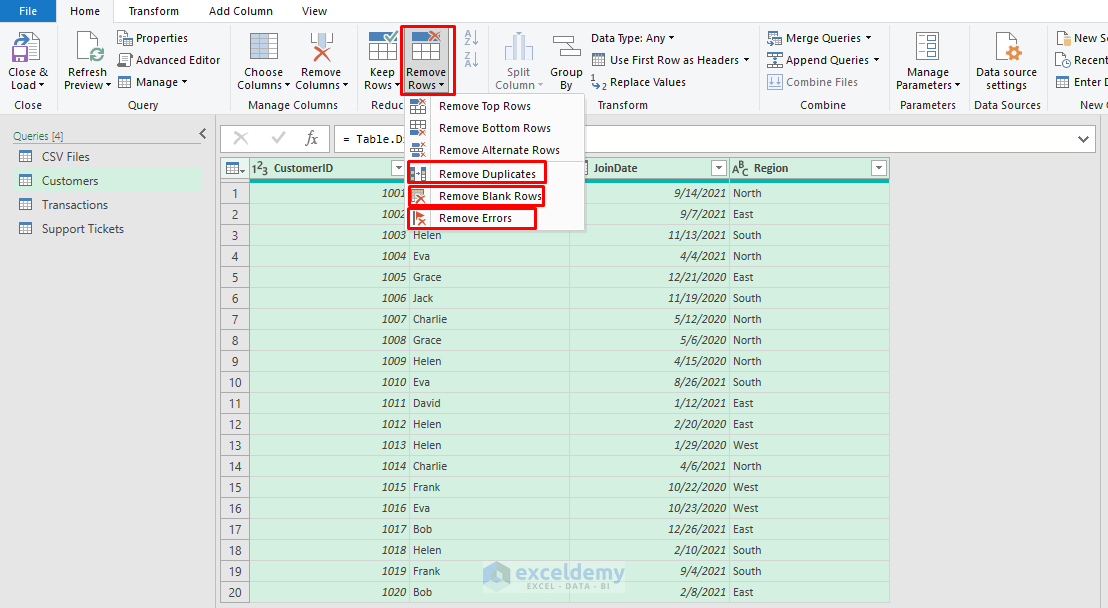
1.1. Remove Rows
Remove Duplicates:
- Select one or more columns.
- Go to the Home tab >> select Remove Rows >> select Remove Duplicates.
Remove Blank Rows:
- Select one or more columns.
- Go to the Home tab >> select Remove Rows >> select Remove Blank Rows.
Handle Nulls and Errors:
- Use filters to exclude null values or select Remove Errors.
- Filter Out Nulls: Click the dropdown on the column header >> Uncheck (null).
Replace Values:
- Select one or more columns.
- Go to the Transform tab >> select Replace Values.
- Value to Find: null
- Replace With: 0
- Click OK.

1.2 Fix Data Types
- Ensure data types are correct: date, decimal, text.
- You can click the icon next to the column name (shows “ABC”) to change the data type.
- Right-click >> select Change Date Type >> select Date Types.
- JoinDate, TicketDate: Date.
- Customer Name, Product, Category, Region, etc: Text.
- Quantity: Whole Number.
- Amount: Decimal Number.

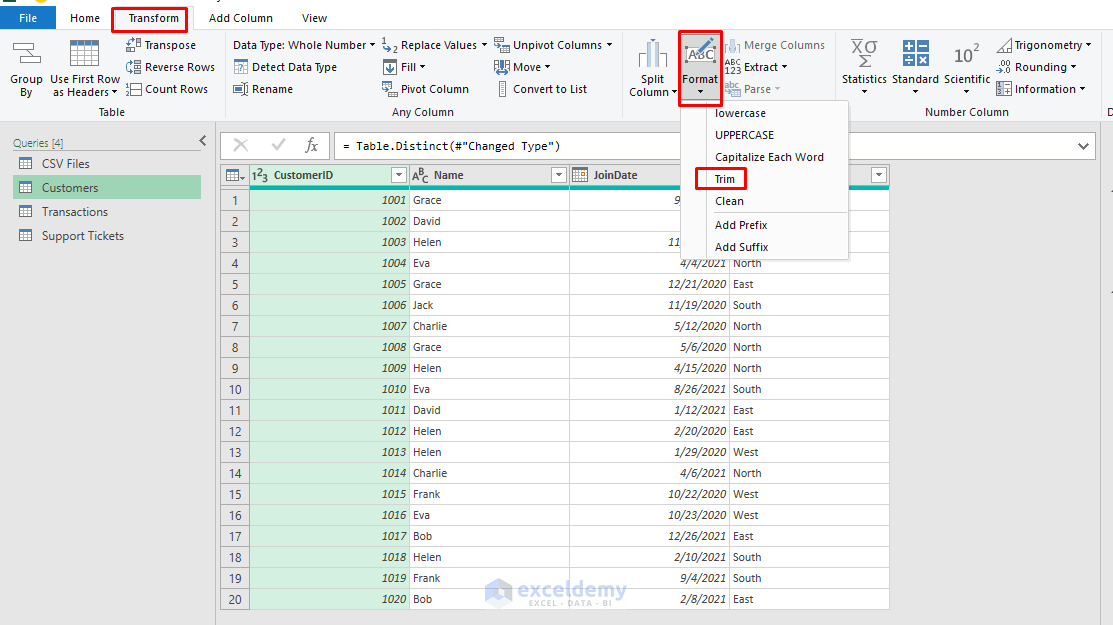
1.3 Trim & Clean Text
- Go to the Transform tab >> select Format >> select Trim (remove leading/trailing spaces).
- Select Clean to remove non-printable characters.
2. Reshape: Structure Data for Modeling
Unpivoting is useful when you need to transform columns into rows for analysis, such as monthly sales in separate columns.
2.1 Unpivoting Monthly Transactions
The Monthly Transactions dataset is in wide format, with columns Jan_2023, Feb_2023, and Mar_2023. This format is difficult to work with when analyzing trends or building time-based models.
Steps to Unpivot:
- Select columns Jan_2023, Feb_2023, Mar_2023.
- Go to the Transform tab >> choose Unpivot Columns.

- Go to the Transform tab >> select Rename.
- Attribute → Month.
- Value → Amount.
- Confirm correct data types: CustomerID as Whole Number, Month as Text, Amount as Decimal.

Each row now represents a single transaction month per customer. It is ideal for filtering, plotting, or summarizing by time.
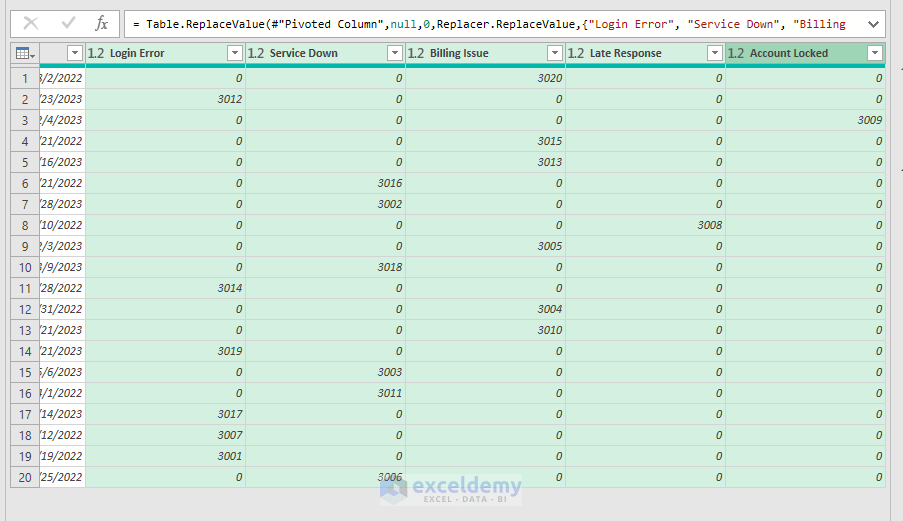
2.2 Pivoting Support Tickets
The Support Tickets dataset contains CustomerID, Issue, and TicketID, with multiple rows per customer with different issue types.
To make each issue a column:
Steps to Pivot:
- Select the Issue column.
- Go to the Transform tab >> choose Pivot Columns.
- Use TicketD as the Value column.
- Click OK.

- Select Issue columns.
- Go to the Transform tab >> select Replace Values.
- Value to Find: null
- Replace With: 0
- Click OK.

You now have a wide format where each column (e.g., Login Error, Billing Issue) shows how often each customer reported that issue.
3. Merge: Combine Data Sources
Once each dataset is cleaned and reshaped, merge them into a unified table for analysis.
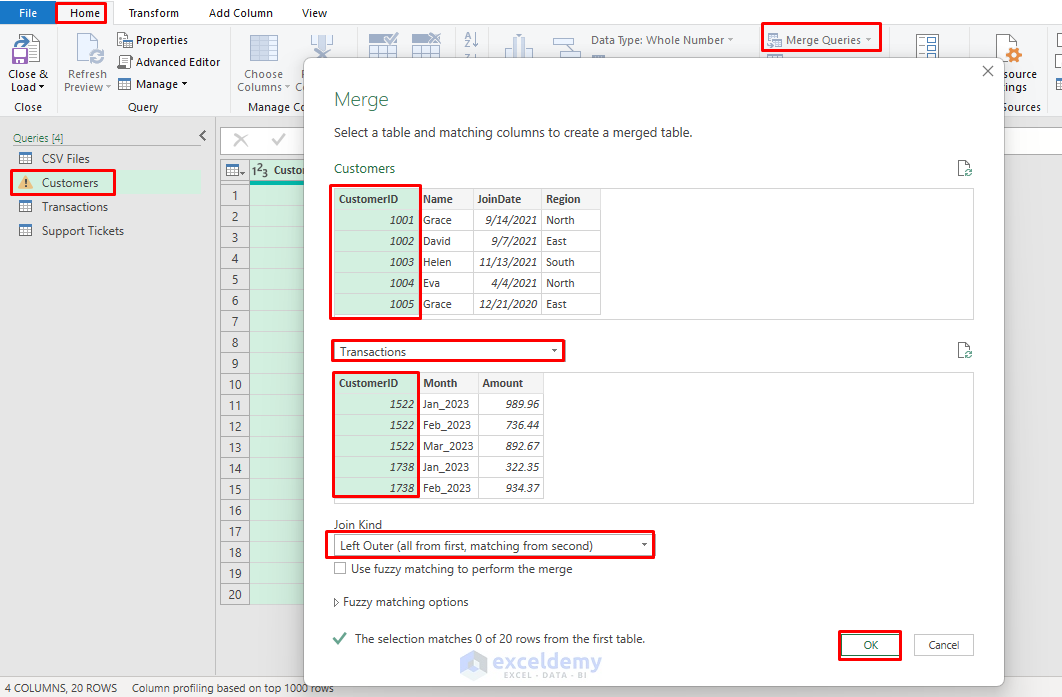
Merge Customer Data with Transaction:
- Select Customers query.
- Go to the Home tab >> select Merge Queries.
- Top table: Customers, Bottom table: Transactions.
- Select CustomerID in both tables (highlighted in green).
- Join Kind: Left Outer (keeps all sales records).
- Click OK.
- Expand merged columns to include Month, Amount.
- Click the Expand icon >> select Month, Amount.
- Uncheck “Use original column name as prefix”.
- Click OK.
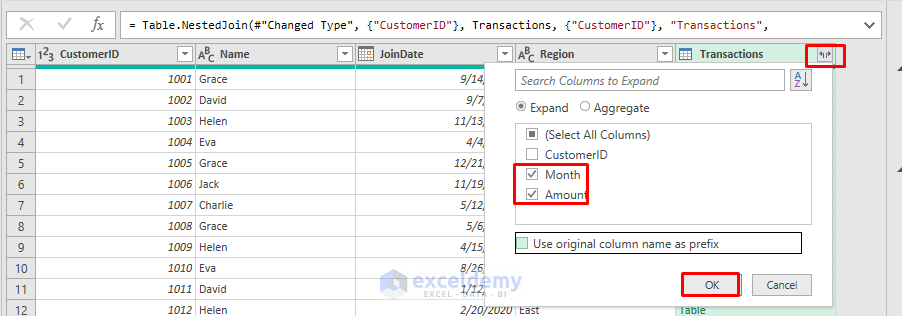
- Merged the Month and Amount from the Transactions query table to the Customers table.
Merge Result with the Pivoted Support Tickets:
- Go to the Home tab >> select Merge Queries.
- Top table: Customers, Bottom table: Support Tickets.
- Select CustomerID in both tables.
- Join Kind: Left Outer (keeps all sales records).
- Click OK.

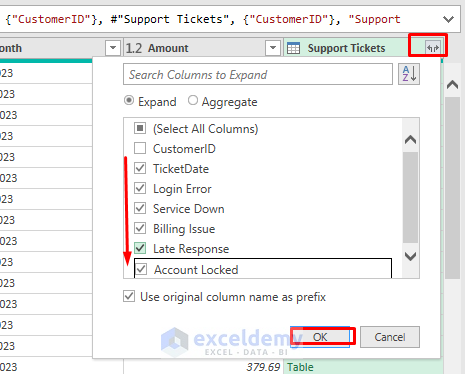
- Click the expand button on the Support Tickets column.
- Select the following columns.
- Uncheck “Use original column name as prefix”.
- Click OK.
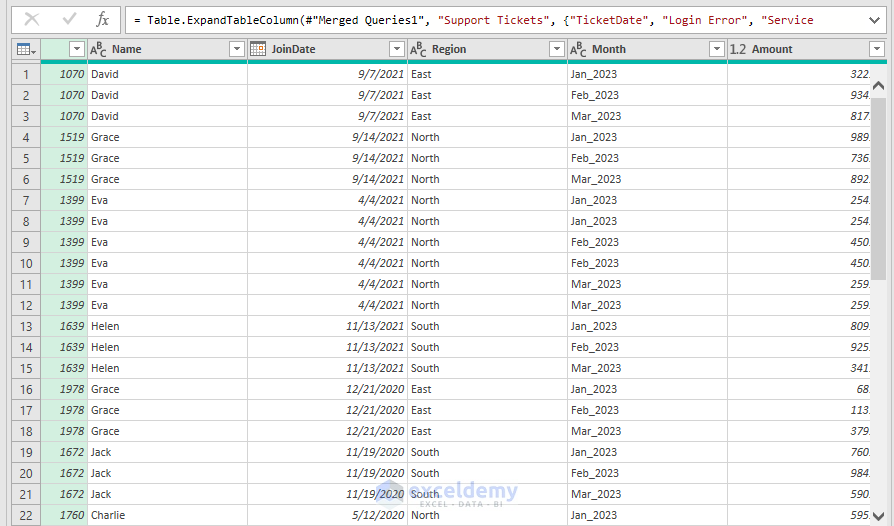
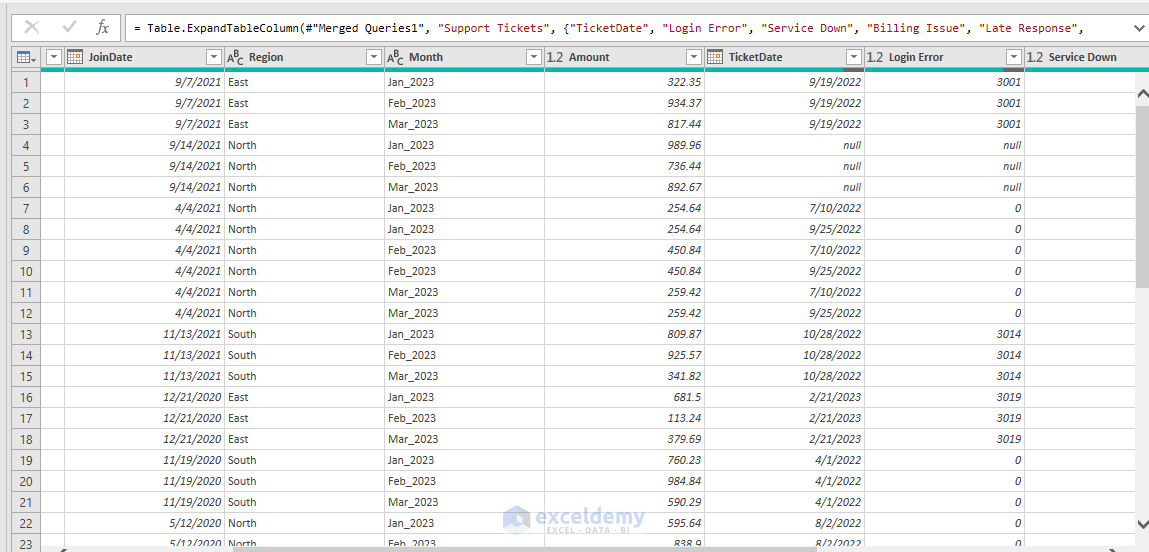
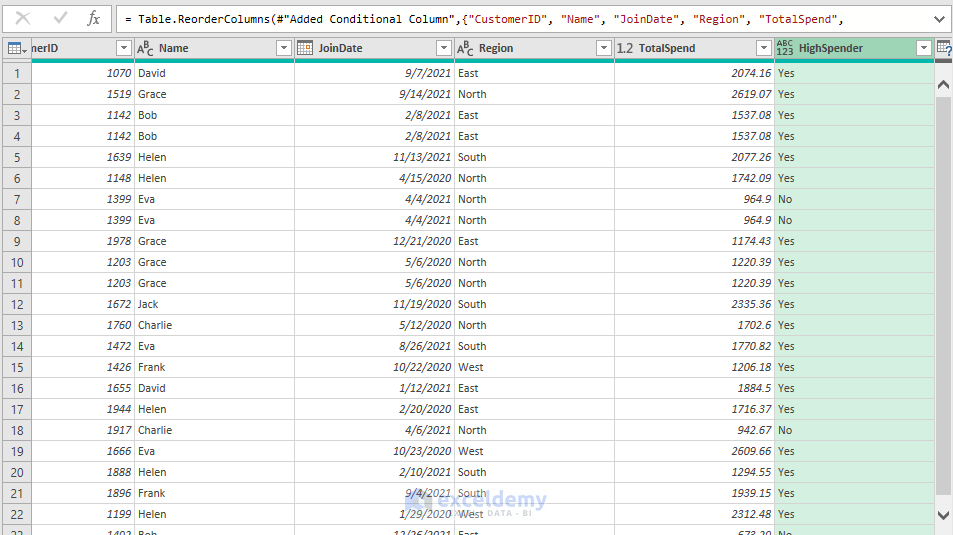
A Full-Featured Table with:
- Demographics (from Customer Info).
- Monthly purchase behavior (from Transactions).
- Support load by issue type (from Support Tickets).
4. Transform and Enrich: Advanced Data Operations
Use Power Query to derive insightful features for analysis or modeling. You can use merged sales and customer data, create advanced analytics columns.
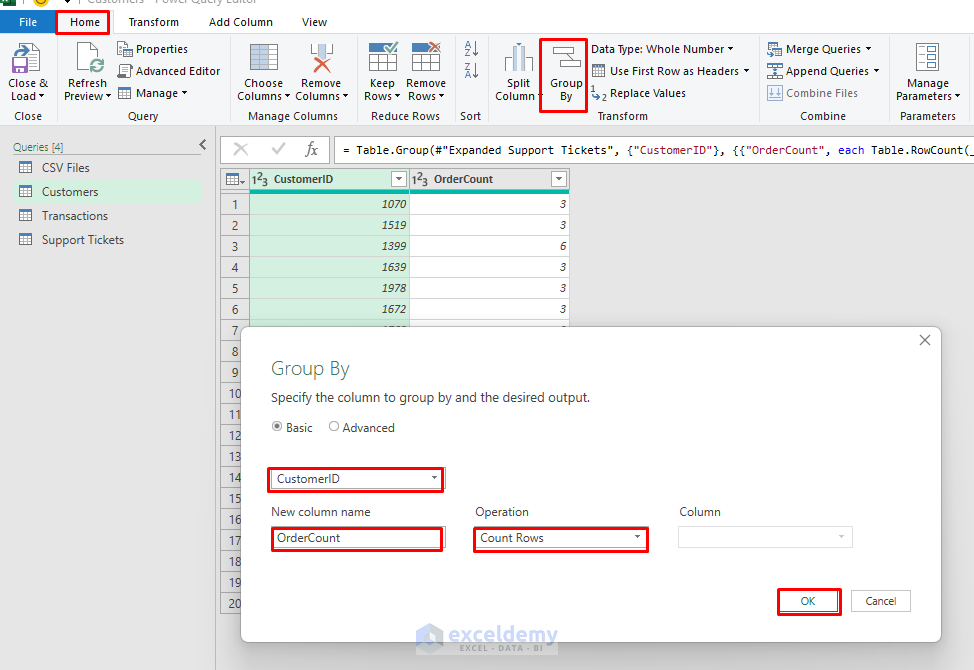
Purchase Frequency Score:
- Select the Customers query table.
- Go to the Home tab >> select Group By.
- Group by: CustomerID
- New column: OrderCount, Operation: Count Rows.
- Click OK.
- This shows purchase frequency per customer.
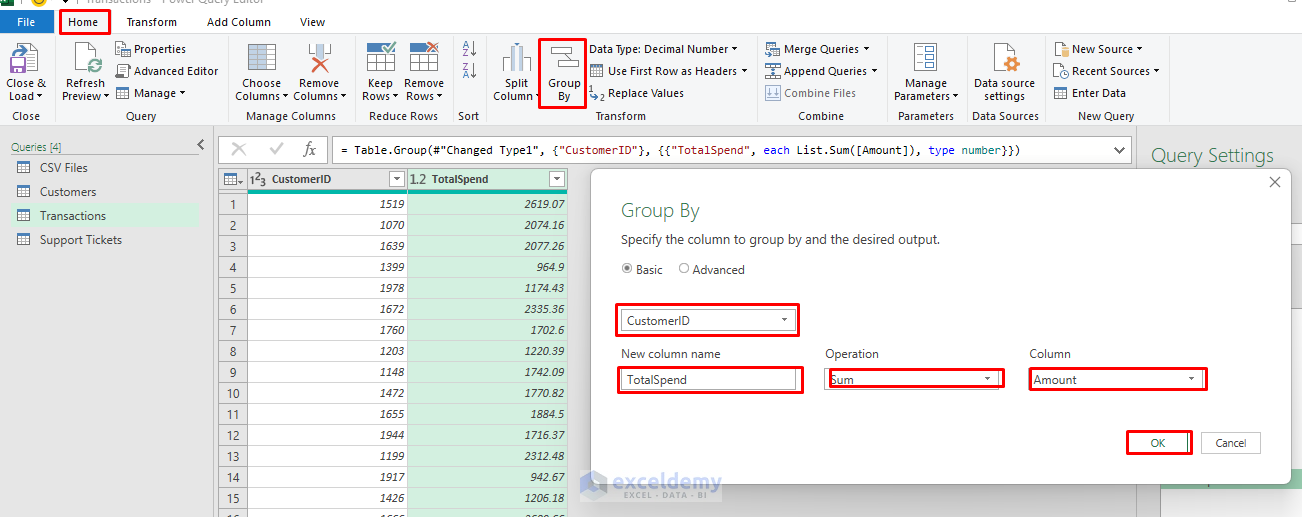
Total Spend by Customer:
- Select the Transactions query table.
- Go to the Home tab >> select Group By.
- Group by: CustomerID
- New column: TotalSpend, Operation: Sum, Column: Amount.
- Click OK.
- This shows total spend per customer.
Advanced Conditional Logic:
Flag customers with total spend >= $1000.
- Go to the Add Column tab >> select Conditional Column.
- New column name: HighSpender.
- Column Name: TotalSpend, Operator: is greater than or equal, Value: 1000, Output: Yes.
- Else: No.
- Click OK.
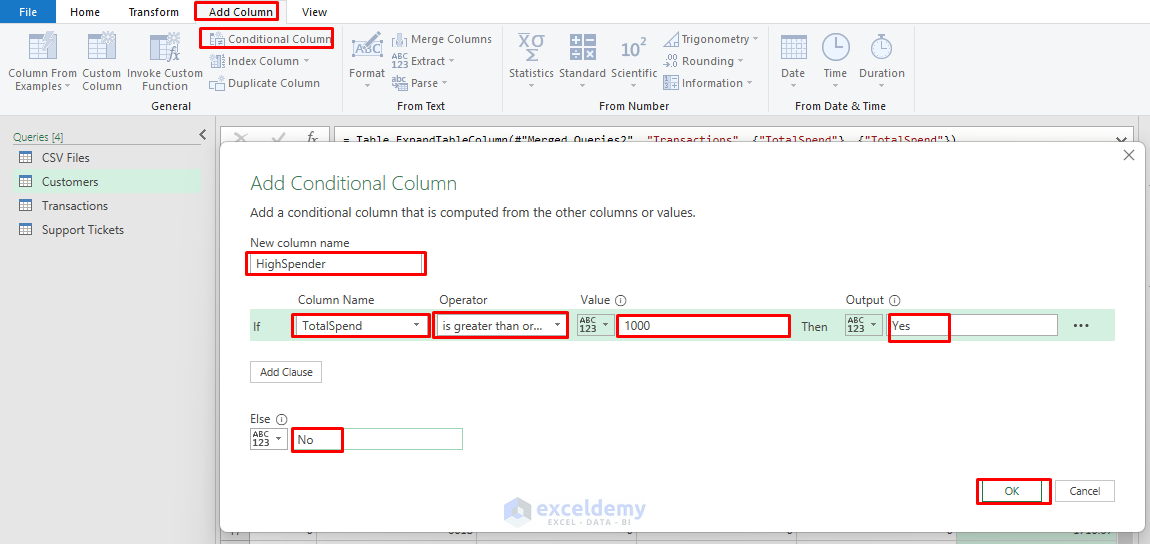
- This shows Yes where totalspend is greater than or equal to 1000, otherwise No.
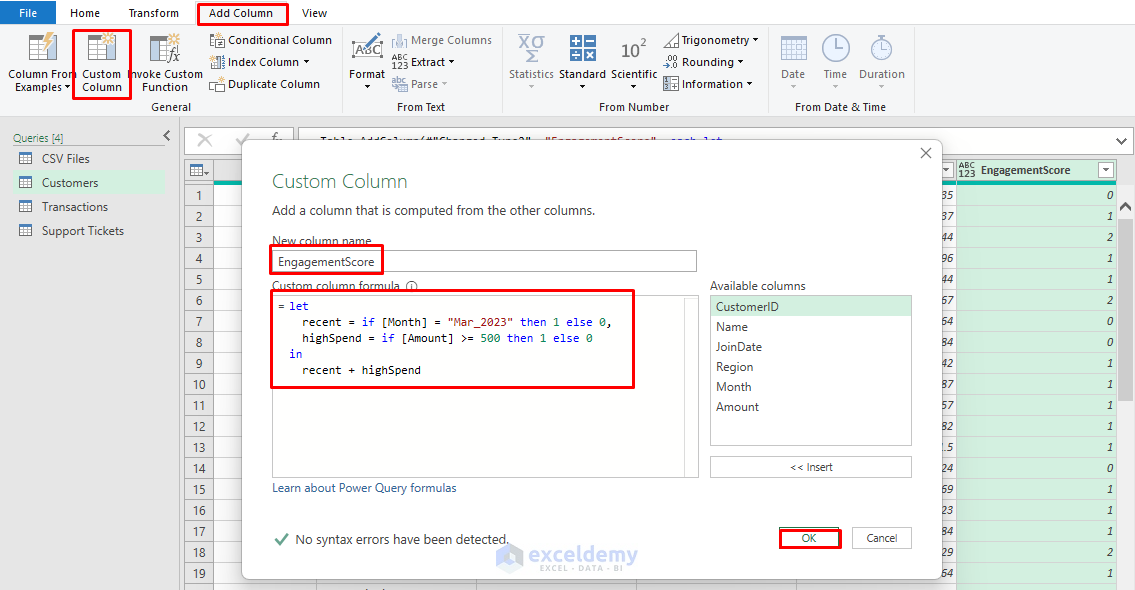
Add Custom Column:
Let’s calculate the engagement score.
- Go to the Add Column tab >> select Custom Column.
- New column name: EngagementScore.
- In the Custom column formula, insert the following M Code;
let
  recent = if [Month] = "Mar_2023" then 1 else 0,
  highSpend = if [Amount] >= 500 then 1 else 0
in
  recent + highSpend
-
- Click OK.
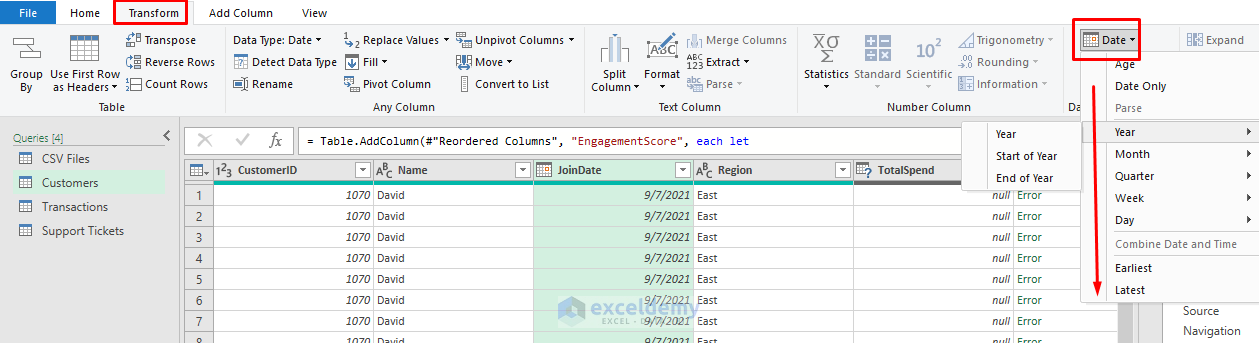
Create Time Intelligence:
- Go to the Transform tab >> select Date >> select Date format.
5. Scale: Performance Optimization
You can implement performance strategies for production-scale datasets.
5.1 Query Folding Optimization
Check Folding Status:
- Right-click any transformation step.
- Find the View Native Query option.
- If available, transformation is “folded” (optimized).
Maintain Folding:
- Keep filtering and basic transformations early.
- Avoid complex custom columns until necessary.
- Use built-in functions over custom formulas.
5.2 Memory Management
Filter Early Strategy:
- Add a date filter immediately after loading.
- Go to the Home tab >> select Keep Rows >> select Keep Top Rows (for testing).
- Or filter by date range: last 90 days for analysis.
Remove Unnecessary Columns:
- Right-click unused columns >> select Remove.
- Reduces memory footprint significantly.
- Improves refresh performance.
6. Automate and Refresh
Power Query keeps a full record of each step. That means you can refresh the workflow without redoing transformations.
In Excel:
- Go to the Data tab >> select Refresh All.
In Power BI:
- Click Home >> select Refresh.
- Or schedule a refresh on the Power BI service
This makes your ETL pipeline repeatable and scalable across time and projects.
Conclusion
Power Query is not just a transformation tool; it’s a powerful, scalable no-code ETL engine for data scientists and analysts. Whether you’re reshaping monthly reports, merging support logs, or cleaning customer records, Power Query offers all types of features for basic to advanced analysis. By using the techniques explained in this article, you can streamline your entire data preparation workflow, making it faster, more reliable, and accessible to teams with or without coding backgrounds.
Get FREE Advanced Excel Exercises with Solutions!

Unable to get the excel file 3 time i put my email but not received
Hello Parteek,
Earlier, the practice file wasn’t uploaded and Download box is given there. That’s why you didn’t receive it by email. I’ve now attached the Excel file here so you can download it directly.
Unleashing Power Query for Data Scientists: Reshape, Merge, Clean at Scale.xlsx
Regards,
ExcelDemy