What Is Normal Distribution?
The Normal Distribution, also known as the Gaussian Distribution, represents the probability distribution of a sample space. Key characteristics of the normal distribution include:
- Symmetry around the mean (average).
- A mean of zero.
- A standard deviation of 1.
The equation to find the normal distribution in a set of data is given below.
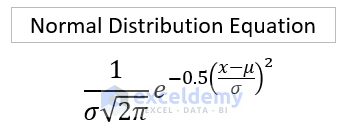
Where,
σ = Standard Deviation
x = Sample Data
μ = Average/Mean
In practical terms, the normal distribution helps us understand the significance of data within a group. Now, let’s look at how to find the normal distribution for a set of data.
Dataset Overview
In the dataset, we have information about some students’ performance by score in an examination. We will determine who did an outstanding performance in that exam by transforming their score into normal distribution using Excel.
![]()
Method 1 – Using Excel’s NORM.DIST Function
- Create a Column for Normal Distribution Values:
- Set up a new column to store the normal distribution values.
- Select two cells to store the Mean (μ) and Standard Deviation (σ).
- Calculate the Mean:
- Enter the following formula to calculate the Mean (average) of the student marks (assuming the marks are in cells C5 to C11):
=AVERAGE(C5:C11)
-
-
- This function returns the Mean value.
-
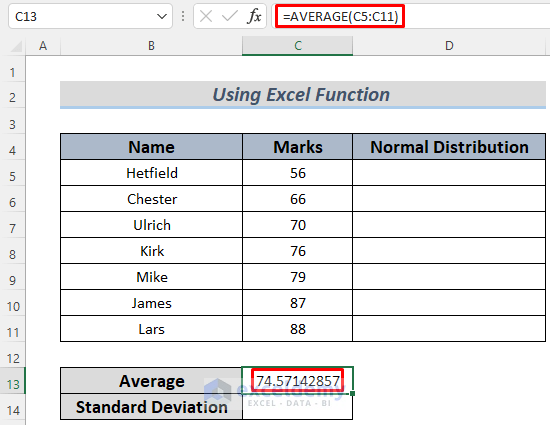
- Calculate the Standard Deviation:
- Enter the following formula to calculate the Standard Deviation:
=STDEV.P(C5:C11)
-
-
- The STDEV.P function returns the Standard Deviation for the data.
-
![]()
- Compute the Normal Distribution Value:
- In cell D5, enter the following formula:
=NORM.DIST(C5,$C$13,$C$14,FALSE)
-
-
- Here, C5 represents the student’s score, $C$13 is the Mean, and $C$14 is the Standard Deviation.
-
- Press ENTER to see the normal distribution value for the student’s mark in cell C5.
![]()
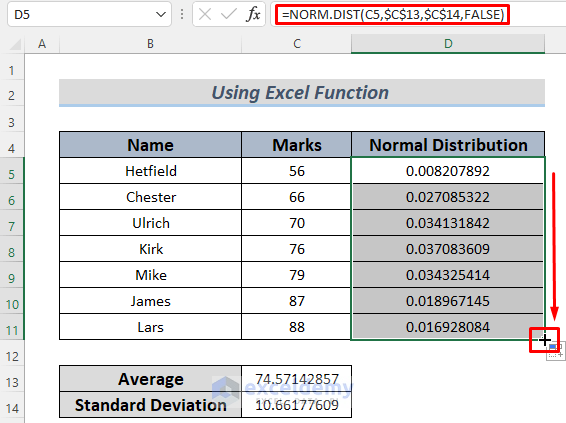
- AutoFill for Other Cells:
- Use the Fill Handle to AutoFill the formula down to cover all data points.
- Visualize the Data in a Normal Distribution Graph:
- Select the range C4:D11.
- Go to Insert > Scatter with Smooth Lines to create a normal distribution graph.
![]()
You will see the data in a normal distribution graph.
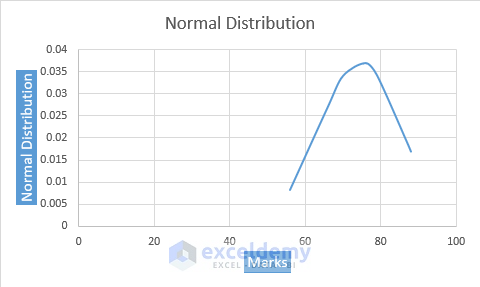
Interpretation:
- Approximately 68% of the data falls within the range of Mean ± Standard Deviation.
- About 95% of the data lies within Mean ± 2 * Standard Deviation.
- Nearly 99.7% of the data falls within Mean ± 3 * Standard Deviation.
For example, if the Mean is 74.57 and the Standard Deviation is 10.66, a student’s score between 63.91 and 85.23 is within the 68% range.
Remember to adjust these ranges accordingly for 95% and 99.7% confidence levels.
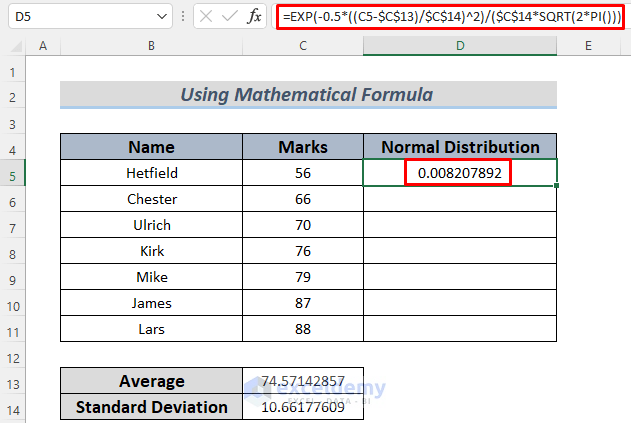
Method 2 – Applying Mathematical Formula to Transform Data to Normal Distribution
If you’re comfortable with statistics and prefer not to use the built-in NORM.DIST function, you can apply the mathematical formula for normal distribution. Let’s walk through the process step by step:
- Prepare Your Data:
- Create a new column to store the normal distribution values.
- Select two cells to store the Mean (μ) and Standard Deviation (σ).
- Calculate the Mean and Standard Deviation:
- Follow the process outlined in Method 1 to compute the Mean and Standard Deviation for your dataset.
- Use the Mathematical Formula:
- In cell D5, enter the following formula:
=EXP(-0.5*((C5-$C$13)/$C$14)^2)/($C$14*SQRT(2*PI()))
- Here’s what each part of the formula does:
- EXP calculates the exponential value.
- SQRT computes the square root.
- The expression within the parentheses represents the z-score (standardized value).
- The entire formula yields the normal distribution value for your data.
![]()
- View the Result:
- Press ENTER to see the normal distribution value in cell C5.
- Use the Fill Handle to AutoFill the formula down to cover other data points.
![]()
- Graphical Representation (Optional):
- If you want to visualize your data in a normal distribution graph, refer to the instructions in Method 1.
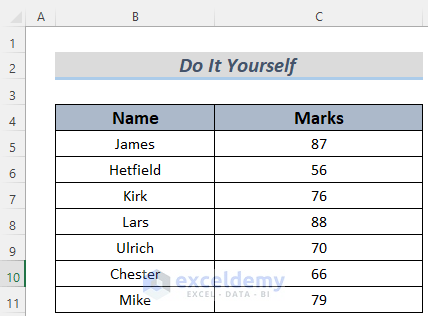
Practice Section
Herewith the dataset of this article so that you can practice these methods.
Download Practice Workbook
You can download the practice workbook from here:
<< Go Back to Normal Distribution in Excel | Excel for Statistics | Learn Excel
Get FREE Advanced Excel Exercises with Solutions!

Y c13 and c14 was used for =normal dist
Dear Bemina, thank you so much for your query. To apply the NORM.DIST function as well as the arithmetic formula for calculating the Normal Distribution, it is required to calculate Mean and Standard Deviation first.
The formula we have used for Normal Distribution is:
=NORM.DIST(C5,$C$13,$C$14,FALSE)The generic syntax of the NORM.DIST function is:
=NORM.DIST(x,mean,standard_dev,cumulative)Here,
x = C5 = supplied value to calculate the distribution
mean = $C$13 = arithmetic average of the distribution
standard_dev = $C$14 = standard deviation of the distribution
cumulative = FALSE = Returns probability mass function if the value is FALSE
Related Articles:
• How to Calculate Average in Excel
• How to Calculate Mean and Standard Deviation
• Calculate Normal Distribution in Excel
Thanks for reaching out. We, team ExcelDemy are here to assist you. Please feel free to let us know if you face any other shortcomings.
Regards,
MD Tanvir Rahman
Excel and VBA Content Developer
Exceldemy, Softeko.