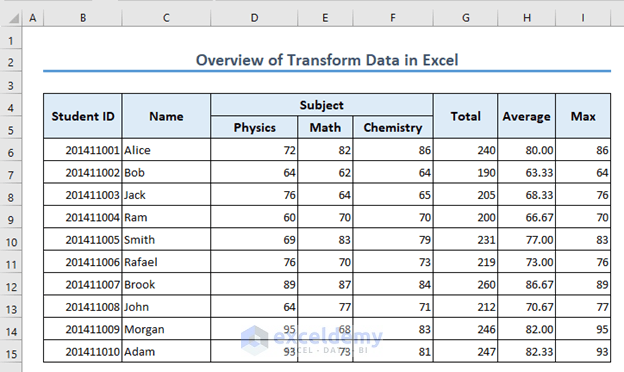
Here’s an image overview of the sample dataset we’ll use to demonstrate how you can transform data.
Download the Practice Workbook
Introduction to Data Transformation
Data transformation in Excel changes the way data looks without changing what it means. Excel lets you sort and filter data so you can put it in order or choose only the parts you need.
Data transformation is important because it helps make data more accurate, meaningful, and organized. It also lets you combine data from different sources. When you transform data, it becomes easier to perform calculations, make charts, and understand what the data is telling you.
The goal of data transformation in Excel is to make data easier to work with, so you can analyze it, make decisions, and share it with others. It gives you the power to make data look the way you want and makes sure it’s in a good shape for whatever you want to do with it.
Excel Features and Tools to Transform Data
Part 1 – Excel Functions to Transform Data
Case 1.1 – The SUM Function
You can use the SUM function to add multiple numbers in Excel. We want to calculate the total marks using the below dataset.
- Here’s the formula used in G6:
=SUM(D6:F6)
- Use the Fill Handle to AutoFill to G15.

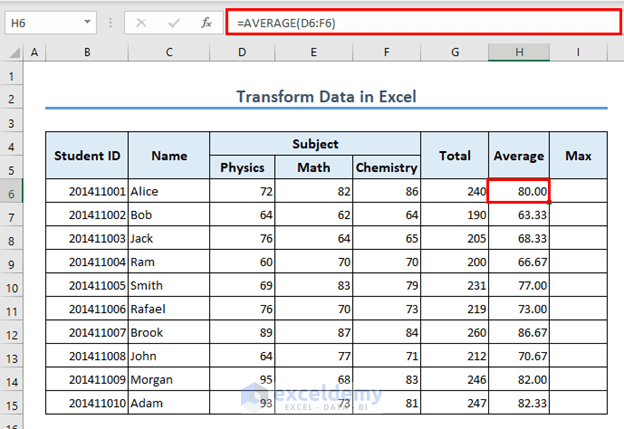
Case 1.2 – The AVERAGE Function
You can also get the average mark for any student in the above dataset.
- The formula in H6 is:
=AVERAGE(D6:F6)
- Use the Fill Handle to AutoFill to H15.
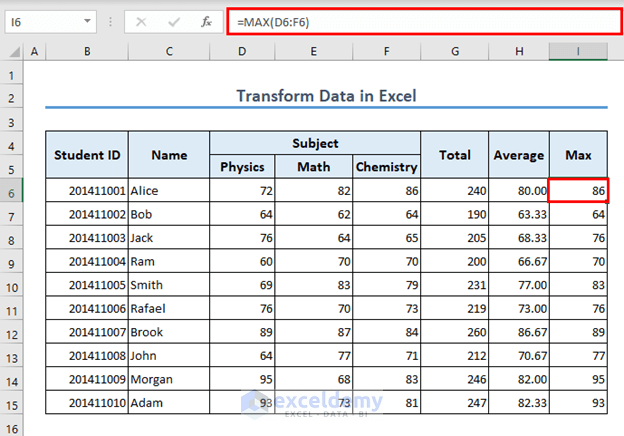
Case 1.3 – The MAX Function
In case you want to find out the maximum number a student has got, you can use the MAX function.
- The formula in I6 is:
=MAX(D6:F6)
- Use the Fill Handle to AutoFill to H15.
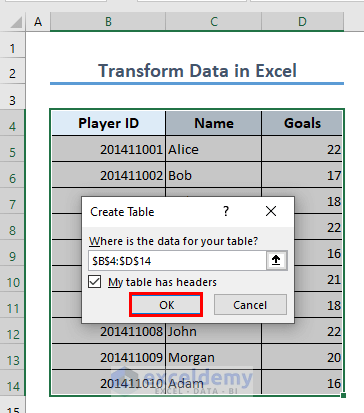
Part 2 – Transform Data Using Power Query
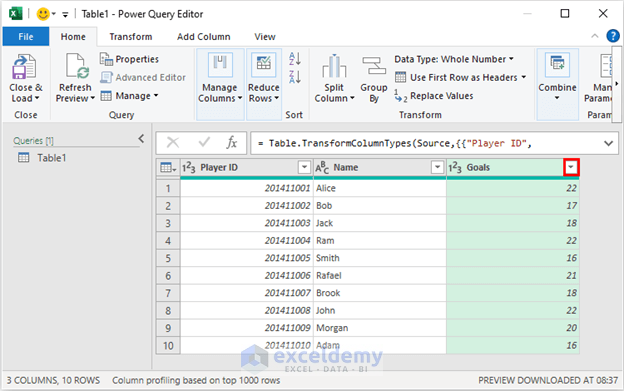
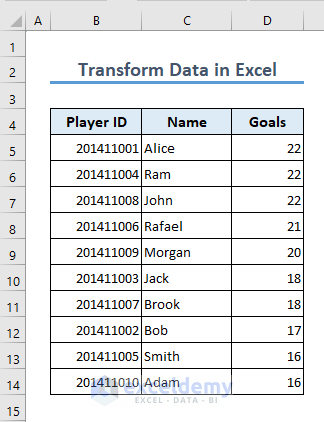
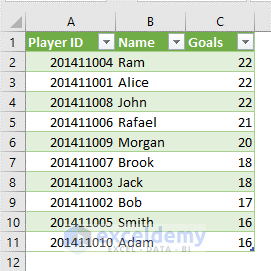
We want to know who has scored the most goals.
- Select the dataset and go to the Data tab.
- Select the From Table/Range option.

- The Create Table box will appear.
- Mark My table has headers and click OK.
- Excel will open the Power Query Editor.
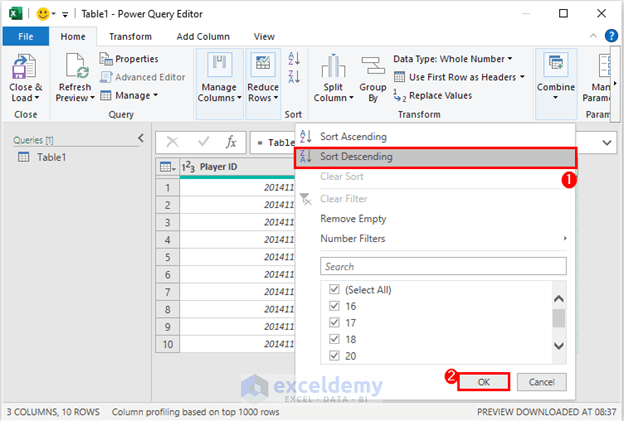
- To sort the table based on the goal numbers, select the drop-down for Goals.
- Select the Sort Descending option and click OK.
- Excel will sort the data.
- To transform the table into an Excel table, click the Close & Load option.
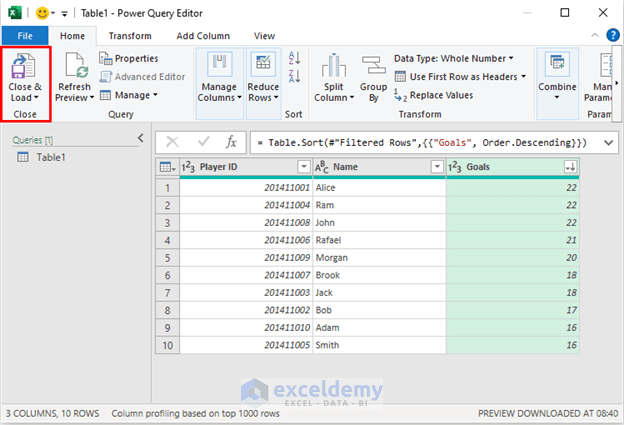
- Excel will create a new table in a separate workbook.

Part 3 – Apply VBA to Transform Data in Excel
Let’s see how you can perform the sorting operation using VBA.
- Press Alt + F11 to open the VBA window.
- Go to Insert and select Module.
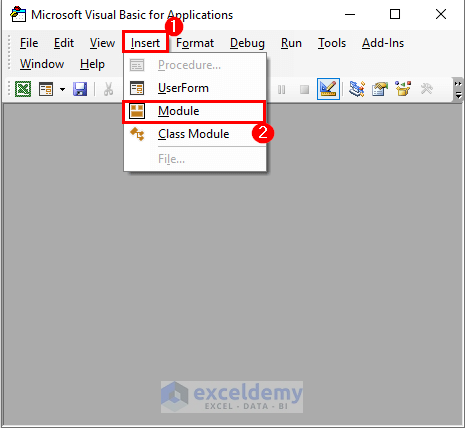
- A new module will open. Insert the following code.
Sub SortRangeDescending()
Dim ws As Worksheet
Dim rng As Range

Set ws = ThisWorkbook.Worksheets("Macros and VBA")
Set rng = ws.Range("B5:D14")

With rng
.Sort Key1:=.Columns(3), Order1:=xlDescending, Header:=xlNo
End With
End Sub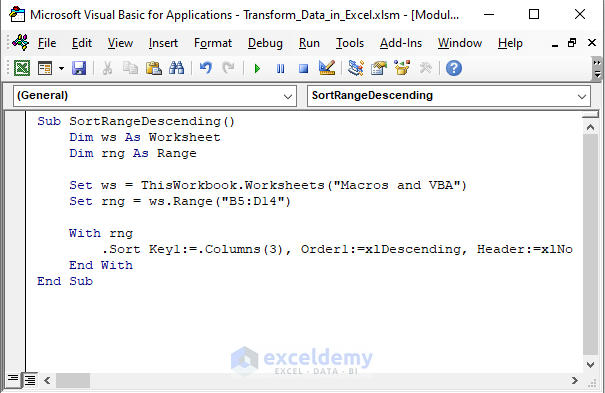
Code Breakdown
With rng
        .Sort Key1:=.Columns(3), Order1:=xlDescending, Header:=xlNo
    End With
The With statement is used to apply a sort operation to the range variable rng. The code sorts the range based on the third column (Key1:=.Columns(3)) in descending order (Order1:=xlDescending), without considering the first row as a header (Header:=xlNo).
- Press F5 to run the code.
Examples of Data Transformation in Excel
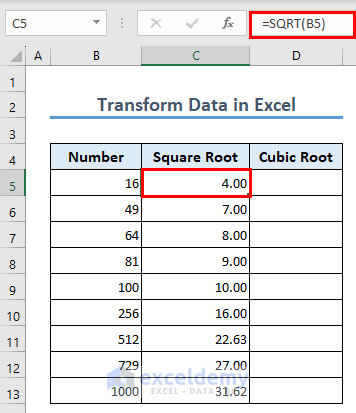
Example 1 – Calculate the Square Root of a Number
- Insert the following formula in C5:
=SQRT(B5)
- Use the Fill Handle to AutoFill to C13.
Example 2 – Calculate the Cubic Root of a Number
- The formula in D5 is:
=B5^(1/3)
- Use the Fill Handle to AutoFill to D13.

- You can use this formula to calculate the Nth root of any number by inserting N instead of 3.
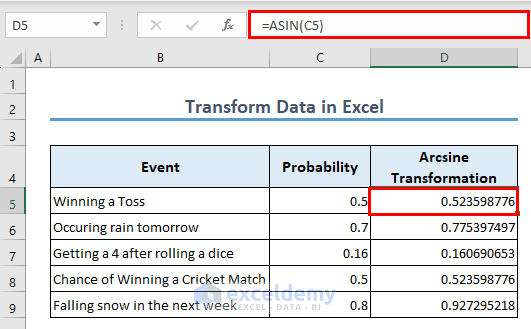
Example 3 – Arcsine Transform in Excel
The arcsine, denoted as sin^(-1) or asin, is a mathematical function that represents the inverse of the sine function. It is used to find the angle whose sine is the given value. In other words, if you have a number between -1 and 1, the arcsine function will give you the angle (in radians) that produces that sine value.
We will use the ASIN function to perform the Arcsine transformation of a number in Excel.
- The formula in D5 is:
=ASIN(C5)
- Use the Fill Handle to AutoFill to D9.
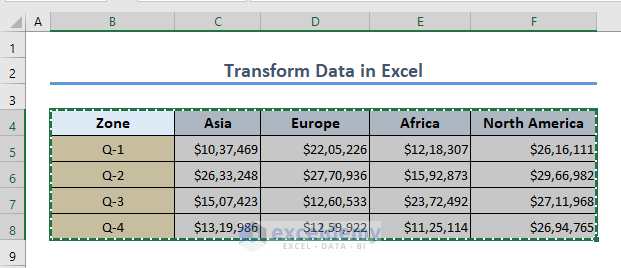
Example 4 – Transpose Columns and Rows
- Select the range you want to transpose.
- Press Ctrl + C to copy the dataset.
- Select the cell where you want to paste the transposed data.
- Right-click to get the Context menu and select the Transpose option as shown in the image.
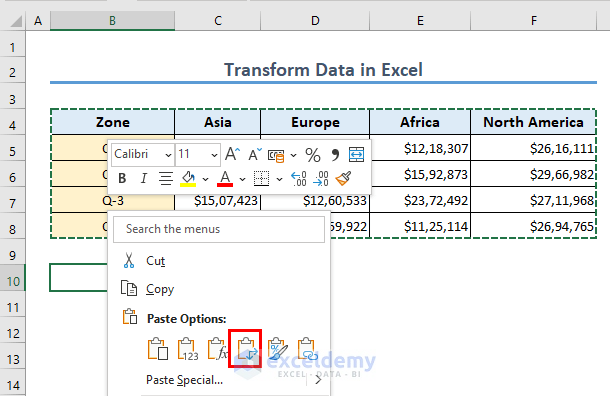
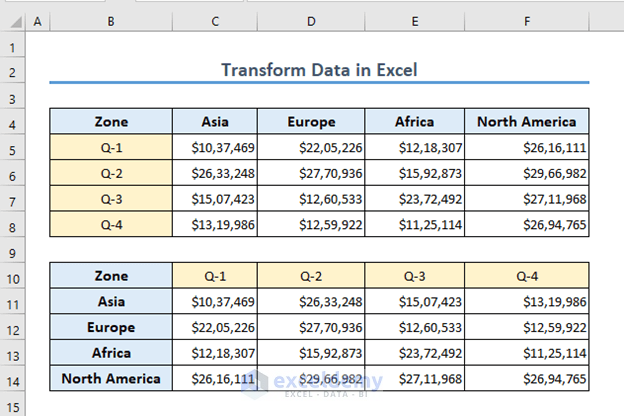
- Excel will transpose the range.
The Get and Transform Tool in Excel
The Get and Transform tool is a data transformation and data extraction feature in Excel. It provides a powerful set of tools and functionalities that allow users to connect to various data sources, import data, and transform it for analysis and reporting purposes.
Once the data is imported, the Get and Transform tool allows users to apply various transformations to cleanse, shape, and manipulate the data.
Uses of the Get and Transform Tool
- Data Import and Connection: Get and Transform allows you to connect to various data sources, such as databases, spreadsheets, web pages, and online services.
- Data Transformation and Cleaning: This tool enables you to perform data transformations and cleaning operations easily. You can remove duplicates, filter rows based on specific criteria, split or merge columns, change data types, perform calculations, and apply custom transformations to shape the data according to your requirements.
- Combining and Merging Data: Get and Transform allows you to combine data from multiple sources or merge tables based on common columns. This is useful when dealing with data stored in different files or databases, and need to consolidate and analyze it together.
- Data Preparation for Analysis: Get and Transform helps you prepare data for analysis by cleaning, transforming, and structuring it in a way that facilitates easy analysis.
- Automating Data Refresh and Updates: Once a connection is established, you can schedule automatic data refreshes from the original data source. This allows you to keep your analysis up to date without the need for manual data updating.
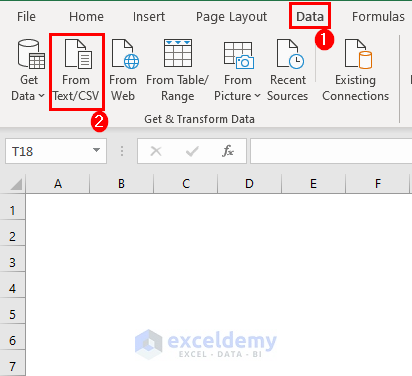
Load and Transform CSV Files in Excel
- Go to the Data tab and select From Text/CSV.
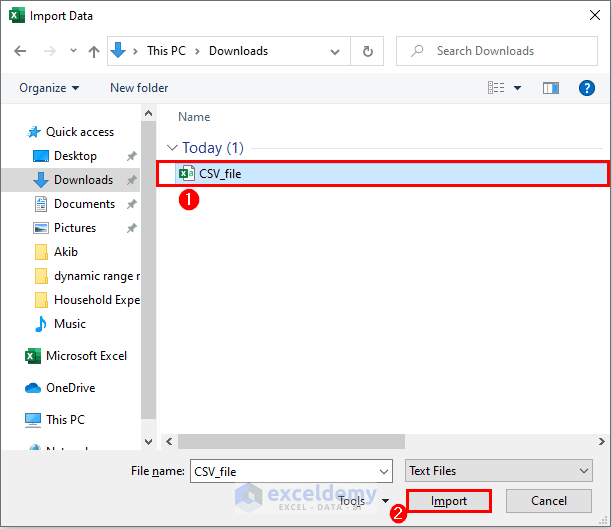
- Excel will open a Dialog box named Import Data.
- Browse and select the CSV file you want to transform, then click the Import button.
- Excel will open a Query window. Select Transform Data button.
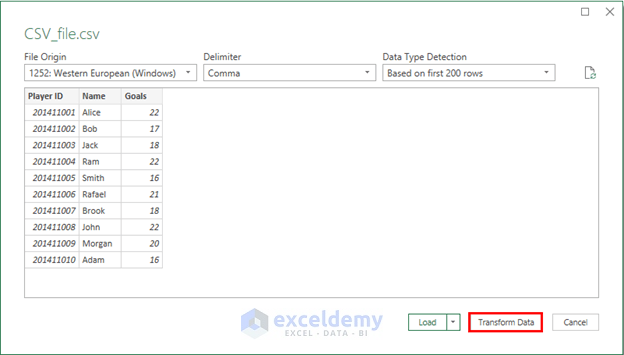
- A Power Query Editor appears with the contents of the CSV file.
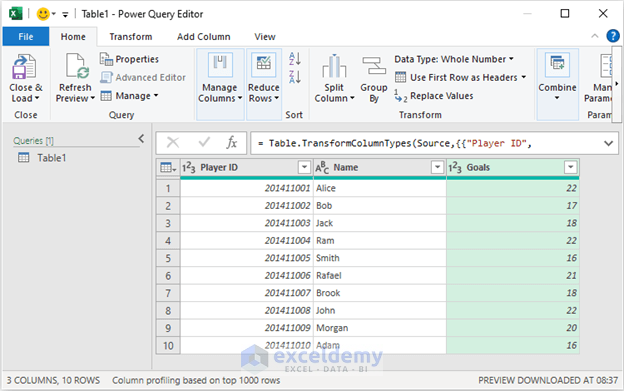
- You can transform this into an Excel file just like we have shown in the previous method.
Working with Text Strings
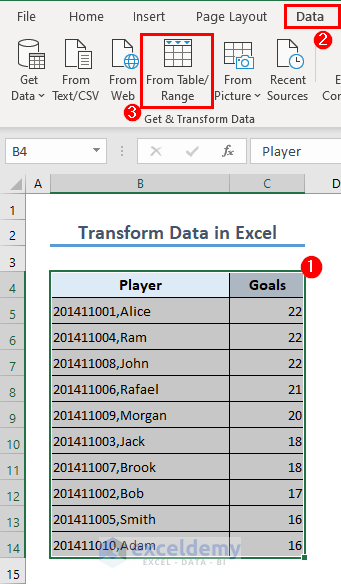
We have a dataset that contains the Player ID and Name in a cell, delimited by a comma. Let’s split the values in separate columns.
- Select the range B4:C14.
- Go to the Data tab and select From Table/Range.
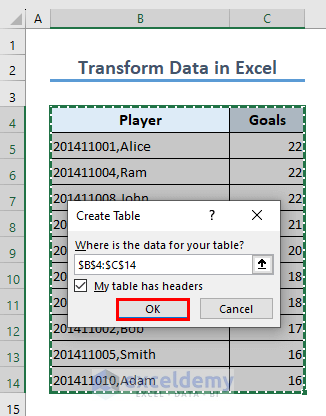
- A Create Table box will appear.
- Mark My table has headers and click OK.
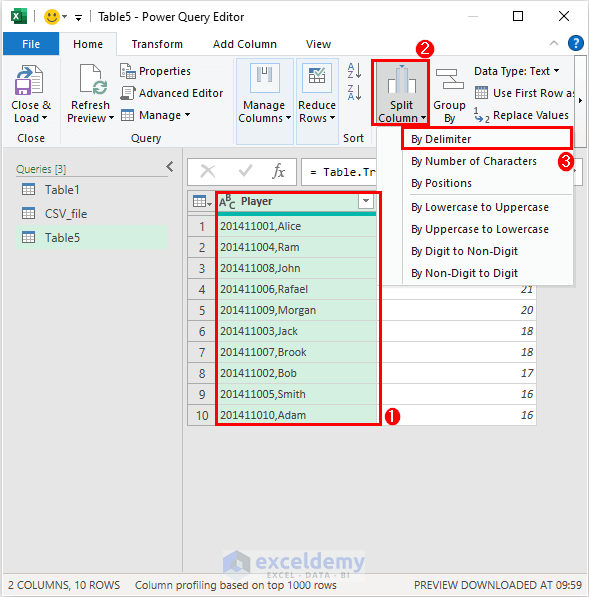
- Excel will open the Power Query Editor.
- To split a column, select it and click Split Column.
- Choose the By Delimiter option.
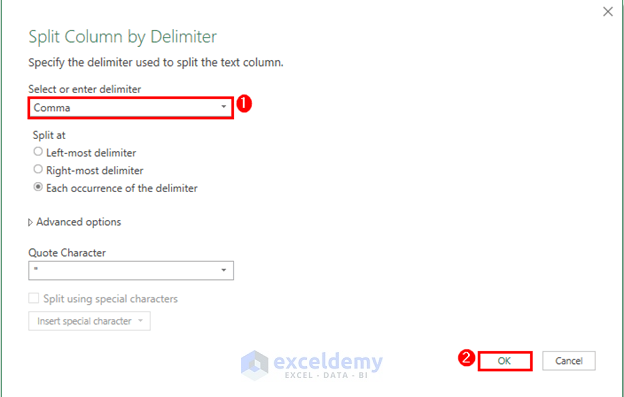
- A box will pop up.
- Choose the delimiter and click OK.
- Rename the newly created columns.
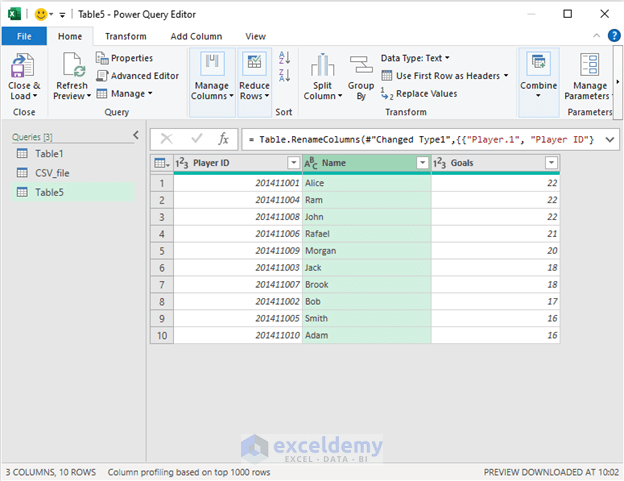
- Transform the dataset into an Excel worksheet.

Things to Remember
- Power Query is available in Excel 2010 and later versions, and it is integrated into Power BI.
- CSV files store data in a plain text format with values separated by commas or other specified delimiters.
- Be cautious with transposing large data sets, as it can affect the structure and formatting of your data.
Frequently Asked Questions
How important is working with text strings in data transformation?
Working with text strings is crucial in data transformation as it allows you to extract and manipulate information from text-based data, such as extracting specific words, splitting text into columns, or combining text values.
How is Power Query different from Excel functions?
Power Query is specifically designed for data transformation and offers a more robust and scalable approach compared to traditional Excel functions. It provides a user-friendly interface and advanced capabilities for handling large datasets, complex transformations, and merging data from multiple sources.
Can I automate data refresh in Power Query?
Yes, Power Query allows you to automate data refresh so that your queries stay up to date. You can schedule refreshes at specific time intervals or set them to refresh upon opening the workbook or on-demand.
Transform Data in Excel: Knowledge Hub
- Get and Transform Data
- Difference Between Load and Transform Data
- Transform Data to Normal Distribution
- Arcsine Transform Data in Excel
Conclusion
To sum it up, Excel provides easy and simple techniques to transform data in Excel. In this article, we explored helpful Excel functions for performing calculations.
We also discovered Power Query, a useful tool for advanced data transformation, and learned about VBA macros for custom automation. Through practical examples, we learned how to calculate square roots, cubic roots, perform arcsine transformations, and convert columns to rows.
Additionally, we explored the Get and Transform tool, which simplifies data extraction and loading. Lastly, we emphasized the importance of working with text strings in data transformation. By using these techniques, you can utilize the power of Excel to transform your data effortlessly.
<< Go Back to Power Query Excel | Learn Excel
Get FREE Advanced Excel Exercises with Solutions!
