
Image by Editor
Excel is one of the most widely used tools for data analysis, while Power BI is a powerful business intelligence tool that can help transform raw data into actionable insights. By integrating these two tools, you can combine the flexibility of Excel’s familiar interface and calculation capabilities with Power BI’s advanced visualization and business intelligence features.
In this tutorial, we’ll explore how integrating Power BI with Excel can significantly enhance your data toolkit.
Why Integrate Power BI with Excel:
Integrating Power BI with Excel allows you to:
- Leverage Power BI’s data visualization tools to enhance your Excel reports.
- Use Excel’s powerful data manipulation features alongside Power BI’s dynamic visualizations.
- Create interactive dashboards from your Excel data.
- Share and publish reports easily via Power BI without losing the flexibility of Excel.
- Automate and refresh data from multiple sources.
Import Data from Excel into Power BI
The first step in integrating Power BI with Excel is to import your Excel data into Power BI.
- Open Power BI Desktop.
- Go to the Home tab >> from Get Data >> choose Excel.
- Browse to the location of your Excel file and click Open.

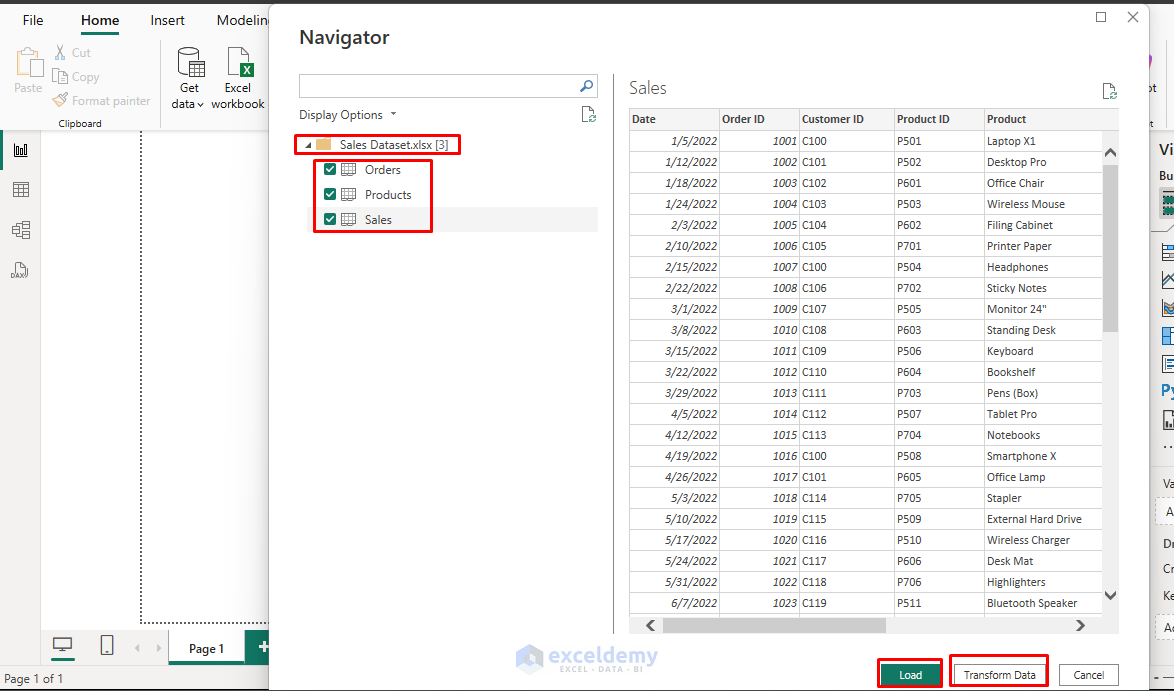
- In the Navigator window, select the worksheets or tables you want to import.
- Click Load to import the data or Transform Data to make adjustments before importing.
Power BI will load the data from your Excel file, and you can begin analyzing it using the various data visualization features available in Power BI.
Use Power Query for Data Transformation
Power Query in Power BI allows you to clean and transform data before visualizing it. This is especially helpful when working with complex data or large datasets from Excel.
- Click Transform Data to open Power Query Editor.
- You can perform various transformations such as removing columns, filtering data, grouping rows, and merging tables.
- Once the data is transformed >> click Close & Apply to load the changes into Power BI.

Create Power BI Visualizations with Excel Data
Once the data is imported into Power BI, you can start creating powerful visualizations.
- Create a New Report:
- Select Report view from the left panel.
- Choose a visualization type from the Visualizations pane (e.g., Bar Chart, Line Chart, Pie Chart).
- Drag Fields into the Visualizations:
- From the Fields pane, drag the fields you imported from Excel onto the blank report canvas.
- Customize the visualization with different formatting options, including colors, labels, and titles.

Publish Excel Reports to Power BI Service
After creating visualizations and reports in Power BI Desktop, you can publish them to the Power BI Service for sharing and collaboration.
- Go to the Home tab >> click Publish.
- Insert your email address (work/school account).
- Select the workspace where you want to publish the report.

The report will now be available in the Power BI Service, where you can share it with other users or embed it into other applications.
Use Power BI’s Excel Add-In
Power BI provides an Excel Add-in called Power BI Publisher for Excel, which lets you pin Excel ranges, charts, and pivot tables directly to Power BI dashboards.
- Install Power BI Publisher for Excel:
- Download the add-in from the Power BI website.
- Pin Excel Data to Power BI:
- Open your Excel file and select the range or chart you want to pin.
- On the Power BI tab >> click Pin from the Power BI ribbon.
- Choose the destination dashboard.
- Name your visualization and click Pin.
- Select the Power BI workspace where you want to pin the data.
This integration lets you bring Excel content directly into Power BI for more advanced visualization and analysis.
Connect Excel to Power BI Datasets
This method allows you to use Excel as a front-end analysis tool for data already in Power BI.
- Open Excel.
- Go to the Data tab >> select Get Data >> select From Power BI dataset.
- Sign in to your Power BI account if prompted.
- Select the dataset you want to connect to.
- Choose which tables and fields to include.
- Create PivotTables or other Excel tools with this connected data.
Advanced Integration Techniques
Implementing DirectQuery Mode
DirectQuery allows Power BI to connect directly to your data source without importing data:
- When connecting to your data source in Power BI, select DirectQuery instead of Import.
- Create your Power BI reports as usual.
- Data will be queried in real-time when users interact with reports.

Creating a Data Model with Excel and Power BI
- Build your data model in Excel using Power Pivot.
- Import this model into Power BI.
- Open the Model view from the left pane.
- Enhance the model with additional visualizations and capabilities in Power BI.
- Share the enhanced model with your team.

Automating Data Refresh
Data in Power BI can be refreshed automatically from Excel, ensuring that your reports are always up to date.
- Store your Excel file in OneDrive, SharePoint, or another supported location.
- In the Power BI Service >> go to the dataset settings.
- Configure the refresh schedule (frequency depends on your Power BI license).
- Under Scheduled Refresh, enable the refresh frequency (e.g., daily, weekly).
- Set up refresh failure notifications.
- Power BI will automatically import the latest data from your Excel file.
Conclusion
By integrating Power BI with Excel, you can significantly enhance your data analysis and reporting capabilities. Power BI’s powerful visualization features complement Excel’s flexibility in data manipulation, creating a robust data toolkit. You can easily import, transform, visualize, and share your Excel data using Power BI’s intuitive interface. Whether you’re working on business reports, data analysis, or forecasting, this integration provides all the tools you need to take your data to the next level.
Get FREE Advanced Excel Exercises with Solutions!
