Introduction to Database Functions in Excel
Excel provides several database functions that allow you to perform operations on specific data ranges. These functions are useful for tasks like summing, averaging, and counting data within a database. Here are the 12 database functions available in Excel:
- DSUM: Calculates the sum of values in a specified field based on given criteria.
- DAVERAGE: Computes the average of values in a field that meet specific conditions.
- DCOUNT: Counts the number of records that satisfy certain criteria.
- DCOUNTA: Counts non-empty records based on specified conditions.
- DGET: Retrieves a single value from a database based on criteria.
- DMAX: Finds the maximum value in a field that meets specified conditions.
- DMIN: Determines the minimum value in a field based on given criteria.
- DPRODUCT: Multiplies values in a field that satisfy certain conditions.
- DSTDEV: Calculates the standard deviation of values in a field with specified criteria.
- DSTDEVP: Calculates the standard deviation of an entire population in a field.
- DVAR: Computes the variance of values in a field based on given conditions.
- DVARP: Calculates the variance of an entire population in a field.
Each of these functions starts with the letter “D,” which stands for “Database.”
Function Arguments
All database functions share the same arguments. Let’s take the example of the DSUM function:
Syntax:
Arguments:
- database: Refers to the data range or list on which you want to perform the operation. You can use cell references or named ranges.
- field: Specifies the column within the database from which results will be returned. You can provide the column header (enclosed in double quotes), the column number, or the cell reference of the column header.
- criteria: This range contains the specified conditions. The function pulls data only from cells that satisfy these criteria. You can use operators like >, <, =, <>, etc., to set multiple criteria.
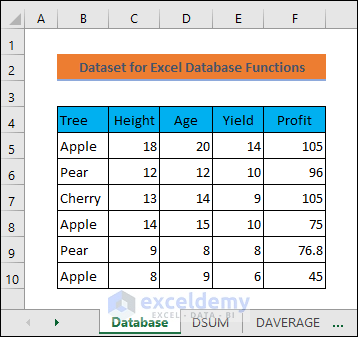
Dataset Overview
To demonstrate how to use these functions, we’ll work with a sample dataset.
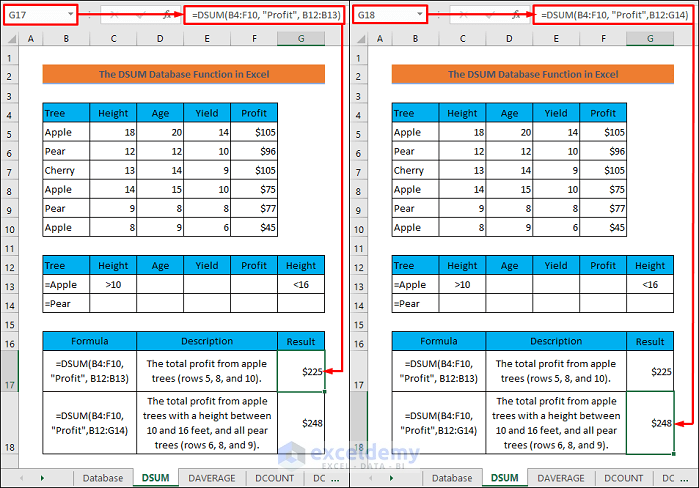
1. The DSUM Function
The DSUM function allows you to add numbers from a specific field (column) of records in a database that meet certain conditions. Here’s how to use it:
- Create a Criteria Range: Before using any database function, set up a criteria range. In this case, we’ll use cells B12 to G12 for headers like Tree, Height, Age, Yield, and Profit.
- Specify Criteria:
- Enter =Apple in cell B13 to include apple trees.
- Use >10 and <16 in cells C13 and G13 to filter apple trees with heights between 10 and 16.
- Calculate the Sum of Profits:
- In cell G17, enter the following formula:
=DSUM(B4:F10, "Profit", B12:B13)This will give you the sum of profits from apple trees meeting the specified criteria.
- Sum of Profits for Apples and Pears:
- In cell G18, enter this formula:
=DSUM(B4:F10, "Profit",B12:G14)This calculates the sum of profits from both apple and pear trees within the given height range.
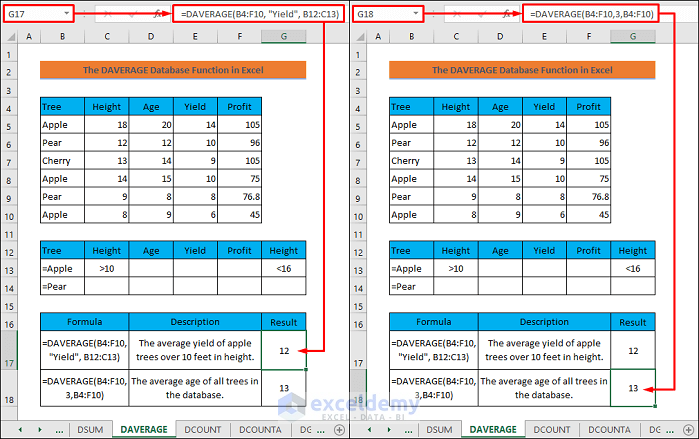
2. The DAVERAGE Function
The DAVERAGE function computes the average of values in a column based on specified conditions:
- To find the average yield of apple trees taller than 10 feet, enter this formula in cell G17:
=DAVERAGE(B4:F10, "Yield", B12:C13)- To get the overall average yield for all trees, enter this formula in cell G18:
=DAVERAGE(B4:F10,3,B4:F10)Here, 3 refers to the third column (Yield) in the database.
3. The DCOUNT Function
The DCOUNT function counts cells containing numbers in a field (column) that match specific conditions:
- To count the cells in the Age column corresponding to apple trees with heights between 10 and 16, enter this formula in cell G17:
=DCOUNT(B4:F10, "Age", B12:G13)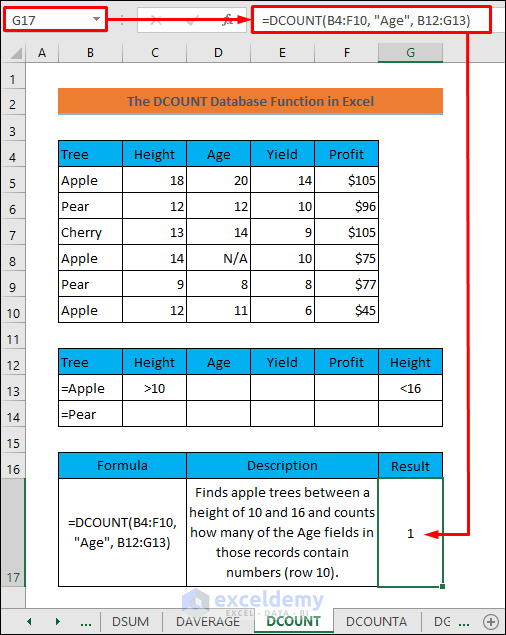
4. The DCOUNTA Function
The DCOUNTA function counts non-blank cells in a specified field (column) of records in a database that match certain conditions.
- To count non-blank cells in the Profit column corresponding to apple trees with heights between 10 and 16, enter this formula in cell G17:
=DCOUNTA(B4:F10, "Profit", B12:G13)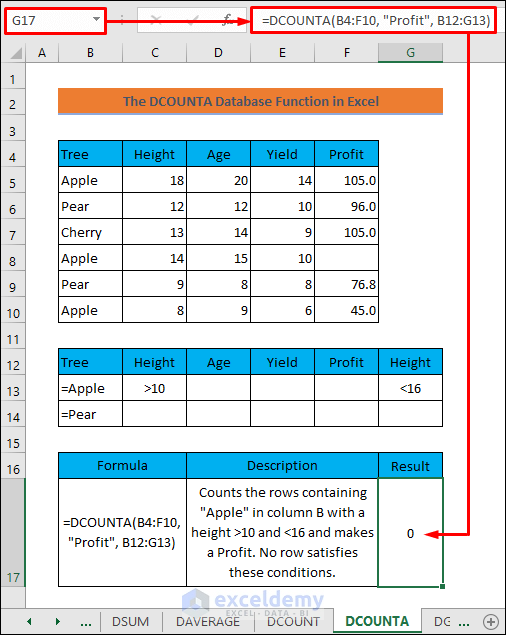
5. The DGET Function
The DGET function extracts a single record from a database based on specified conditions, similar to lookup functions.
- To get the yields for both apple and pear trees, enter this formula in cell G17:
=DGET(B4:F10, "Yield", B12:B14)Note: That it returns a #NUM error if multiple values satisfy the conditions.
- For a single result meeting the criteria, enter this formula in cell G18:
=DGET(B4:F10,4,B12:G14)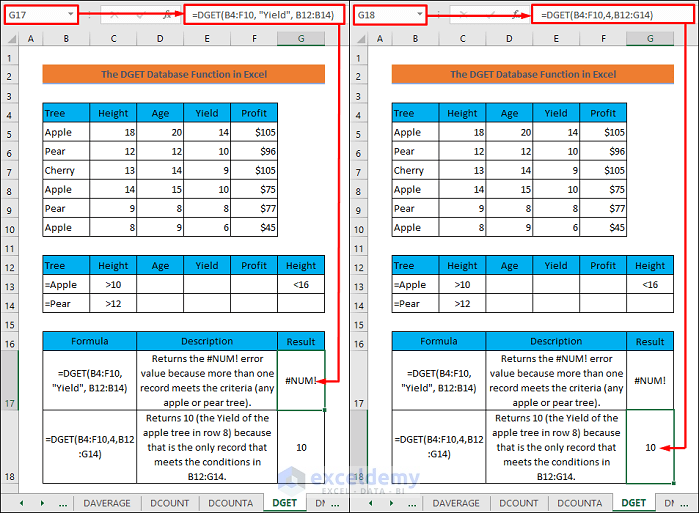
6. The DMAX Function
The DMAX function returns the largest value in a specified field (column) of records in the database.
- To find the maximum profit from all pear trees and apple trees with heights between 10 and 16, enter this formula in cell G17:
=DMAX(B4:F10, "Profit", B12:G14)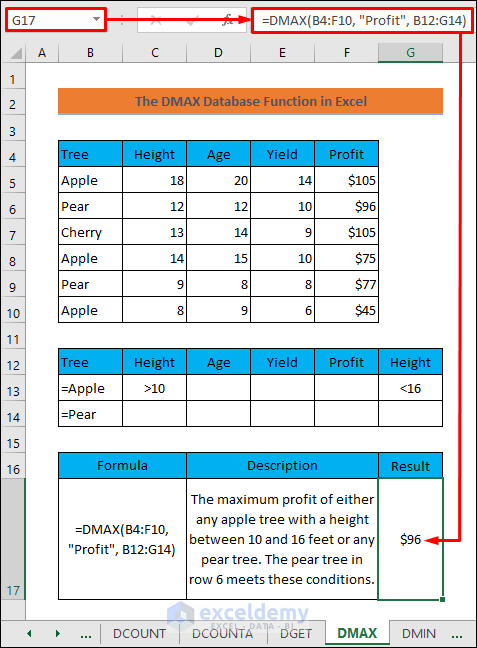
7. The DMIN Function
The DMIN function returns the smallest value in a specified field based on given conditions.
- To get the minimum profit from all pear trees and apple trees with heights between 10 and 16, enter this formula in cell G17:
=DMIN(B4:F10, "Profit", B12:C13)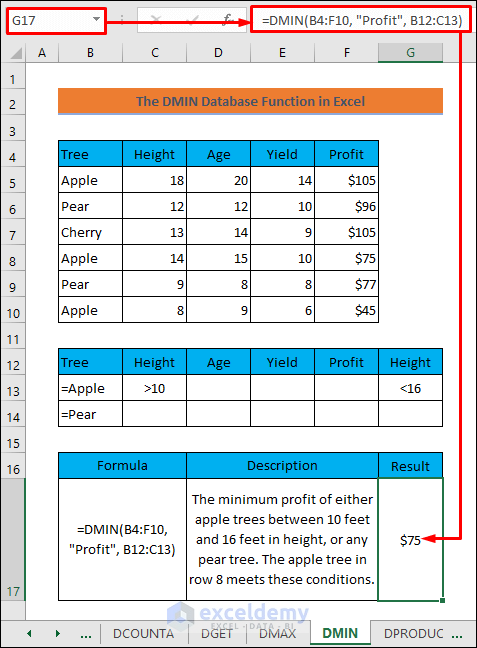
8. The DPRODUCT Function
The DPRODUCT function multiplies values in a specified field (column) of records in the database.
- To calculate the product of yields from all pear trees and apple trees with heights between 10 and 16, enter this formula in cell G17:
=DPRODUCT(B4:F10, "Yield", B12:G14)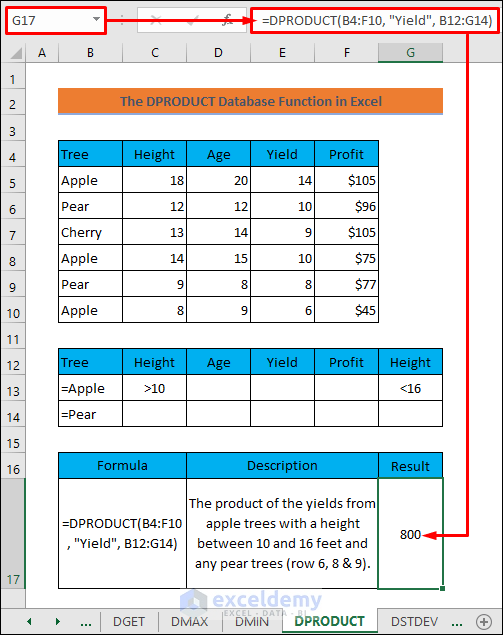
9. The DSTDEV Function
The DSTDEV function estimates the standard deviation based on a sample from selected database entries.
- To calculate the standard deviation of yields from all pear trees and apple trees with heights between 10 and 16 (based on a sample), enter this formula in cell G17:
=DSTDEV(B4:F10, "Yield", B12:B14)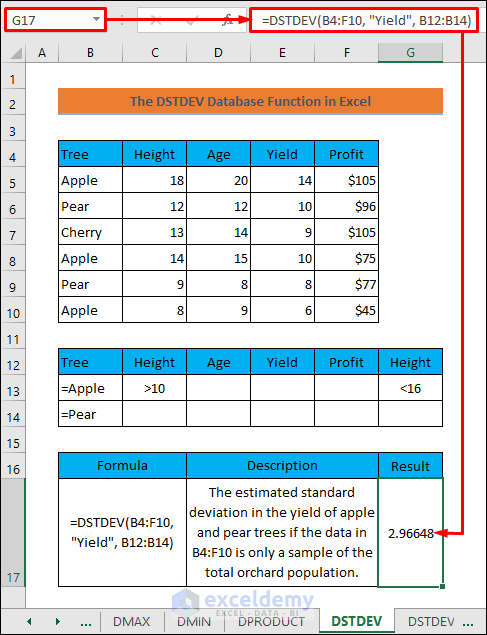
10. The DSTDEVP Function
The DSTDEVP function calculates the standard deviation based on the entire population of selected database entries.
- To find the standard deviation of yields from all pear trees and apple trees with heights between 10 and 16 (using the entire population), enter this formula in cell G17:
=DSTDEVP(B4:F10, "Yield", B12:B14)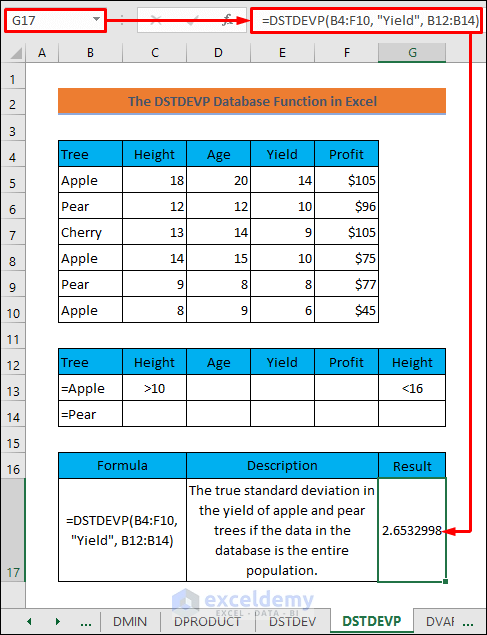
11. The DVAR Function
The DVAR function estimates variance based on a sample from selected database entries.
- To determine the variance of yields from all pear trees and apple trees with heights between 10 and 16 (sample-based), enter this formula in cell G17:
=DVAR(B4:F10, "Yield", B12:B14)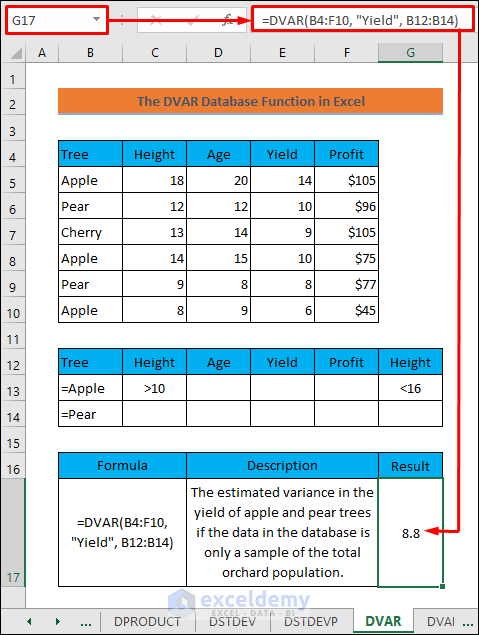
12. The DVARP Function
The DVARP function calculates variance based on the entire population of selected database entries.
- To compute the variance of yields from all pear trees and apple trees with heights between 10 and 16 (population-based), enter this formula in cell G17:
=DVARP(B4:F10, "Yield", B12:B14)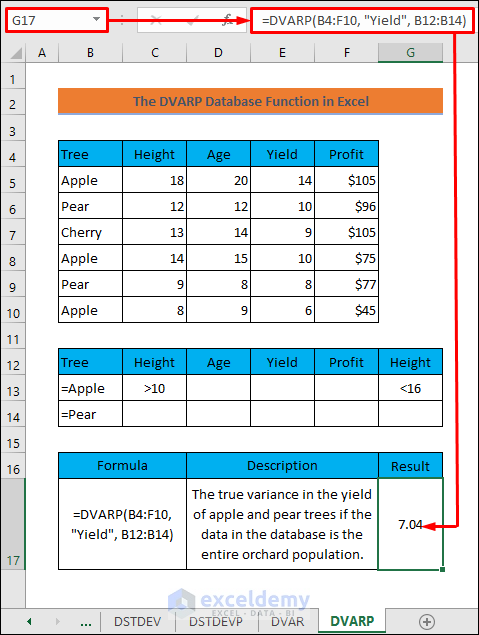
Things to Remember
- Avoid blank rows in the criteria range; otherwise, the function may disregard specified conditions.
- You can use wildcards as criteria (e.g., A* indicates texts starting with the letter A).
Download Practice Workbook
You can download the practice workbook from here:
<< Go Back to Excel Database Functions | Excel Functions | Learn Excel
Get FREE Advanced Excel Exercises with Solutions!

Thank you for this informative post! I often struggled with using database functions in Excel, but your examples made it so much clearer. I especially appreciated the breakdown of each function and the practical scenarios you provided. Can’t wait to implement these tips in my next project!
Hello,
You are most welcome. Thanks for your appreciation. Glad to hear that you will apply the examples in your project. Keep learning Excel with ExcelDemy!
Regards
ExcelDemy