
A Kanban board is a visual project management tool that helps teams track work progress through different stages. While tools like Trello or Jira are common, you can also build a fully functional Kanban board in Excel. Excel offers a flexible, accessible alternative that can be customized to your specific needs without additional software costs.
This tutorial shows how to turn Excel into a Kanban board for agile project tracking.
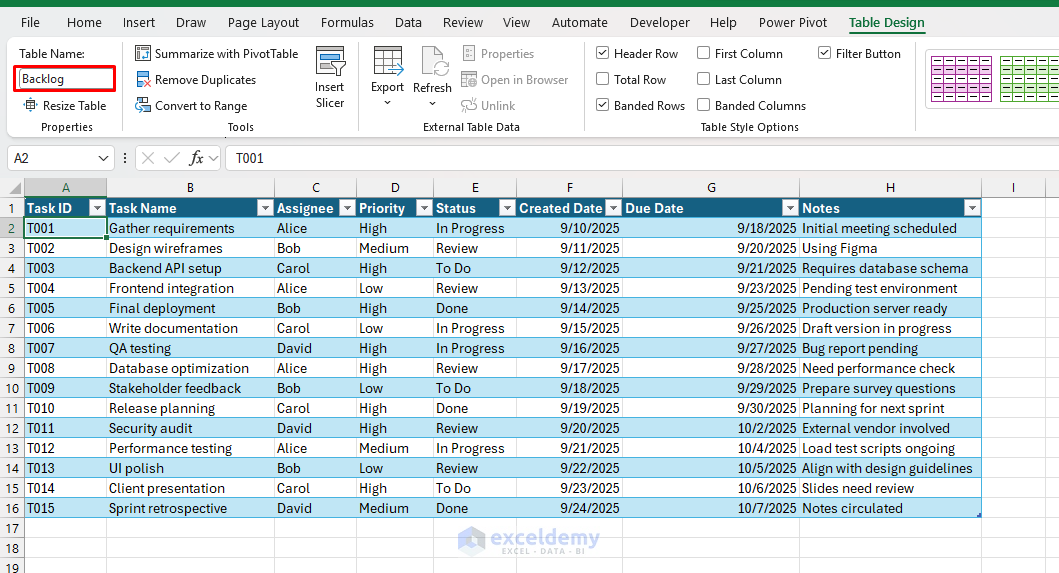
Step 1: Create the Task (Backlog) Dataset
Creating the Backlog Dataset:
Before designing the board, start with a dataset that lists all tasks.
- Create a sheet and name it Backlog
- Insert the following columns
- Task ID
- Task Name
- Assignee
- Priority
- Status
- Created Date
- Due Date
- Notes
You can insert other columns based on your project type.
Set Up the Data Lists (Powering Dropdowns):
- Create a sheet named Data
- In separate columns, list the following information
- Status: To Do, In Progress, Review, Done
- Priority: Low, Medium, High
- Assignee: Your team members
- You can define named ranges, or select the ranges to create a drop-down list in the Kanban board
![]()
Apply Data Validation:
- Go to the Data tab >> select Data Validation
- For Assignee:
- Allow: List
- Source: =Data!$C$2:$C$5
- Click OK
![]()
- For Priority:
- Allow: List
- Source: =Data!$B$2:$B$4
- For Status:
- Allow: List
- Source: =Data!$A$2:$A$5
![]()
You can select any of these values instead of typing. It also helps maintain data integrity.
Step 2: Create the Kanban Board
- Open a new sheet and name it Kanban Board
- Across the top row, create your workflow stages as headers:
- B1: “To Do”
- C1: “In Progress”
- D1: “Review”
- E1: “Done”
- Make headers bold and centered, and give them a background color (for example, dark blue with white text)
- Adjust column widths (about 30–35) so cards fit nicely
- Leave enough space below each column to display multiple task cards
![]()
Step 3: Build Dynamic Task Cards Using Excel Functions
We will use formulas to automatically pull tasks from the dataset into the correct Kanban column. If you’re using Excel 365/2021, use FILTER to populate tasks dynamically.
- In cell B2 (To Do):
- You can use this formula to show only the task name
=FILTER(Backlog!B2:B100, Backlog!E2:E100="To Do")
- Instead of showing just the task name, you can combine multiple details
=FILTER(Backlog!B2:B100 & CHAR(10) & "[" & Backlog!C2:C100 & "] " & CHAR(10) & "Created: " & TEXT(Backlog!F2:F100,"dd-mmm") & " | Due: " & TEXT(Backlog!G2:G100,"dd-mmm"), Backlog!E2:E100="To Do")
- In cell C2 (In Progress):
=FILTER(Backlog!B2:B100 & CHAR(10) & "[" & Backlog!C2:C100 & "] " & CHAR(10) & "Created: " & TEXT(Backlog!F2:F100,"dd-mmm") & " | Due: " & TEXT(Backlog!G2:G100,"dd-mmm"), Backlog!E2:E100="In Progress")
- In cell D2 (Review):
=FILTER(Backlog!B2:B100 & CHAR(10) & "[" & Backlog!C2:C100 & "] " & CHAR(10) & "Created: " & TEXT(Backlog!F2:F100,"dd-mmm") & " | Due: " & TEXT(Backlog!G2:G100,"dd-mmm"), Backlog!E2:E100="Review")
- In cell E2 (Done):
=FILTER(Backlog!B2:B100 & CHAR(10) & "[" & Backlog!C2:C100 & "] " & CHAR(10) & "Created: " & TEXT(Backlog!F2:F100,"dd-mmm") & " | Due: " & TEXT(Backlog!G2:G100,"dd-mmm"), Backlog!E2:E100="Done")
![]()
- CHAR(10) inserts a line break inside cells
- Enable Wrap Text to make line breaks visible
These formulas (available in Excel 365 and Excel 2021) automatically update when the Status changes in your dataset.
If you’re using older Excel versions, replace FILTER with helper columns plus INDEX/MATCH.
Step 4: Format Kanban Cards in Excel
Let’s format each task cell to look like a card using Excel’s formatting features.
Adjust Cell Size:
- Select the range where your Kanban tasks will appear
- Go to Home tab >> select Format >> select Row Height >> set to around 60
![]()
- Go to Home tab >> select Format >> select Column Width >> set to around 30–35
![]()
This creates space inside each cell, similar to a rectangular card.
Adjust Alignment:
- Turn on Wrap Text
- Go to Home tab >> select Alignment >> select Wrap Text so long task names stay inside the card
![]()
- Go to the Home tab >> select the Alignment group:
- Horizontal alignment: Center
- Vertical alignment: Top
![]()
Now the text can show on multiple lines and sits neatly inside like on a Trello card.
Add Borders:
- Go to the Home tab >> select Borders >> select More Borders…
![]()
- In the dialog box:
- Choose a line style
- Select a color if you want
- Apply it to the Outline (so each card has a box around it)
- Click OK
![]()
This makes each cell look like a card container.
![]()
Step 5: Add Priority Coloring
Use Conditional Formatting to make priorities stand out:
- Select your Kanban board area
- Go to the Home tab >> select Conditional Formatting >> select New Rule
- Select Use a formula to determine which cells to format
=IFERROR(INDEX(Backlog!$D$2:$D$100, MATCH(LEFT(B2, FIND(CHAR(10), B2&CHAR(10)) - 1), Backlog!$B$2:$B$100, 0)) = "High", FALSE)
- Click Format >> choose your fill (for example, red)
- Click OK
![]()
- Repeat with the same formula, replacing “High” with “Medium” (orange) and “Low” (green)
Medium Priority:
=IFERROR(INDEX(Backlog!$D$2:$D$100, MATCH(LEFT(B2, FIND(CHAR(10), B2&CHAR(10)) - 1), Backlog!$B$2:$B$100, 0)) = "Medium", FALSE)
Low Priority:
=IFERROR(INDEX(Backlog!$D$2:$D$100, MATCH(LEFT(B2, FIND(CHAR(10), B2&CHAR(10)) - 1), Backlog!$B$2:$B$100, 0)) = "Low", FALSE)
![]()
- Now priority automatically colors each card
![]()
Step 6: Track Overall Progress
You can create a summary table above or below the board:
- To Do:
=COUNTIF(Backlog!E:E,"To Do")
- In Progress:
=COUNTIF(Backlog!E:E,"In Progress")
- Review:
=COUNTIF(Backlog!E:E,"Review")
- Done:
=COUNTIF(Backlog!E:E,"Done")
![]()
This gives a quick snapshot of how many tasks are in each stage.
- Experiment with colors and select the palette that best suits your Kanban board
![]()
Test the Kanban Board:
- Update the Backlog data
- Change To Do to In Progress and In Progress to Review
![]()
- The Kanban board automatically updates the changes
![]()
- Change a task’s priority to verify the automatic color update
![]()
- Card colors update automatically
![]()
Conclusion
By following the steps above, you can turn Excel into a Kanban board for agile project tracking. It is a cost-effective, customizable solution that integrates well with other Excel dashboards and is useful for small to medium teams.
While it requires some initial setup time, the flexibility and familiar interface make it an excellent choice for teams already comfortable with Excel.
Get FREE Advanced Excel Exercises with Solutions!

Why not use an Excel table in the Backlog worksheet, so as to avoid having to consider long columns that may need adjusting one day, while leaving the auto-adjusting to the table itself?
Hello Giorgio,
That’s a very good observation! I usually prefer using Excel Tables as well. In this case, I intentionally kept the Backlog as a regular range to make it simpler for users who are new to Excel or Kanban boards. This approach avoids automatic table behavior (like structured references) that might confuse beginners with formulas, while still keeping the setup flexible.
If you are comfortable with table, you can easily turn the backlog data into table. Then update the formulas with the structured reference.
Regards,
ExcelDemy
Thanks for clarifying, Shamima. That makes total sense. Keep up the good work!
Hello Giorgio,
You are most welcome. Thanks for your feedback and appreciation. Keep exploring Excel with ExcelDemy!
Regards,
ExcelDemy
Really good and I found some formulars looking at the wrong column but easy fix.
My question is in the kanban tab the formular is looking at rows up to 100 in the backlog tab. Will I need to change this to say 1000 to keep the book working after lots of tasks beyond row 100?
Hello James,
Regarding the formulas: in the article, all formulas reference the correct columns based on the Backlog layout shown in the tutorial. If columns are inserted, removed, or reordered in your own file, some formulas may appear to point to the “wrong” column and will need a quick adjustment, which is expected behavior with fixed cell references in Excel.
About the row limit: yes, the Kanban formulas currently look up to row 100 in the Backlog sheet. If you plan to manage more tasks, you can safely extend those ranges (for example, to row 1000).
An even better long-term approach is to convert the Backlog range into an Excel Table press CTRL+T and update the formulas to use structured references so everything expands automatically as you add more tasks.
Regards,
ExcelDemy
Hi, thanks for a great tutorial and handy sheet. Assuming I am using tables, can you please provide a sample of the Kanban formulas that use tables for the lookups?
Hello Neil,
If you are using table, then you can easily mention the backlog data from table.
Name your table Backlog:
To DO Lookup:
Update the other task board following this format.
Regards,
ExcelDemy