The pivot table feature in Microsoft Excel can be used to sort, analyze, and share data, but pivot tables do not calculate median values, which can be important for analyzing growth in an organization. Below, you will learn how to calculate the median in a pivot table.
How to Activate Power Pivot in Excel
In order to use Power Pivot, you must first activate it.
Steps:
- Go to File>> then select Options.
- A dialog box named Excel Options will pop up.
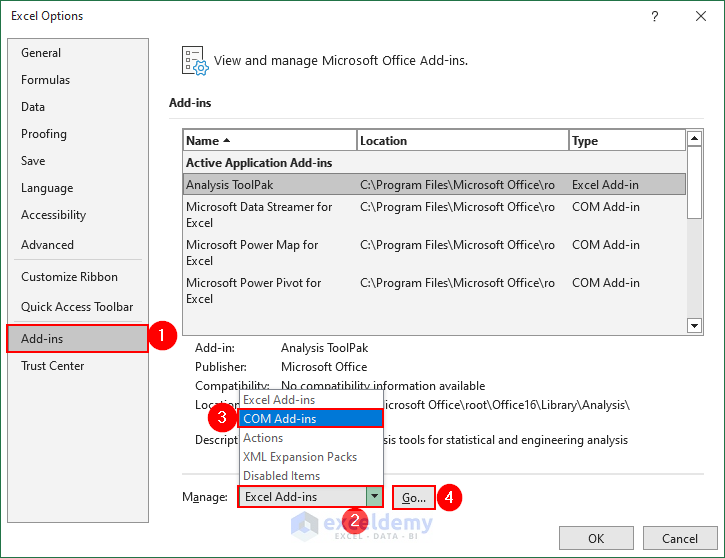
- Click on Add-ins.
- Then select COM Add-ins from the Manage drop-down and click on Go.
- Check the box before Microsoft Power Pivot for Excel and click OK.
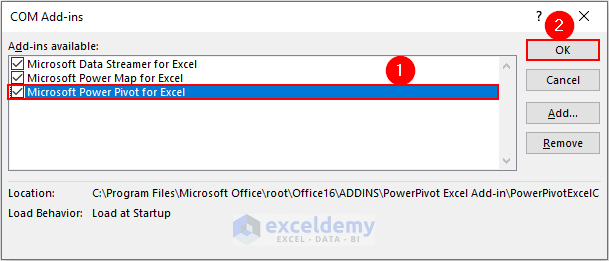
Thus you can activate the Power Pivot in Excel.
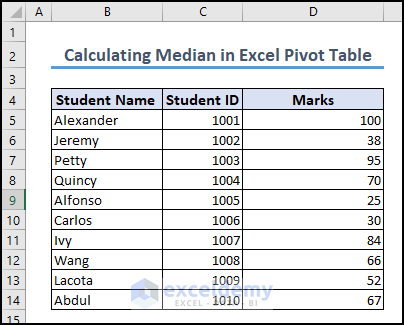
To show you 2 simple ways of calculating the median in Excel Pivot Table, here is a concise dataset consisting of Student Names, Student IDs, and marks.
Method 1 – Calculate Median in Pivot Table by Creating a New Measure Function
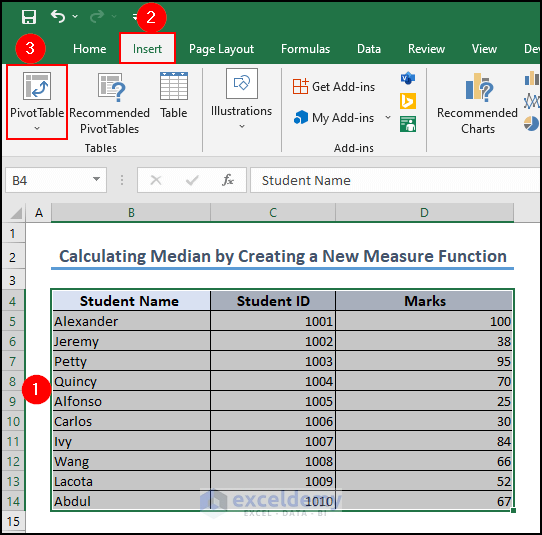
Step 1: Creating Pivot Table from Dataset
- Select the whole dataset.
- Go to Insert tab>> select Pivot Table under Tables option.
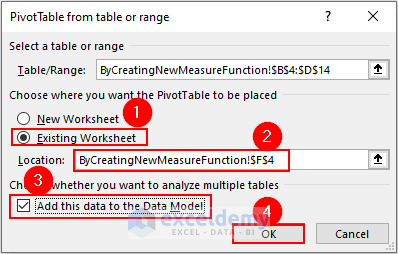
- A dialog box will pop up.
- Select the Location where you want to see your pivot table.
- Check the box beside Add this data to the Data Model option.
- Click OK.
Step 2: Creating a New Measure Function
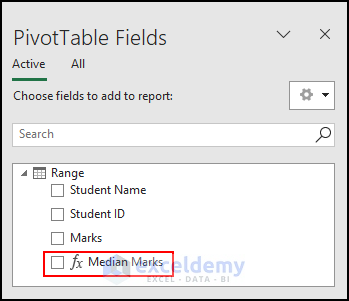
- You will see there’s a different icon and we have the ability to create a measure.
![]()
- Right-click on the icon and click on Add Measure option.
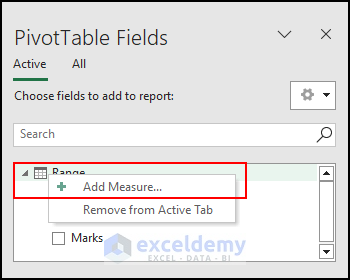
- A dialog box called Measure will pop up.
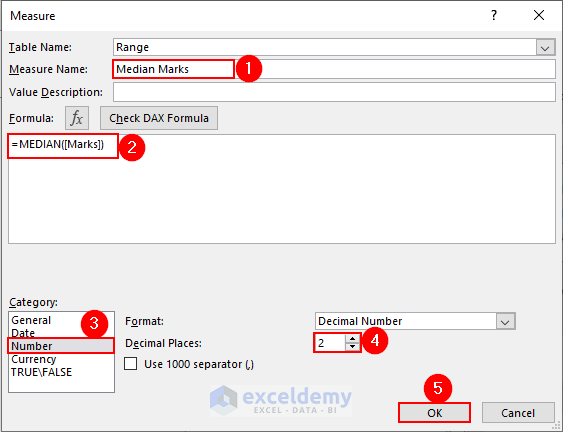
- Add a Measure Name.
- In the Formula box, enter the following formula.
=MEDIAN([Marks])- Select the Category as Number and set Decimal Places as 2.
- Click OK.
- A new measure function will be created like the image below.
Step 3: Calculating Median
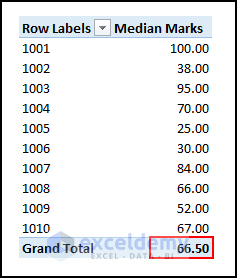
- Put Student ID in Rows and Median Marks in Values.
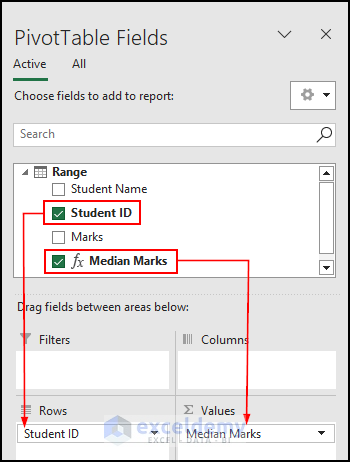
- You will get your pivot table along with your calculated median.

Method 2 – Calculate Median in Pivot Table Using MEDIAN Function
Steps:
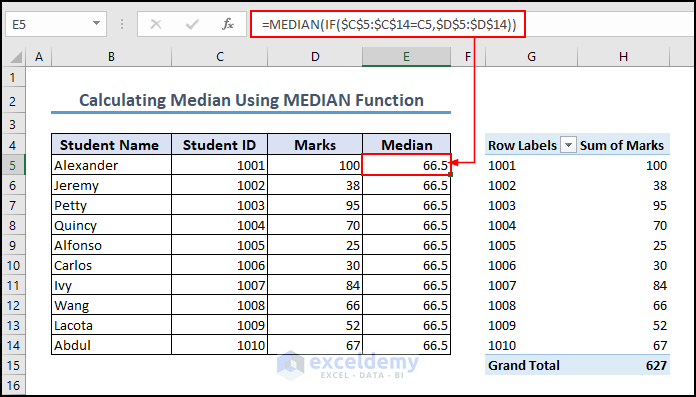
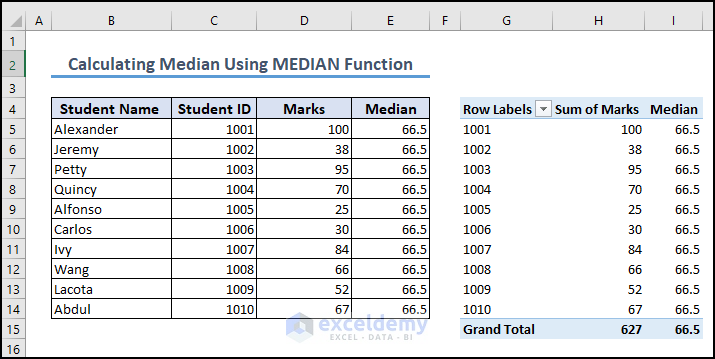
- Insert a new column named Median beside the Marks column.
- Enter the following formula in cell E5.
=MEDIAN(IF($C$5:$C$14=C5,$D$5:$D$14))- AutoFill the rest of the column’s cells, and you will get the median the same as the previously shown method.
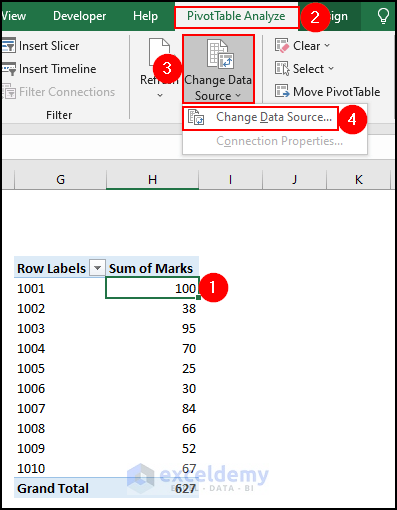
- Select any cell in the pivot table.
- Click PivotTable Analyze>> then Change Data Source drop down>> select Change Data Source.
- A dialog box named Change PivotTable Data Source will appear.
- Specify the new source data in the Table/Range box.
- Click OK.

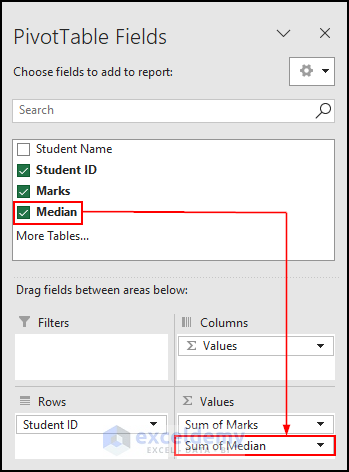
- In the PivotTable Fields pane, the Median field is now available.
- Drag the Median field to the Values section.
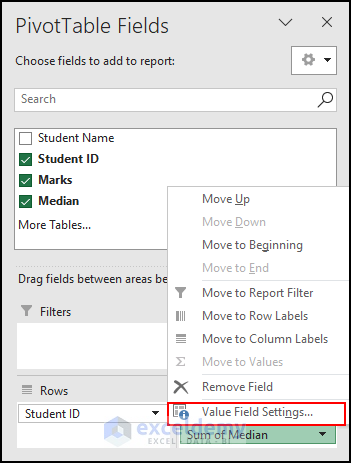
- Select Value Field Settings from the drop-down list under the Median field in the Values section.
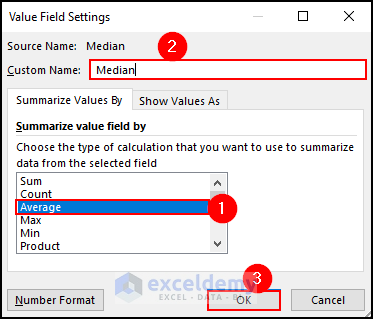
- A dialog box named Value Field Settings will pop up.
- In the Summarize Values By tab, select Average from the Summarize Values By list.
- In the Custom Name box, rename the field name to “Median” (there is a space before Median).
- Click OK.
- In the pivot table, you will now see the median of each row label.
You can use the MEDIAN function to calculate the median in the pivot table.
Read More: How to Create Pivot Table with Values as Text
Frequently Asked Questions
1. What is the formula to find the median from mean?
For Odd Numbers:
- If the set has an odd number of elements, let n be the total number of elements.
- The median is the value of the ((n+1)/2)th item in the given set.
For Even Numbers:
- If the set has an even number of elements, let n be the total number of elements.
- Find the two middle terms: (n/2)th and ((n/2) + 1)th terms.
- Calculate the mean (average) of these two middle terms.
- The median is obtained by taking the mean of the two middle terms: Median = ((n/2)th term + ((n/2) + 1)th term) / 2.
2. What is the median formula for tables?
The median is the mean of the two middle numbers if the number of terms is even. Sort the numbers based on their size. The median is the middle term in an odd number of terms. When there are even terms, add the two middlemost terms and divide by 2.
3. What is the formula 3 median?
Hint: The relationship between mean, median, and mode is known as the empirical relationship.
Download Practice Workbook
You can download the practice workbook from here:

