
Image by Editor
Data cleaning is the essential first step in any data analysis or business intelligence project. Messy, uncleaned data can lead to incorrect conclusions, misleading visualizations, and flawed models.
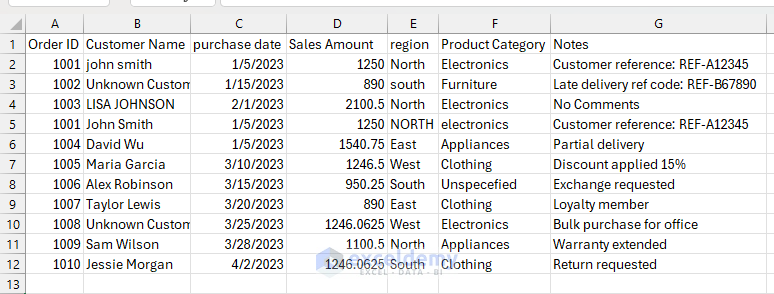
In this tutorial, we will provide a comprehensive data cleaning guide for analysts. You’ll learn how to identify and resolve missing values, duplicates, inconsistent formats, outliers, and data type issues, using both Power Query and Excel formulas.
1. Handle Missing Values
1.1. Find Missing Values
Missing data can significantly skew your analysis.
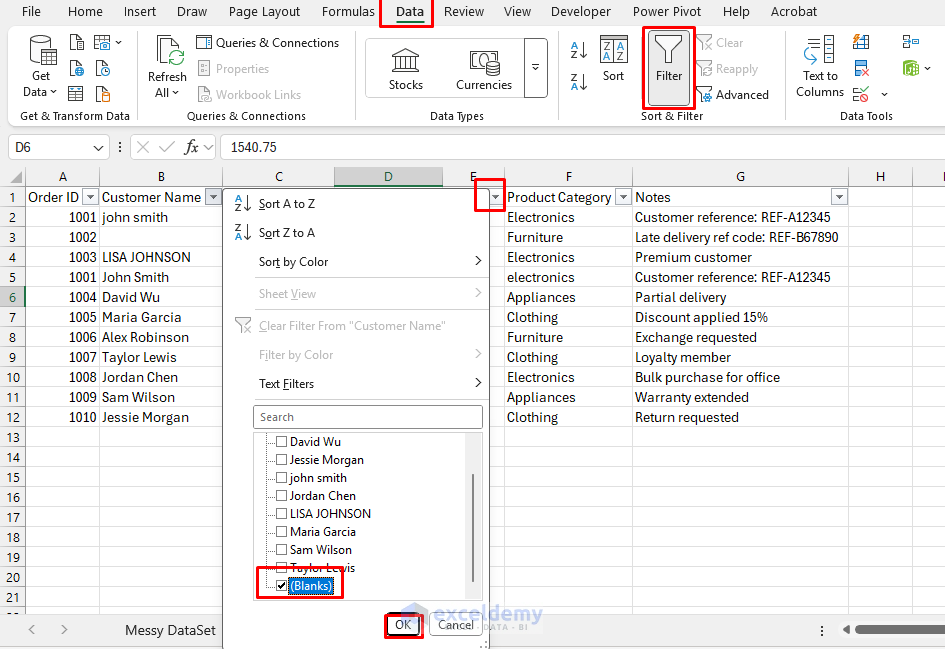
Filter Blanks manually:
- Go to Data tab >> select Filter.
- Click column filter dropdown >> Uncheck Select All >> Check Blanks.
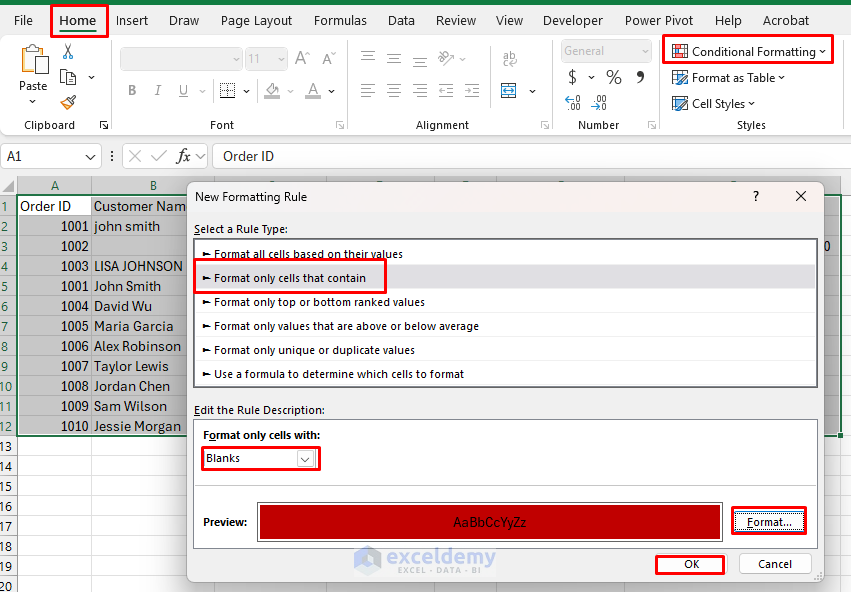
Apply Conditional Formatting:
- Select your data range.
- Go to the Home tab >> select Conditional Formatting >> select New Rule.
- Select the Format only cell that contains.
- Select Blanks.
- Format with a distinctive color (e.g., light red).
- Click OK.
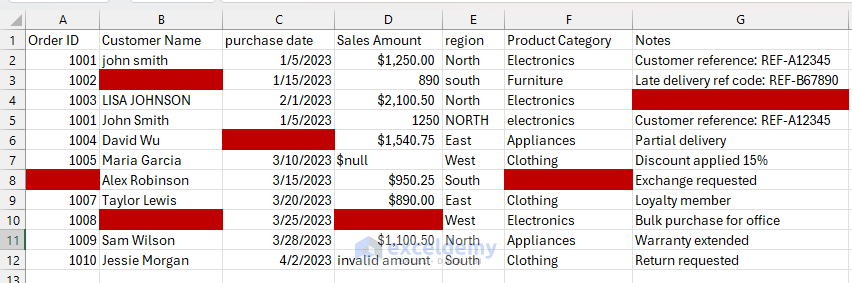
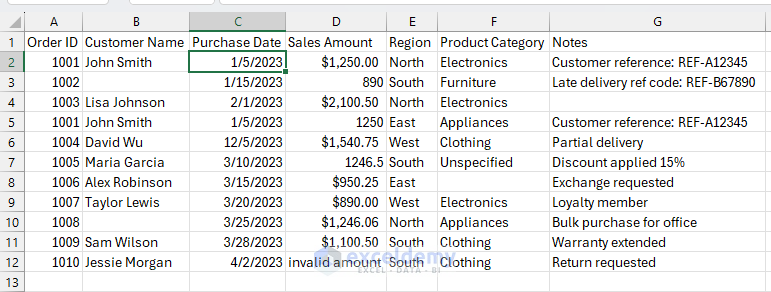
Missing values:
Formula-Based:
Now you can see the blank cells and the problematic null values. You can individually count each column’s null value or count in total.
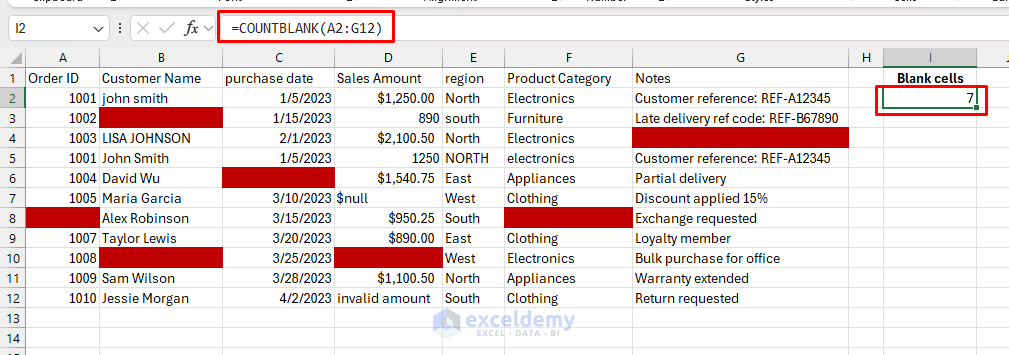
To count missing values in all columns:
- Create a helper column and use the following formula.
Formula:
=COUNTBLANK(A2:G12)
It shows that a total of 7 values are missing.
1.2. Address Missing Values
You can address missing values before removing or deleting them, or after cleaning the entire dataset.
- You should check other records or sources for the customer’s name, category, notes or replace the blank cells with;
- “Unknown Customer”, “N/A”
- Unspecified
- No “Comments”
Insert Date:
- Try to fetch the date from any other related date columns.
- You can find out the purchase date if you know the shipping date.
- Use the following formula:
Formula:
=IF(ISBLANK(C5),H4+2,C5)
- Assuming H4 contains the shipping date.
For numeric fields, you might fill with 0, average, or leave blank:
- Replace the problematic $null sales amount with a blank.
- Select Find & Replace or press Ctrl+H to replace $null and invalid format with a blank.
- Then, calculate the average of the other values in that column as a replacement.
Formula:
=IF(D6=,AVERAGE(D2:D5,D7),D6)
This formula will return the average values in the blank cells.
2. Remove Duplicates
Duplicate entries misinterpret counts and statistics. It’s easy to remove duplicates in Excel.
Identify Duplicates:
- Go to the Home tab >> select Conditional Formatting >> select Highlight Cells Rules >> select Duplicate Values.
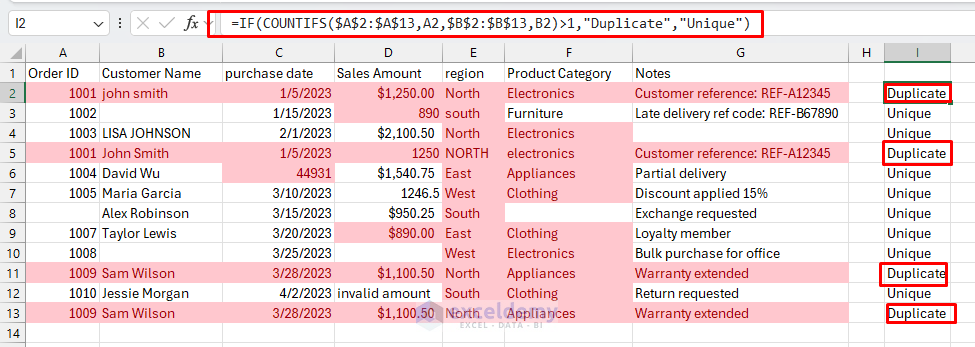
- You can create a duplicate indicator formula:
Formula:
=IF(COUNTIFS($A$2:$A$1000,A2,$B$2:$B$1000,B2)>1,"Duplicate","Unique")
Remove Duplicates:
- First, determine which record to keep (the most complete or the most recent).
- Before removing, consider sorting your data to keep the most recent or most complete records.
- Select your data range.
- Go to the Data tab >> select Remove Duplicates >> select all columns to check >> click OK.
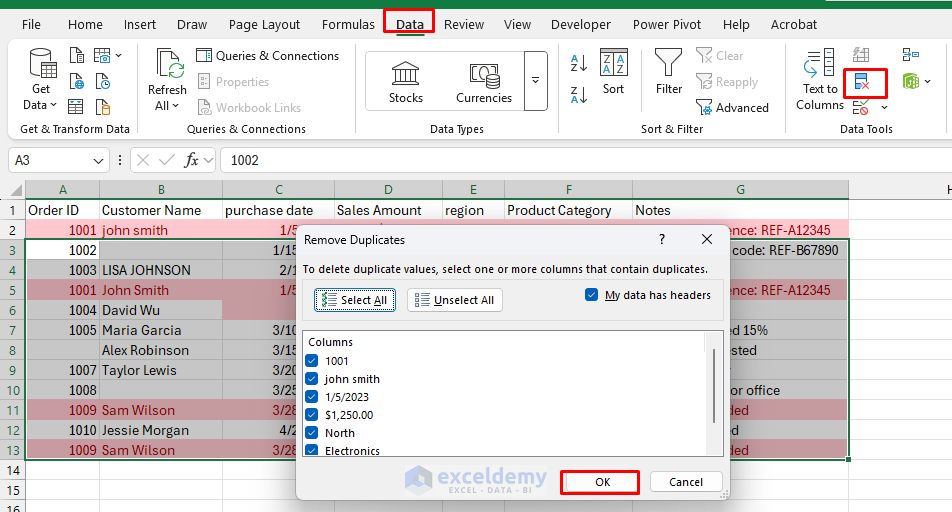
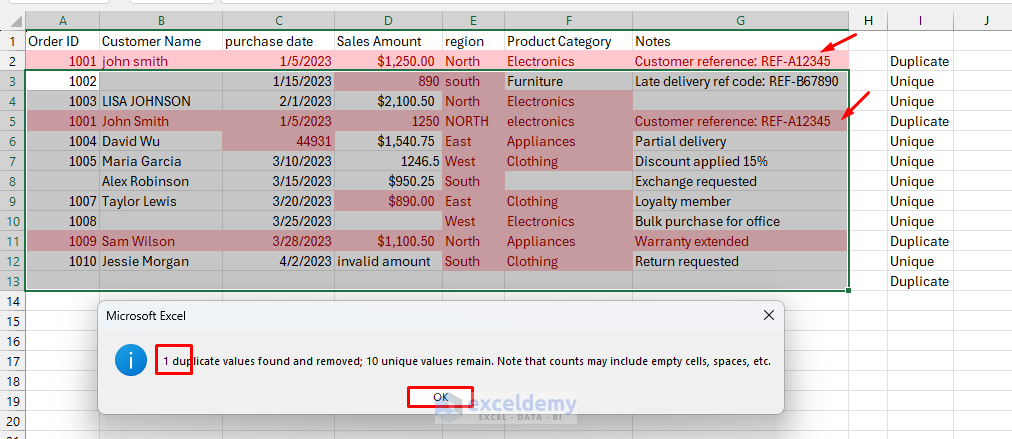
- A notification will appear showing 1 duplicate row found.
- Click OK.
Note:
- The Remove Duplicates feature is case-sensitive. Though we have 2 duplicate rows, it only removes one row because of a case-sensitive issue.
- From the duplicate indicator column, locate the duplicate row and remove it manually.
3. Standardize Text Formats
Inconsistent text makes filtering and analysis difficult. It raises case-sensitivity issues.
Our dataset shows inconsistent capitalization in Customer Names, Region, and Product Category.
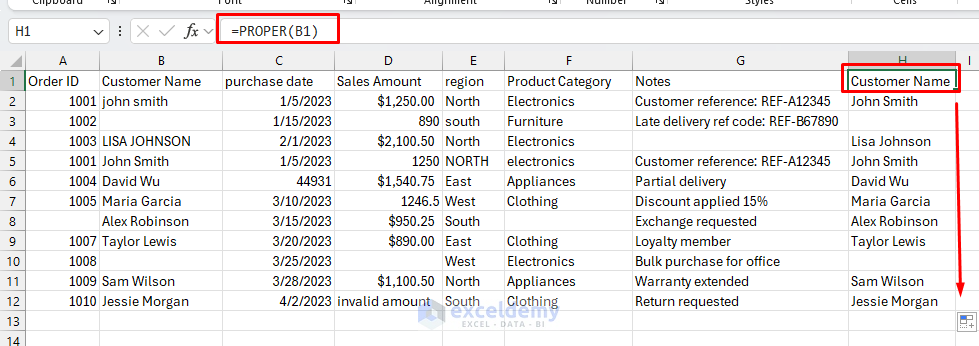
Standardize with Proper Case:
Customer Name:
=PROPER(B1)
It changes john smith to John Smith and LISA JOHNSON to Lisa Johnson.
Region:
=PROPER(E1)
It changes region to Region, NORTH to North, and south to South.
Product Category:
=PROPER(F1)
It changes electronics to Electronics.
Apply to entire columns:
- Enter the formula in the first cell of a helper column.
- Double-click the fill handle to copy down.
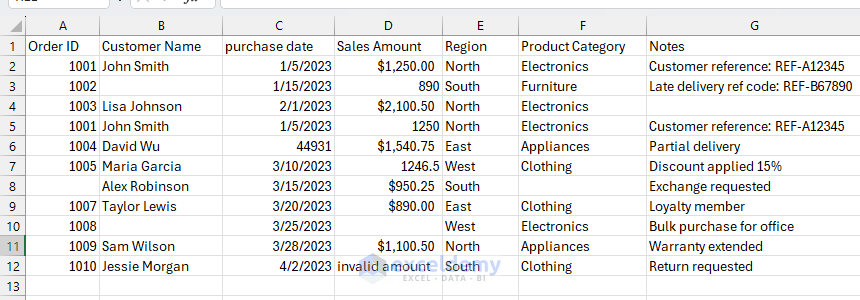
- Copy the helper column >> select Paste Special >> select Values over the original column.
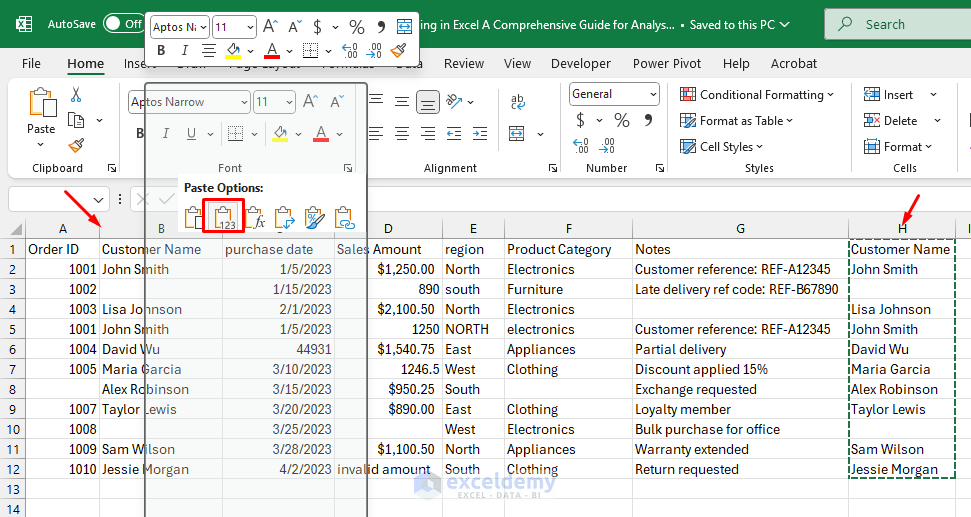
Output:
4. Fix Date Problems
Date inconsistencies are common in imported data, especially from different countries.
Our dataset has multiple date formats: 1/5/2023, 01-15-2023, 2023/02/01, and 3/10/23.
Convert Text to Dates:
- For simple formats, you can use the following formula.
Formula:
=DATEVALUE(A2)
- For complex formats, you can use the following formula.
Formula:
=DATE(
MID(A2,7,4),  /* Year */
LEFT(A2,2),   /* Month */
MID(A2,4,2)   /* Day */
)
This example converts “MM/DD/YYYY” text to a proper date.
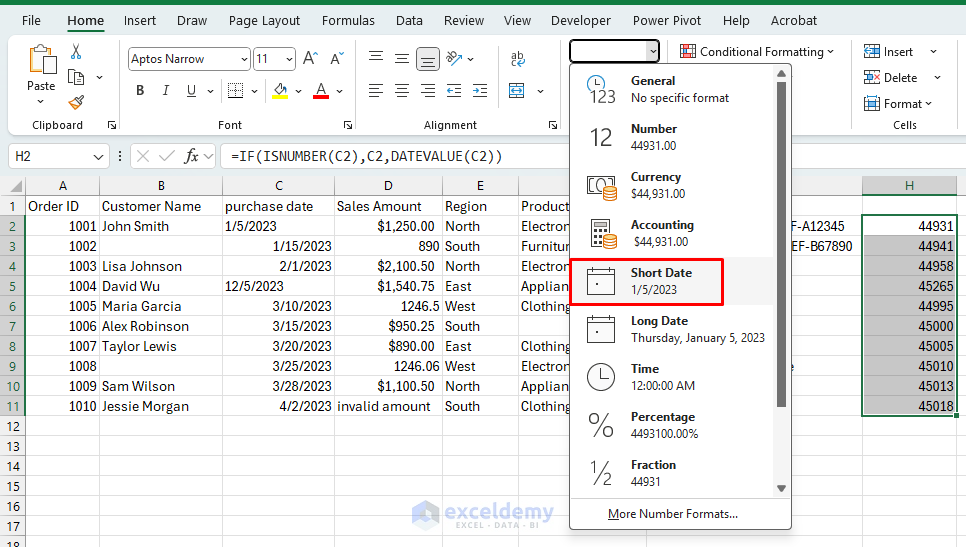
Convert Mixed Date Formats:
- Create a helper column and insert the following formula.
Formula:
=IF(ISNUMBER(C2),C2,DATEVALUE(C2))
This converts text dates to proper Excel dates. Then format the column as your preferred date format.
- Select Short Date from the Number Format drop-down.
- Copy the helper column >> select Paste Special >> select Values over the original column.
5. Manage Numeric Data
Numbers stored as text cause calculation errors.
Convert Text to Numbers:
- Simple conversion:
Formula:
=VALUE(A2)
Our sales amounts have several inconsistencies: $1,250.00, 890, $2,100.50, 1250.
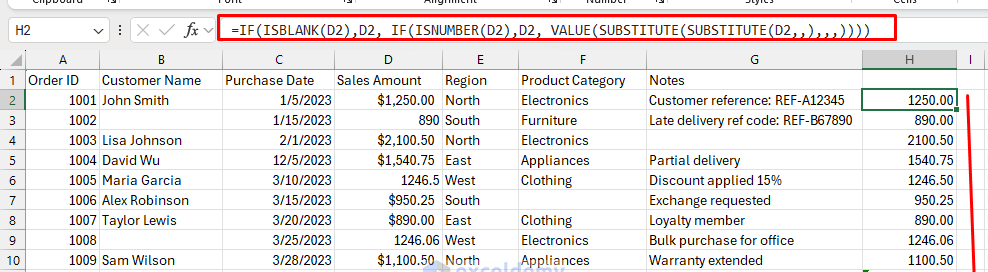
Standardize Currency Values:
- Create a helper column and use the following formula.
Formula:
=IF(ISBLANK(D2),D2,IF(ISNUMBER(D2),D2, VALUE(SUBSTITUTE(SUBSTITUTE(D2,$,),,,))))
This removes currency symbols and commas, then converts to numbers.
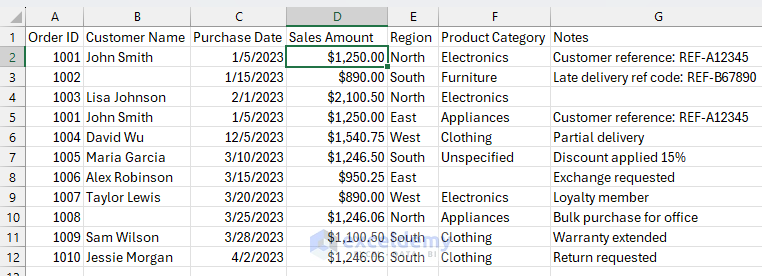
Apply Consistent Formatting:
- Select the cleaned column.
- Right-click >> select Format Cells >> select Currency >> select your preferred format.
- Copy the helper column >> select Paste Special >> select Values over the original column.
6. Identify and Handle Outliers
Detect Outliers:
- First, ensure all sales amounts are numeric using techniques from section 5.
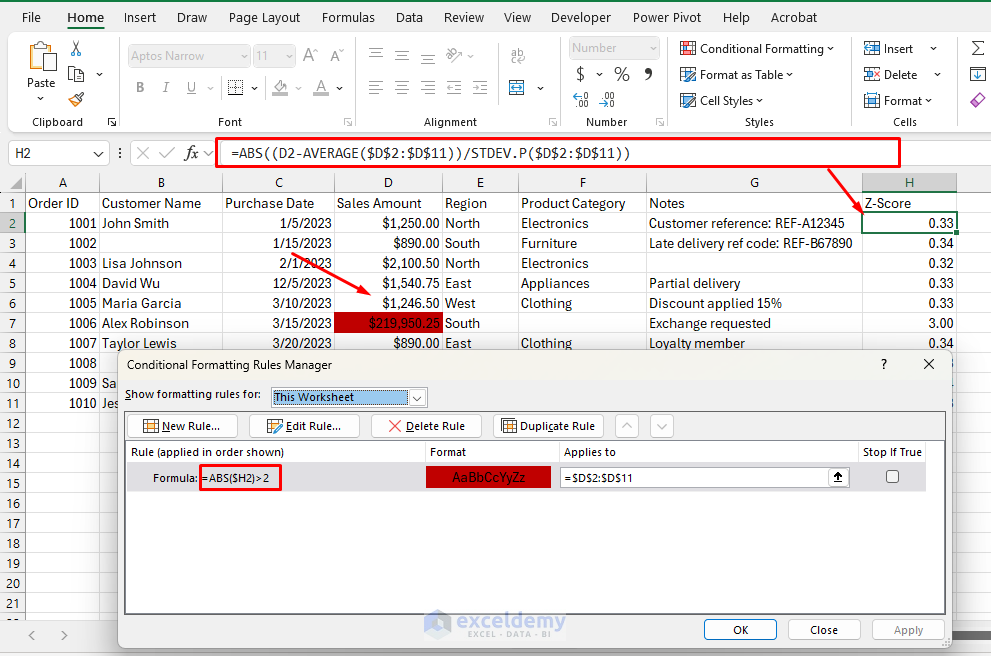
- Then, calculate z-scores in a helper column.
Formula:
=ABS((D2-AVERAGE($D$2:$D$11))/STDEV.P($D$2:$D$11))
Apply conditional formatting to highlight potential outliers:
- Go to the Home tab >> select Conditional Formatting >> select New Rule.
- Use the following formula:
=ABS($H2)>2
- Select fill color and click OK.
Investigate Outliers:
- Check against source data or with the data provider.
- If confirmed accurate but still an outlier, flag it rather than removing it.
Formula:
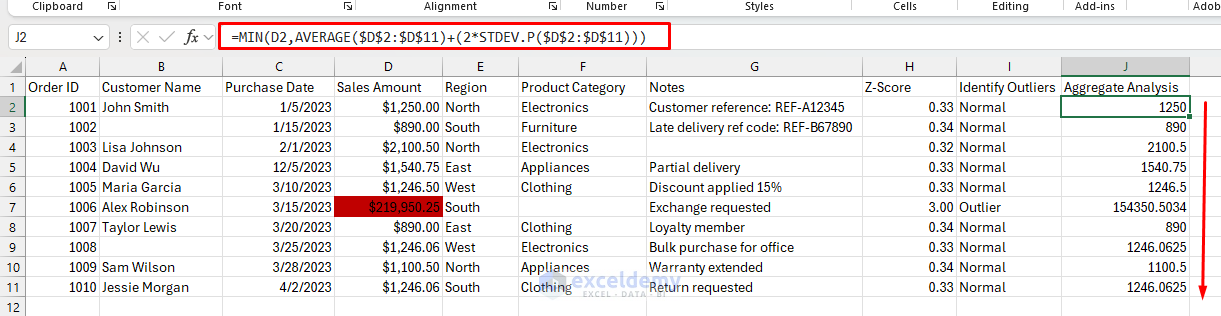
=IF(H2>2,"Outlier","Normal")
- For aggregate analysis, you should cap extreme values.
Formula:
=MIN(D2,AVERAGE($D$2:$D$11)+(2*STDEV.P($D$2:$D$11)))
Power Query: Advanced Data Cleaning
Let’s use our sales dataset to demonstrate Power Query’s capabilities:
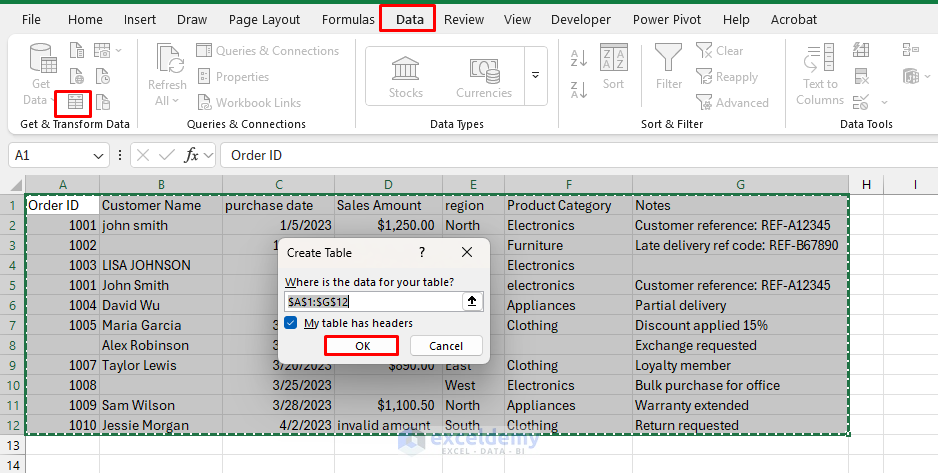
Load Data into Power Query
- Select any cell in your data table.
- Go to the Data tab >> select From Table/Range.
- In the Power Query Editor that opens, you’ll see your data with all its issues.
Replace Blanks:
Replace null with a placeholder:
- Select the columns.
- Go to the Transform >> select Replace Values.
- Value to Find: (null)
- Replace With: e.g., “Unknown Customer” or “N/A”
- For Product Category: “Unspecified”
- For Notes: “No Comments”
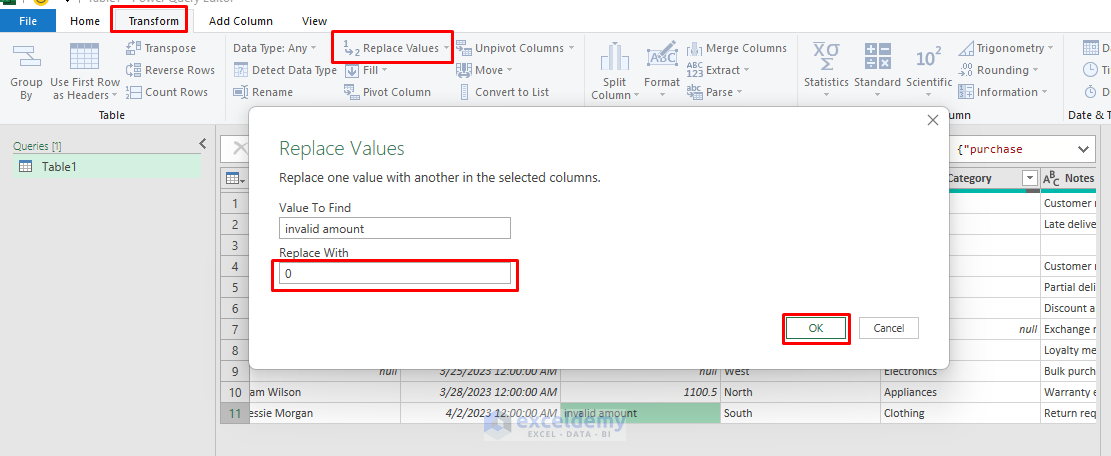
Replace null with a blank:
- Right-click the Sales Amount column where you see $null.
- Select Replace Values.
- Find: $null, invalid amount
- Replace with: 0
- Click OK.
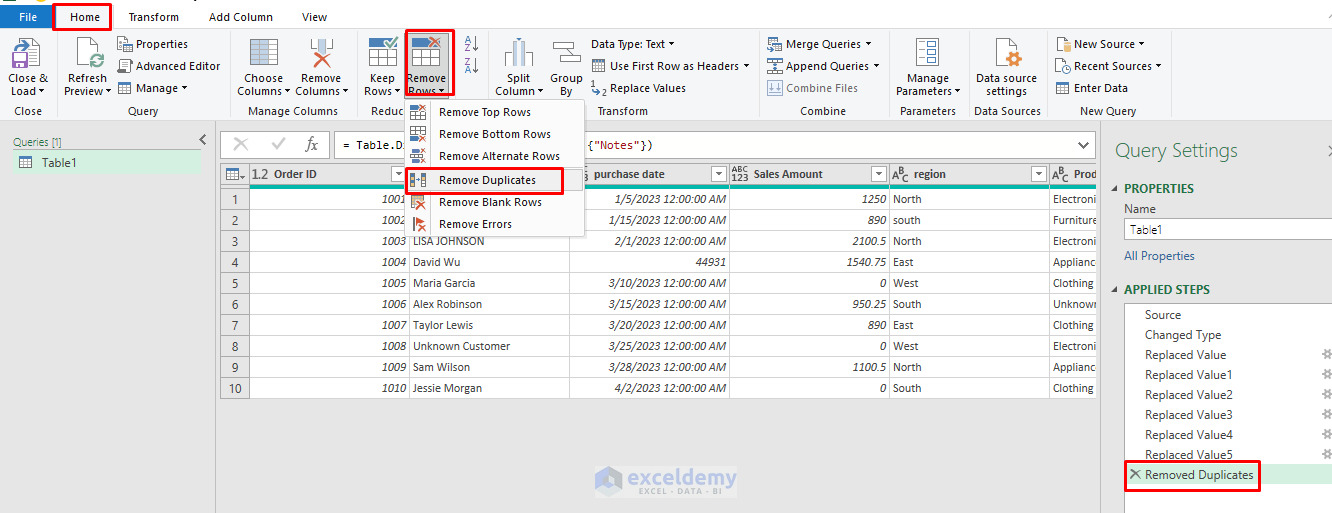
Remove Duplicates:
- Go to the Home tab >> select Remove Rows >> select Remove Duplicates Rows.
- Power Query can handle case-sensitive issues. It removes duplicates based on values rather than formatting.
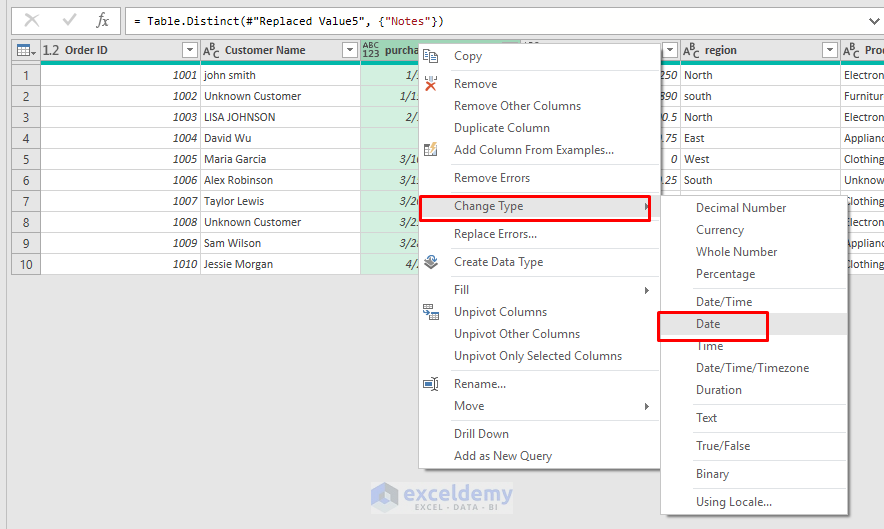
Change Data Types:
- Right-click the Purchase Date column >> select Change Type >> select Date.
- Right-click the Sales Amount column >> select Change Type >> select Decimal Number (Power Query automatically handles the currency symbols and commas).
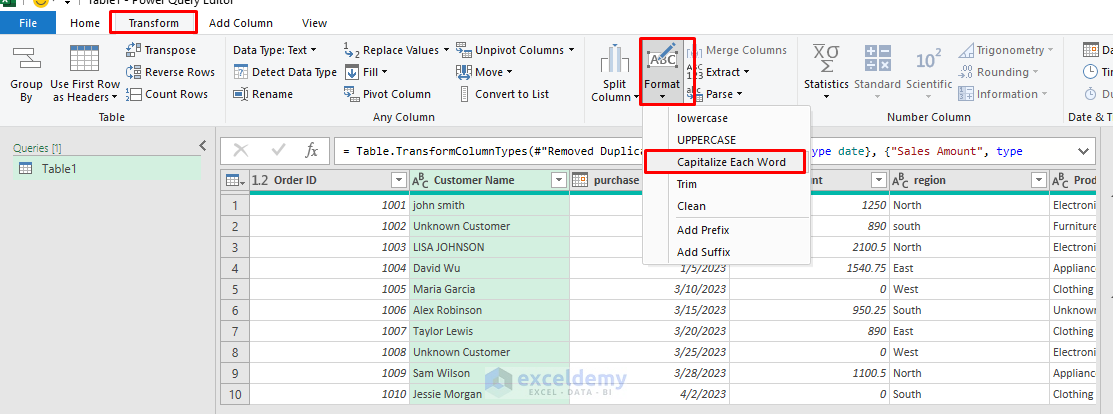
Clean Text Columns:
- Select Customer Name column >> go to the Transform tab >> select Format >> select Capitalize Each Word.
- Follow the similar steps for the Region and Product Category columns.
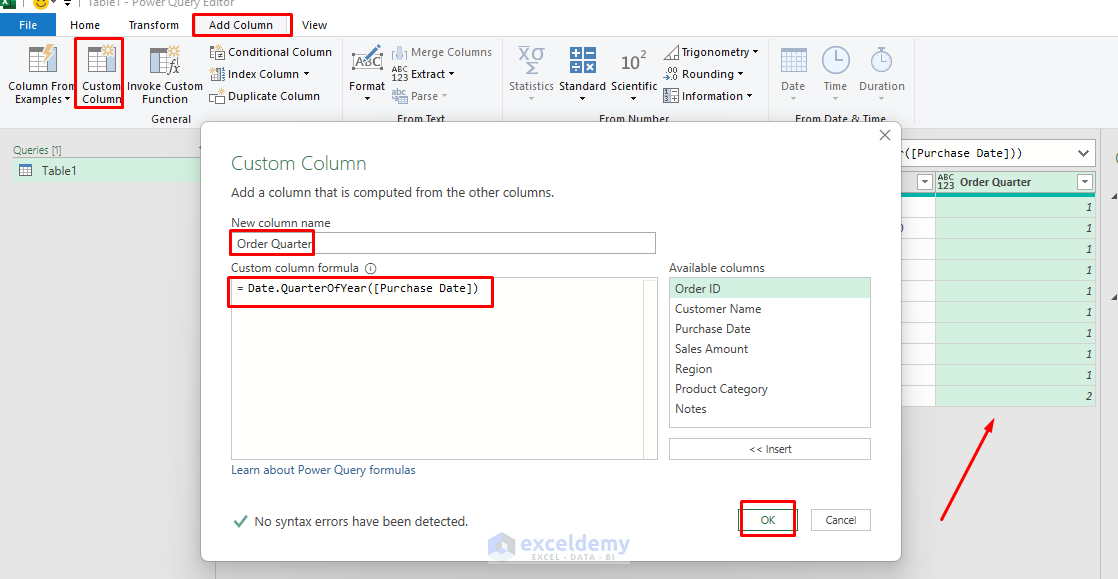
Create a Calculated Column:
- Go to the Add Column tab >> select Custom Column.
- Name: Order Quarter.
- Insert the following formula:
Date.QuarterOfYear([Purchase Date])
- Click OK.
- Click on Close & Load to get the clean data in Excel.
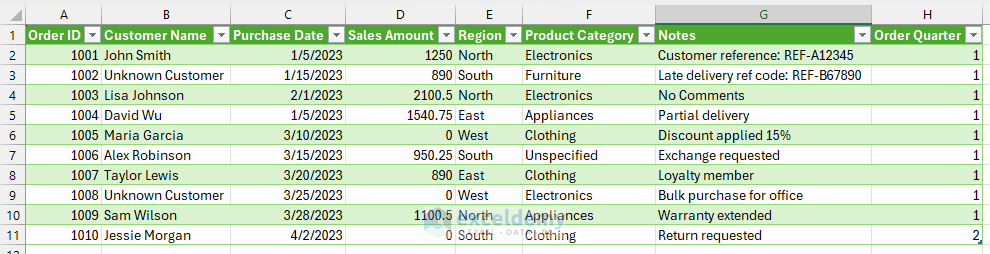
The real power is when your source data changes; just refresh the query, and all steps are reapplied automatically!
Conclusion
This comprehensive guide has shown you how to transform a messy, inconsistent dataset into clean, structured data ready for analysis. We’ve addressed common issues like missing values, duplicates, inconsistent formatting, and outliers using both traditional Excel techniques and Power Query. Data cleaning is an iterative process, and you’ll often discover new issues as you work. By mastering these data cleaning skills, you’ll significantly improve the quality of your Excel-based analysis.
Get FREE Advanced Excel Exercises with Solutions!
