
Image by Editor
Microsoft Access is a powerful database management system that allows you to store, manage, and analyze data. One of its most useful features is the ability to create interactive reports. Interactive reports allow users to filter, sort, and analyze data dynamically, which provides a better user experience.
In this tutorial, we will show how to build interactive reports in Microsoft Access.
Step 1: Prepare Database and Data
Make sure you have your data tables created properly in Access.
Let’s consider three tables of sales data.
- Customers (CustomerID, CustomerName, City).
- Orders (OrderID, CustomerID, ProductID, OrderDate, TotalAmount).
- Products (ProductID, ProductName, Category, Price).
Step 2: Create a Query for Report
We’ll use a query to prepare the data source for our report.
- Create a new query to join the Customers, Orders, and Products tables.
- Go to the Create tab >> select Query Design.

- Add three tables: Customers, Orders, and Products.
- Create the relationships between tables.
- Drag the CustomerID in the Orders table to the CustomerID in the Customers table.
- Drag ProductID in the Orders table to the ProductID in the Products table.
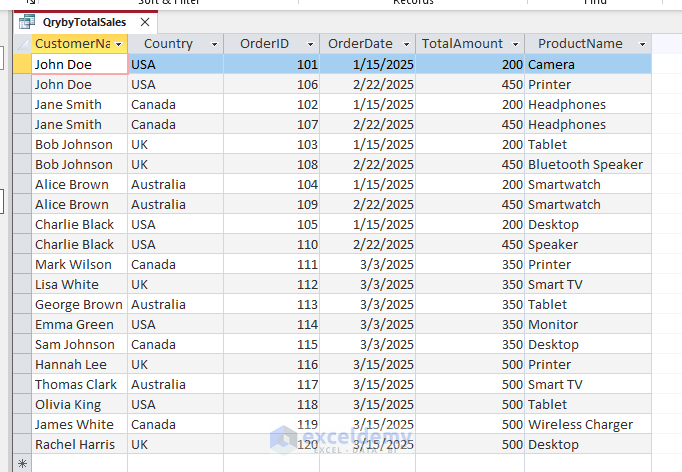
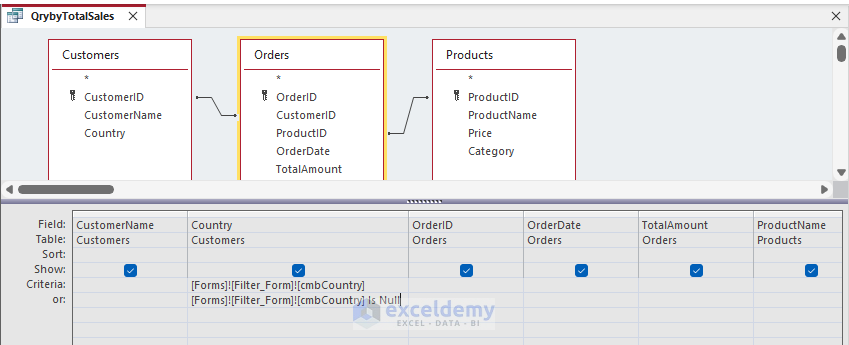
- In Design View of the query, add the following fields:
- Customers: CustomerName, Country
- Orders: OrderID, OrderDate, TotalAmount
- Products: ProductName
- Save this query as QrybyTotalSales.

- The query returns a combined result where we can analyze total sales by customer.
Step 3: Design Basic Report
Let’s start by creating a basic sales report that we’ll later enhance with interactive features.
- Go to the Create tab >> click Report Wizard.
- In the Report Wizard:
- Select the query QrybyTotalSales.
- From Available fields >> select CustomerName, OrderDate, TotalAmount, and ProductName.
- Click Next.

-
- Select CustomerName as a GROUP BY clause to summarize total sales by customer.
- Click Next.

-
- Select OrderDate to sort in ascending order.
- Click Next.

-
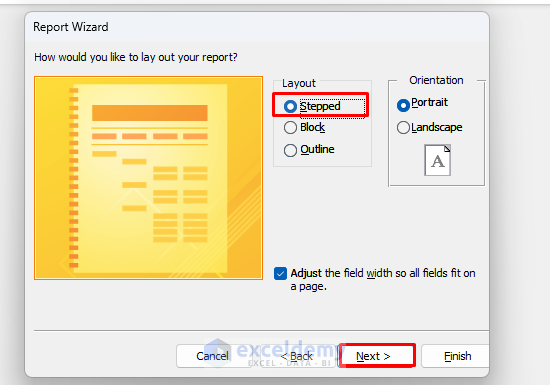
- Select Stepped layout.
- Click Next.
-
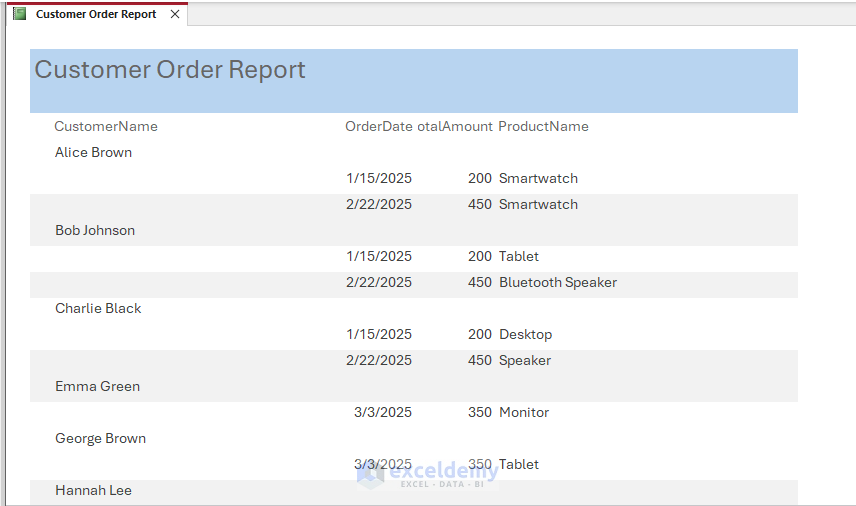
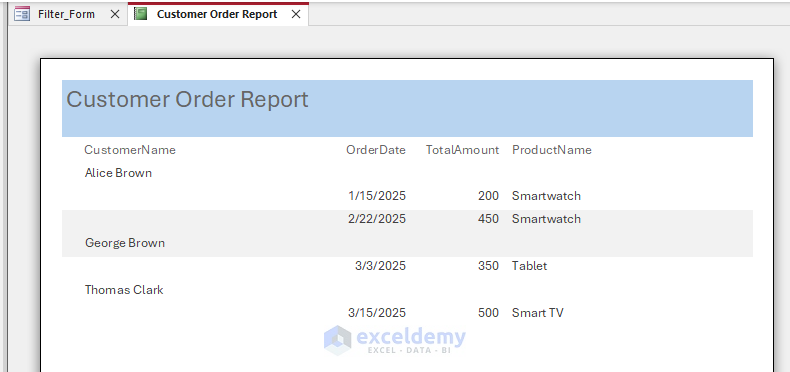
- Title the report Customer Order Report.
- Click Finish.

Your basic report is now generated.
To edit the report:
- Right-click on the Report >> select Design View.

- Adjusted the column width of TotalAmount as it wasn’t properly visible in the report.
- Save the report.

Step 4: Create an Interactive Filter Form
We’ll now create a form where users can select criteria. Let’s create a filter to show orders based on country..
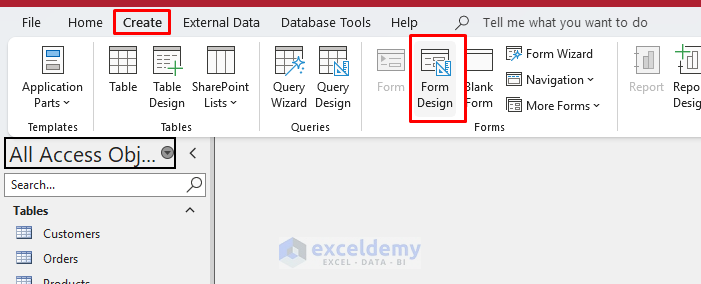
- Go to Create >> click Form Design.
Show the Controls Wizard:
- Go to the Form Design tab >> expand Controls dropdown >> select Use Control Wizards (tiny magic wand button).
- This enables wizards (like Combo Box Wizard).

Add a Combo Box (Dropdown):
- Go to the Form Design tab >> select the Combo Box tool.

- Click on the form to add the Combo Box; a wizard pops up.
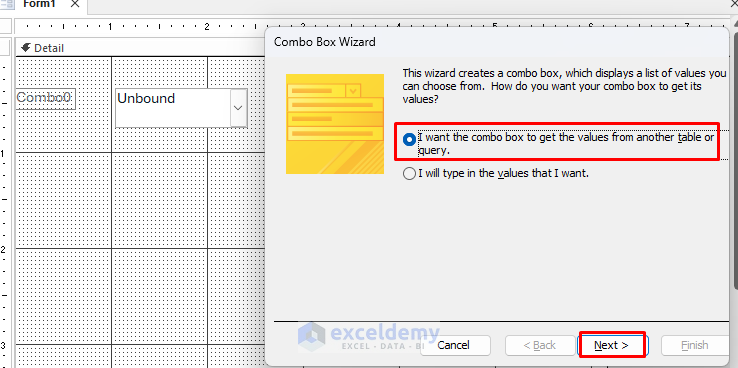
- In Combo Box Wizard:
- Choose “I want the combo box to get values from another table or query” >> click Next.
-
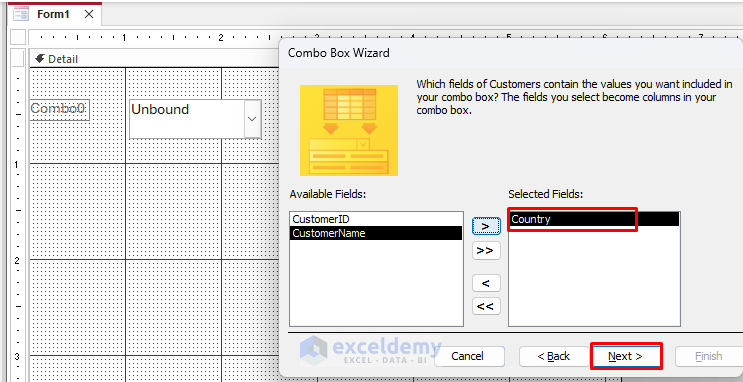
- Select the Customers table >> click Next.

-
- Choose Country field >> click Next.
-
- Sort Country name in Ascending order >> click Next.

-
- View the Country list >> click Next.

-
- Add a clear label like “Select City:” next to your combo box.
- Click Finish.

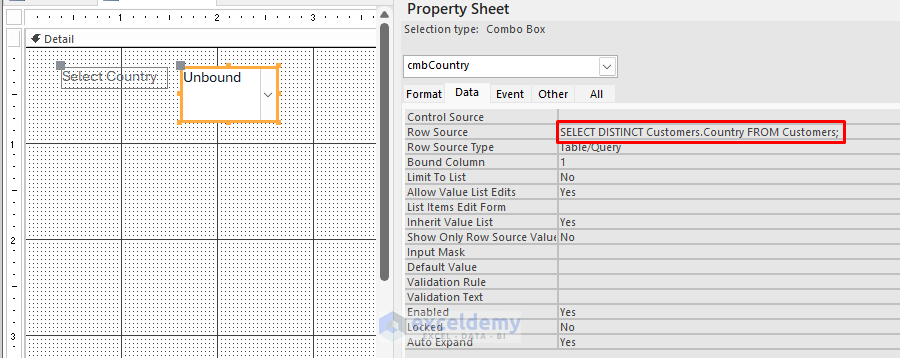
- Open the Property Sheet >> select Other tab >> name your combo box clearly (e.g., cmbCountry).

- Go to the Data tab >> select Row Source, insert the following sql query as country name values contain duplicate values.
SELECT DISTINCT Customers.Country FROM Customers;
Add a Button to Open Report:
- Select the Button tool from the ribbon.
- Click on the form to add the button.
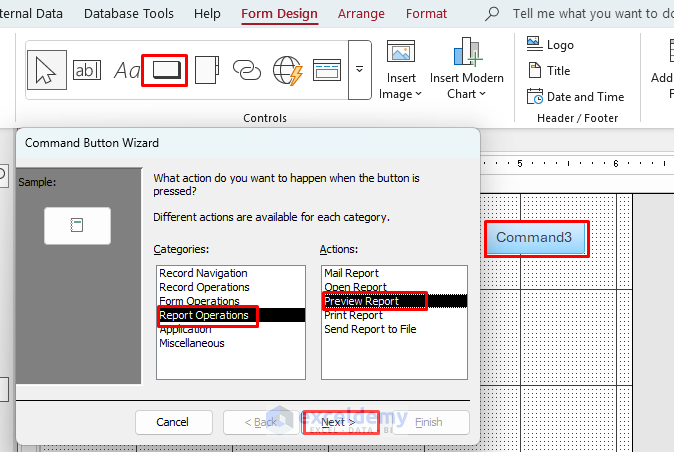
- In the Command Button Wizard:
- Under Categories >> choose Report Operations.
- Under Actions, select Preview Report.
- Click Next.
-
- Select your report Customer Order Report >> select Next.
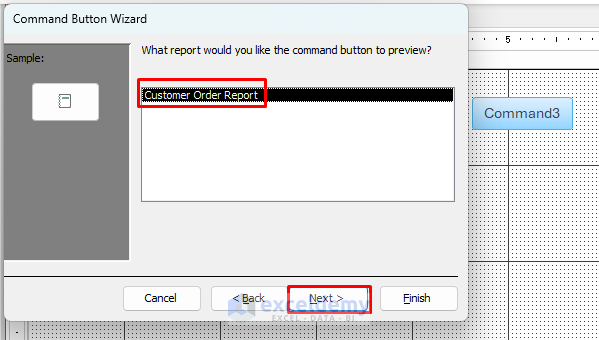
-
- Choose the Text option and type View Report >> click Finish.
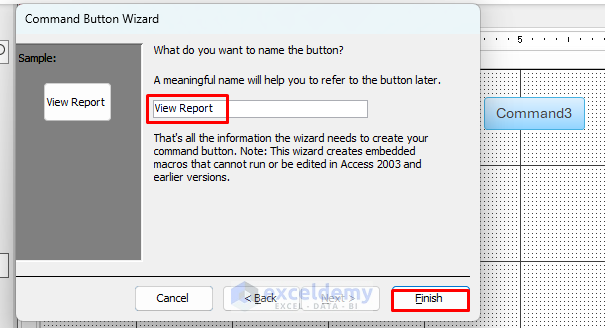
- Save the form as Filter_Form.
Step 5: Link Form Filter to Your Report
To make the form interact with your report, we’ll edit the query behind the report.
- Open your QrybyTotalSales in the Design View again.
- Under the Country field, enter the following criteria.
- Save and close the query.
In Criteria:
[Forms]![Filter_Form]![cmbCountry]
In Or
[Forms]![Filter_Form]![cmbCountry] Is Null
Explanation:
- This query will filter your report based on the country selected in your form.
- If no country is selected, all data will appear.
Step 6: Add VBA Code for Smooth Interaction
This code ensures your report always opens with fresh data.
- Open your Filter_Form in the Design View.
- Right-click the View Report button >> select Properties.
- In the property sheet, select the Event tab.
- Click the three-dot button (…) next to On Click and choose Code Builder. Paste this code:
Private Sub View_Report_Click()
    'Close report if it's already open
    If SysCmd(acSysCmdGetObjectState, acReport, "Customer Order Report") = acObjStateOpen Then
        DoCmd.Close acReport, "Customer Order Report"
    End If

    'Open report preview
    DoCmd.OpenReport "Customer Order Report", acViewPreview
End Sub

This code refreshes the report each time you click the button, ensuring up-to-date results.
Step 7: Test Your Interactive Report
Once the report is ready, test the report interactivity.
- Open Filter_Form in Form View.
- Select a Country from your combo box (or leave blank to see all orders).
- Click the View Report button.

- Your interactive report appears filtered according to your selection.
Try different selections to ensure it works correctly!
Step 8: Add Conditional Formatting in Interactive Report
For professional presentation:
- Add a clear title and date/time stamp.
- Improve readability with conditional formatting (highlight high-value orders):
- In Report Design View >> select the TotalAmount field.
- Go to the Format tab >> select Conditional Formatting.
- Click New Rule >> Set rules: Field Values >> greater than >> 400
- Choose formatting: Green fill and White font.
- Click OK.

- Save the report.
Test the Report Interactivity:
- Open the Filter_Form.
- Select Country >> click View Report.
- The total amount greater than 400 will be highlighted.

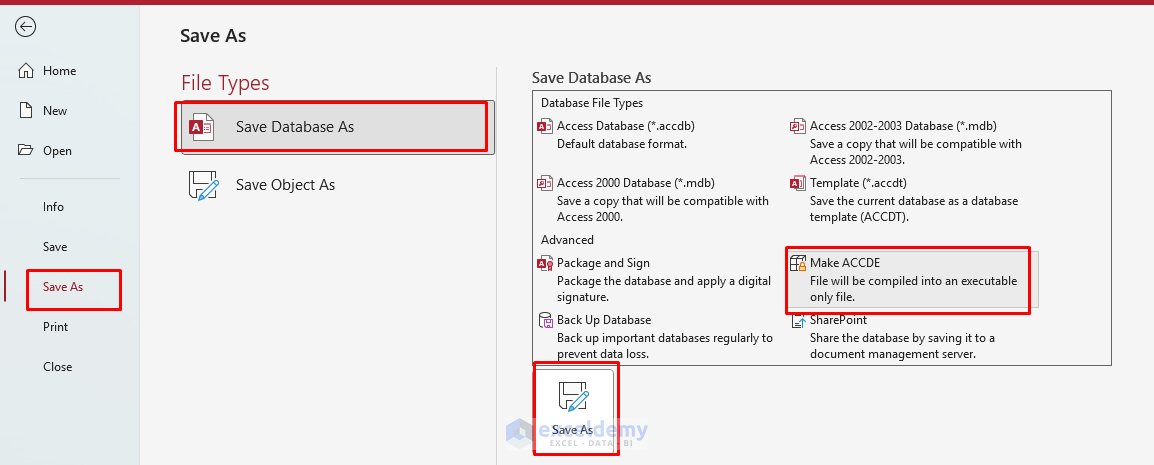
Step 9: Save and Deploy Your Database
Finally, save your interactive report database securely.
- Go to the File tab >> select Save As >> select Save Database As.
- Select Make ACCDE (compiled format) >> click Save As.
- This protects your design, allowing users only to interact, not to modify.
- You can distribute the .accde file to users.
Conclusion
Building interactive reports in Access not only enhances data presentation but also significantly improves user engagement and data exploration capabilities. By following our tutorial, you can build interactive reports in Access. Our tutorial covers filtering, sorting, conditional formatting, automation, etc. You can integrate more interactive elements (charts, hyperlinks). Experiment with these interactive features to deliver powerful insights through your reports.
Get FREE Advanced Excel Exercises with Solutions!
