
Power Pivot is a powerful Excel add-in that allows users to build complex data models and relationships between tables. It creates robust data models to perform advanced data calculations. It extends Excel’s capabilities by enabling the creation of dynamic, large-scale data models without requiring external software. In this article, we will show how to build complex data models and relationships with Power Pivot with practical examples.
What is Power Pivot?
Power Pivot is a powerful add-in in Excel that enables users to:
- It imports large datasets from multiple sources.
- Creates relationships between tables using key/primary fields.
- Performs advanced calculations with Data Analysis Expressions (DAX).
- Creates efficient, interactive dashboards and PivotTables.
Enable Power Pivot Tab:
- Go to the File tab >> select Options >> select Add-ins from Excel Options.
- In the Manage box >> select COM Add-ins >> click Go.
- From the COM Add-ins dialog box >> select Microsoft Power Pivot for Excel >> click OK.
1. Preparing Your Data for Power Pivot
Before building complex data models and relationships in Power Pivot, make sure that each table in your dataset has a unique identifier or primary key for each entity.
Let’s consider a sales data set where you will need:
- Sales: SaleID (A unique identifier for each sale)
- Products: ProductID (A unique identifier for each product)
- Customers: CustomerID (A unique identifier for each customer)
- Regions: RegionID (A unique identifier for each region)
- Dates: Date (A unique identifier for each day)
Make sure that each of these fields is consistent across the tables, especially the ones that will be used for creating relationships, such as ProductID, CustomerID, and RegionID.
2. Loading Data into Power Pivot
To import data into power pivot you may use different options based on your data type.
To import data from other sources, follow these steps:
- Go to the Power Pivot tab >> click Manage to open the Power Pivot window.
- In the Power Pivot window >> click Get External Data >> select From Other Sources to import your data.

To import data from the Existing Excel Workbook:
- Select the data range.
- Go to the Insert tab >> select Table.
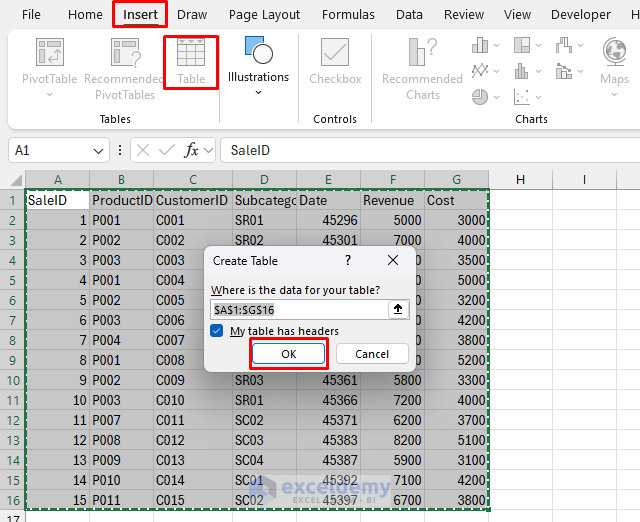
- Name each of your tables like Sales, Products, Customers, Regions, and Dates.

- Go to the Power Pivot tab >> select Add to Data Model to open the Power Pivot Editor.

By following these steps, you can import your data.
3. Creating Relationships
Now that your data is loaded, you need to establish relationships between these tables.
- In the Power Pivot window, go to the Design tab >> select Create Relationship.
- Create Relationship dialog box will pop up,
- “Select tables and columns that relate to one another”.
- Define the relationships using the following mappings one by one:
- Sales[ProductID] -> Products[ProductID]: Connects each sale to its corresponding product.
- Sales[CustomerID] -> Customers[CustomerID]: Connects each sale to its corresponding customer.
- Sales[Date] -> Dates[Date]: Connects each sale to its corresponding date.
- Customers[RegionID] -> Regions[RegionID]: Connect each customer to their corresponding region.

Relationship:

Alternate: From Diagram View
- Switch to Diagram View in Power Pivot.
- Drag ProductID from the Sales table to the Products table.
- Drag CustomerID from the Sales table to the Customers table.
- Drag the Date from the Sales table to the Dates table.
- Drag RegionID from the Customers table to the Regions table.

4. Creating Calculated Columns and Measures
As you build relationships, you can start performing calculations and analyses. Power Pivot allows you to create calculated columns and measures for deeper insights.
Example: Calculated Columns
Let’s create a calculated column in the Sales table to calculate the Profit from each sale:
- In the Power Pivot window >> select the Sales table.
- Click Add Column and insert the following formula to calculate profit.
= [Revenue] - [Cost]
This calculated column will now appear in the Sales table with profit values. You can rename the column to Profit.

Example: Calculate Measures
Measures 1: Total Revenue
To calculate the Total Revenue across all sales, you can create a measure in Power Pivot:
- In the Sales table, go to the Calculation Area.
- Type the following DAX formula to create the Total Revenue measure:
= SUM(Sales[Revenue])
This measure will dynamically calculate total revenue, adjusting based on any filters or slicers applied to your data model.
Measures 2: Total Profit
To calculate the total profit, insert the following DAX formula in the calculation area.
= SUM(Sales[Profit])
Measures 3: Average Customer Income
To calculate the average customer income, insert the following DAX formula in the calculation area.
= AVERAGE(Customers[Income])
Output:

5. Advanced Analysis: Time Intelligence
With the Date table, you can perform time-based analysis, such as calculating sales trends over time. Power Pivot supports Time Intelligence functions, such as TOTALYTD (Year-to-Date) and SAMEPERIODLASTYEAR, which allow you to compare performance across different periods.
To calculate the Year-to-Date Revenue, you can create a measure like this:
=TOTALYTD(SUM(Sales[Revenue]),Dates[Date])
This measure will calculate the cumulative revenue from the beginning of the year up to the selected date.
To calculate Year-over-Year Revenue growth, insert the following DAX formula.
=DIVIDE(
SUM(Sales[Revenue]) -
CALCULATE(SUM(Sales[Revenue]), SAMEPERIODLASTYEAR(Dates[Date])),
CALCULATE(SUM(Sales[Revenue]), SAMEPERIODLASTYEAR(Dates[Date])),
0)
This calculates percentage growth compared to the same period last year.

6. Creating Pivot Tables to Analyze Data
Once your relationships and calculations are in place, you can start creating PivotTables and PivotCharts to analyze the data.
- Go to the Insert tab >> select PivotTable.
- In the Create PivotTable dialog >> select From Data Model.
- In the PivotTable field list, you will see all the tables and fields you’ve added to the data model. Drag fields from your tables to the Rows, Columns, and Values areas to perform various analyses.

Advanced Insights from the Model:
- To analyze Total Revenue by Product;
- Drag ProductName from the Products table to the Rows area and the Total Revenue measure to the Values area.
- To analyze Revenue by Region;
- Drag RegionName from the Regions table to the Rows area and the Total Revenue measure to the Values area.

You can also add slicers for better interaction. For instance, you can add a slicer for Month to filter the data by different months.
Conclusion
With a practical dataset, we have shown the process of building complex data models and relationships in Power Pivot. This helps you to perform sophisticated analyses that would be difficult to achieve with traditional Excel functions alone. By linking related tables and using calculated columns and measures, you can gain deeper insights into your data, such as understanding sales performance by product, region, or customer demographics.
Get FREE Advanced Excel Exercises with Solutions!
