
Image by Editor | Midjourney
Return on Investment (ROI) is a key financial metric used to evaluate the profitability of an investment. In this article, we will show how to build an ROI Calculator in Excel.
Let’s understand the ROI Calculation before we start building the calculator, it’s important to understand that ROI measures the return (profit) relative to the cost of an investment. The basic formula is:
ROI = (Net Profit - Investment Cost) / Investment Cost × 100%
For example, if you invest $1,000 and receive $1,500 back, your ROI would be:
($1,500 - $1,000) / $1,000 × 100% = 50%
Step 1: Setting Up the Basic Structure
Open Excel and create a new workbook. List your inputs and outputs clearly:
- In cell A1, type ROI Calculator as your title.
- Format cells A1:C1 as merged and centered.
- Apply bold formatting and a larger font size (14 or 16) to make it stand out.
- In column A, starting from A3, enter these labels:
- Initial Investment ($)
- Revenue ($)
- Expenses ($)
- Investment Year
- Net Profit ($)
- ROI (%)
- Annualized ROI (%)
Step 2: Adding the ROI Formulas
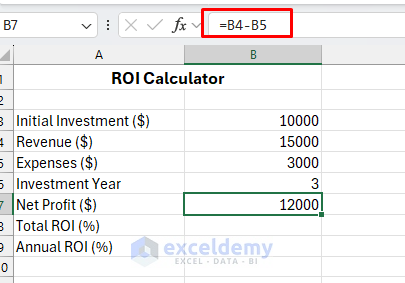
1. Calculate Net Profit ($)
- Select cell B7 and insert the following formula.
Formula:
=B4 - B5
This formula subtracts Revenue and Expenses to get the net profit.
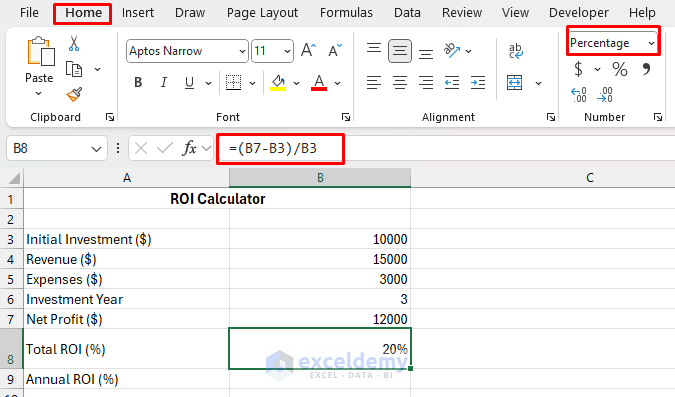
2. Calculate ROI (%)
- Select cell B8 and insert the following formula.
- Go to the Home tab >> select Percentage from Number.
Formula:
=(B7-B3)/B3
This formula calculates the ROI percentage.
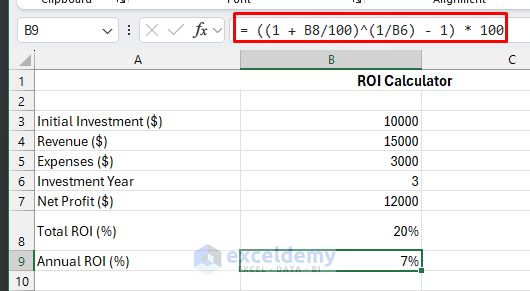
3. Calculate Annualized ROI (%)
- Select cell B9 and insert the following formula.
- Go to the Home tab >> select Percentage from Number.
Formula:
= ((1 + B8/100)^(1/B6) - 1) * 100
This formula calculates the average yearly return of an investment over multiple years.
Step 3: Enhancing the Calculator
Let’s add some helpful features:
Add Conditional Formatting to the ROI cells:
- Select Cell B8.
- Go to the Home tab >> from Conditional Formatting >> select Highlight Cells Rules.
- Green for ROI > 0.01 (Positive Return)
- Red for <0 ROI (Risky Investment)

Add a note to explain ROI interpretation:
- Select cell C8 and insert the following formula.
Formula:
=IF(B8 >=1%, "A positive ROI means your investment is profitable", "A negative ROI indicates loss")
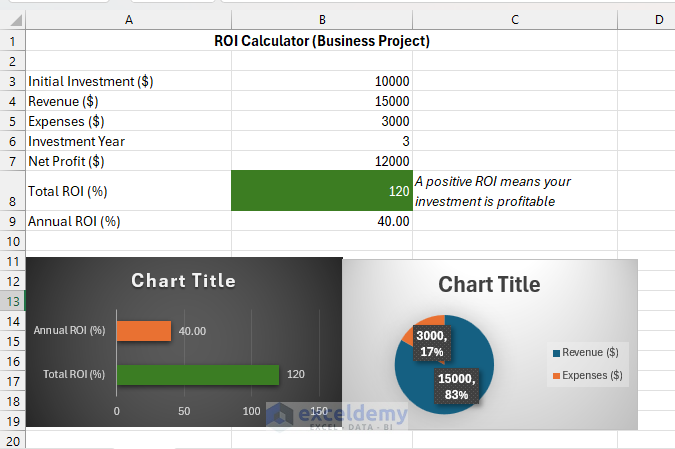
- A positive ROI means your investment is profitable,
- A negative ROI indicates a loss.

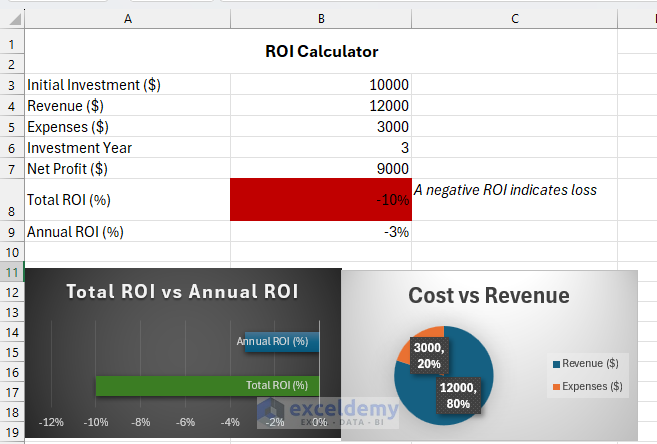
Step 4: Creating a Visual Element
Let’s add a simple chart to visualize the ROI.
ROI Comparison Chart:
- Select cell A8:B9.
- Go to the Insert tab >> select Bar Chart.
- Customize labels and colors for better insights.
Break-even Analysis:
- Select cell A4:B5.
- Go to the Insert tab >> select Pie Chart.
- This chart will visualize costs vs. revenue.
Output:

Annualized ROI is lower than Total ROI because it adjusts for time. Investments with similar ROI but different durations will now be comparable!
Test the Calculator:
- Change the revenue or investment to auto-calculate the ROI.
Things to Remember
To calculate Business Project ROI, you will need to adjust the following calculation:
ROI = Net Profit / Investment Cost × 100%
Total ROI:
=(B7/B3)*100
Annual ROI:
=(B8/B6)
This is useful for:
- Starting a business.
- Launching a new product.
- Running marketing campaigns.
- Any situation involving ongoing revenue and expenses.
Conclusion
You can follow these steps to build a ROI calculator. This calculator provides a solid foundation for investment analysis. This calculator is useful for investors comparing different projects, businesses evaluating capital investments, and startups analyzing profitability over time. As you become more comfortable with it, you can add more sophisticated features NPV, IRR, and Payback period calculations.
Get FREE Advanced Excel Exercises with Solutions!

Very Useful. Helped me a lot.
Hello Antony,
Thanks for your feedback and appreciation. Glad to hear that you found my article very useful. Keep exploring Excel with ExcelDemy!
Regards
ExcelDemy