Latest Posts From Mehedi Hasan

What Is a Treemap Chart? The Treemap in Excel is a common type of chart that provides a hierarchical representation of the data. Usually, this type of chart ...

In this article, we will describe a step-by-step procedure to create a Sunburst Chart with percentage in Excel. What Is a Sunburst Chart? A Sunburst ...

Solution 1 - Solve Through the Context Menu Steps: Open Windows File Explorer and move to the folder where you have saved the desired file. ...
![[Fixed!] Excel to PDF Hyperlinks Not Working (5 Easy Fixes)](https://www.exceldemy.com/wp-content/uploads/2022/11/excel-to-pdf-hyperlinks-not-working-3.png?v=1697440191)
In Microsoft Excel, hyperlinks generate a shortcut that take the user to a different part of the current workbook, a different workbook, or a website or file ...

Microsoft Excel is a powerful program, and we use it on a regular basis. Nowadays, Google Sheets is getting very popular among the public and slowly catching ...

While working in Excel, we often have to rename a workbook. In addition to this, properly named and organized worksheets and workbooks are important for the ...
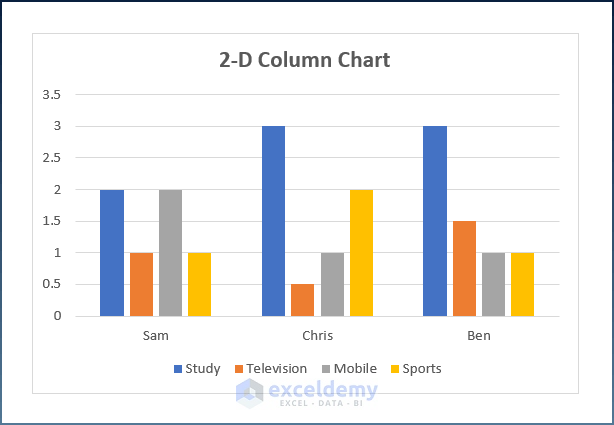
Usually, column charts can be used to show how data changes over time or to show comparisons between things. In column charts, the categories are usually lined ...

In general, variance is one of the most useful topics in statistics and is widely used to calculate stock returns in the stock market. Moreover, it gives you a ...

In mathematics, probability is the measure of the likelihood that an event will occur. However, the probability is quantified as a number between 0 and 1, ...
Method 1 - Calculating Total Food Cost Percentage Formula for Cost per Meal Steps: Select cell C8. Write the following formula into the formula bar ...

Step 1 - Enter Company Details Enter the name of the company, company location, and payment voucher month and year in the first rows of the file. ...

This is the sample dataset. The Y-axis value is placed on the left. Example 1 - Using a Stacked Bar Chart Without Gaps in Between Steps: ...

In this Excel tutorial, we will explain how to apply Top and Bottom border. In the image below, the cells on the left don't have borders, but on the right, ...
Microsoft Excel is a powerful program. In addition to this, it is quite easy and handy to operate. Also, productivity and utilization are increasing day by ...
Overview The Material balance is quite common in Chemistry, especially in chemical reactions. It refers to the balance of materials or masses on both sides ...
See Our Reviews at


Hello ASHLEIGH,
Thank you for your question. We’re sorry to hear that you’re facing difficulties with the VBA code. In fact, the ExcelDemy team has tested the Excel file and the code with other workbooks following your comment and the code appears to be working correctly.
However, you can check the following 4 steps.
1. You can choose any of the two formats according to your need from Method-2. Additionally, read the Notes given after each code. This will help you to understand the code properly.
2. You must create a worksheet where you want to move the filtered rows.
3. Set the Input Worksheet and Destination Worksheet names properly with the Range.
4. In this code, we have selected Cable as filter criteria. So, the rows containing Cable within the given Range will be deleted and it will be moved to your Destination Workbook. So, make sure you have provided the criteria according to your dataset.
I hope this will solve your issue. If you still face problems, please feel free to comment again or send your workbook through e-mail so that I can check the issue.
Hello DERRELL,
Thank you for your question. I will be glad if I can help you even a little.
First of all, YES, you can sort two columns based on the second column without creating a new table.
If you want to know the process in detail, kindly read through the following article.
https://www.exceldemy.com/sort-data-in-excel-by-value/
I hope this will solve your issue. If you still face problems, please feel free to comment again or send your workbook through e-mail so that our team can check the issue.
Hello KOBUS,
Thank you for your question. We’re sorry to hear that you’re facing difficulties with the VBA code. In fact, the ExcelDemy team has tested the Excel file and the code with other workbooks following your comment and the code appears to be working correctly.
However, you can check the following 2 steps.
1. Follow the individual steps properly.
2. You have to insert the code by using the View Code option of a particular sheet. It will not work if you insert it in a VBA Module.
I hope this will solve your issue. If you still face problems, please feel free to comment again or send your workbook so that I can check the issue.