
Power BI reports can sometimes feel sluggish, especially as datasets grow or visuals multiply. Slow load times can frustrate users and reduce adoption and productivity. Basic performance tuning can yield big gains without needing advanced expertise. Performance tuning is essential for delivering a smooth user experience.
In this tutorial, we will show 5 ways to make Power BI reports load faster. These techniques can dramatically improve any Power BI report’s performance.
1. Reduce Data Volume and Trim the Data Early (Power Query)
The first and most important rule: don’t load what you don’t need. If your report only needs monthly sales, don’t import daily transactions. Make the model smaller and let queries fold back to the source so Power BI does less work.
Load the Data into Power Query:
- Apply Filters: Apply filters at the query level to limit unnecessary rows before expanding/merging or adding custom columns.
- Ex: Filter out a specific year.
- Click on the Filter dropdown.
- Select Date Filters >> select Year >> select This Year.

- Remove Unused Columns: Power BI loads every column into memory. Each column consumes memory and processing power.
- Right-click a column >> select Remove.
- Optimize Data Types: Change text-heavy columns to integers where possible (e.g., IDs), and use Date/Time for dates instead of text. This reduces memory usage.
- Go to the Home tab >> from Data Type >> select the proper data type.

- Use Query Folding: Push filters back to the database so Power BI doesn’t pull all data into memory before filtering (check View Native Query in Power Query where available).
- Hide Unneeded Items: This doesn’t delete data but declutters the Fields pane, preventing accidental overuse.
- In Model view, right-click columns/tables >> select Hide in report view.

Why it helps: Less data in → smaller model → faster refresh → lighter visuals.
2. Model for Speed: Star Schema, Low Cardinality, Tidy Relationships
A well-structured data model is the foundation of report performance. Use a star schema with fact tables containing measures and dimension tables containing descriptive attributes. It allows Power BI’s engine to query data more efficiently.
- Build a Star Schema: Move descriptive columns (like product names, categories, customer details) into dimension tables. Keep only keys and numeric measures in your fact tables.
- Sales Fact Table: SalesID, ProductID, CustomerID, DateID, SalesAmount, Quantity.
- Product Dimension: ProductID, ProductName, Category, Subcategory.
- Customer Dimension: CustomerID, CustomerName, Region, City.
- Create a dedicated Date table named Calendar.
- Mark as Date Table.
- Create a relationship one-to-many (1:*) to your fact table.
- Avoid many-to-many where possible; keep relationships single-direction unless needed.
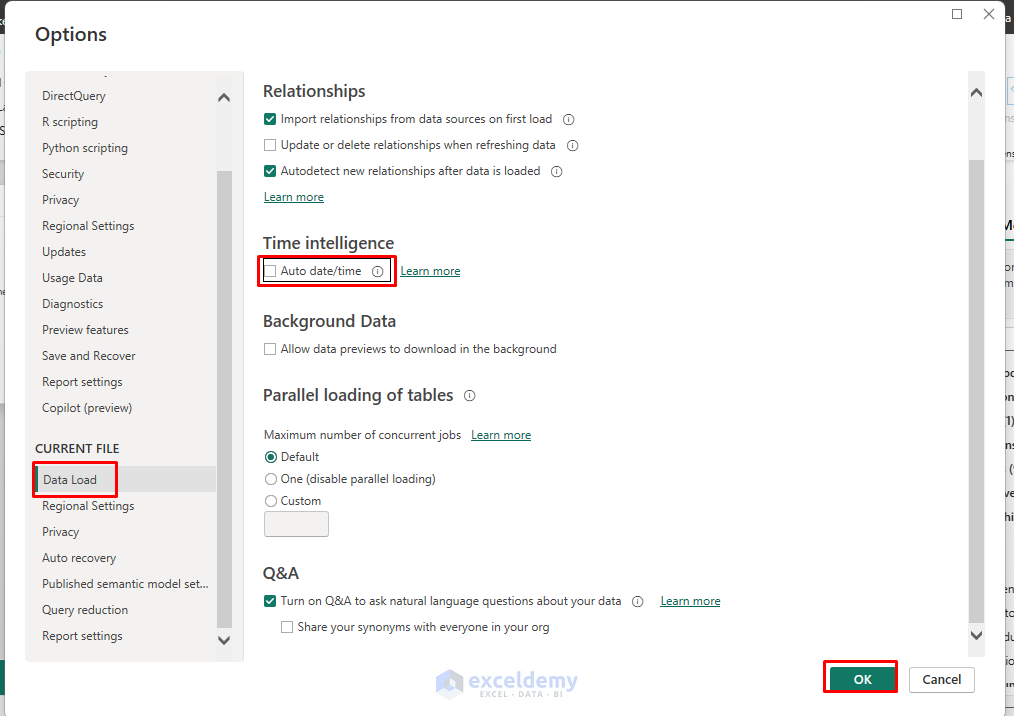
- Disable Auto Date/Time:
- Go to the File tab >> select Options & Settings >> select Options.
- From CURRENT FILE >> select Data Load >> uncheck Auto date/time to avoid hidden, heavy data tables.
- Click OK.
- Hide Navigation Noise: Hide surrogate keys and intermediate columns from the Report view.
Why it helps: Cleaner relationships and lower cardinality shrink the search space that DAX must scan.
3. Write Lean DAX: Prefer Measures, Use VAR, Minimize Iterators
Complex DAX measures can significantly slow down report rendering, especially when they perform row-by-row calculations or use expensive functions. Reduce scans, row context, and repeated calculations.
- Avoid Calculated Columns: Calculated columns are computed during data refresh and stored in memory. If you can move the logic to Power Query (M) or your source database, you’ll save processing time.
- Use measures (calculated at query time) instead of calculated columns (stored).
- Use Variables in Measures: Variables (VAR) store intermediate results, preventing Power BI from recalculating the same expression multiple times.
Revenue =
VAR U = SUM(Sales[Quantity])
VAR P = AVERAGE(Sales[UnitPrice])
RETURN U * P

- Minimize Iterator Functions on Large Datasets: Functions like SUMX, FILTER, and ADDCOLUMNS iterate row-by-row and can be slow at scale. When possible, use native aggregations like SUM, AVERAGE, or COUNT.
- Prefer COUNTROWS for Table Expressions: Use COUNTROWS when counting rows from a table/filter expression; avoid COUNT on non-numeric columns.
- Use DIVIDE(numerator, denominator, 0) to handle divide-by-zero safely and avoid expensive error paths.
- Avoid over-filtering with deeply nested CALCULATE/FILTER combinations; push filters to the model (dimensions/relationships) where feasible.
- Reuse measures (compose small measures into larger ones) instead of repeating the same expressions.
Why it helps: Fewer iterations and fewer repeated scans shorten visual query time.
4. Optimize Visuals and Reduce Visual Count
Each visual on a page generates queries to your data model. Too many visuals or complex visuals create unnecessary overhead and slow page load times. Reduce the number and cost of visual queries the engine must run.
- Limit Visuals Per Page: Aim for 8–10 visuals maximum per page. If you need more detail, consider drill-through pages or tooltips.
- Disable Unnecessary Interactions: By default, clicking on a visual filters other visuals on the page. Disable interactions that aren’t needed.
- Go to the Format tab >> select Edit interactions.
- Turn off cross-filtering where not needed.

- Reduce Data Points in Visuals: A chart with thousands of data points not only renders slowly but is also hard to read. Use Top N filters or aggregation to show only the most relevant data.

- Use Conditional Formatting Sparingly: While powerful, complex conditional formatting rules (especially with DAX measures) add processing overhead.
- Use Native Slicers Sparingly: Too many slicers slow queries. Consider a single “Period” slicer (Month/Quarter/Year) instead of many.
- Turn on Performance Analyzer:
- Go to the View tab >> select Performance Analyzer.
- Remove or optimize the visuals with the longest “DAX query” time.

- Turn on Data Reduction options where available (e.g., for maps/scatter).
Why it helps: Each visual is a query; fewer/simpler queries = faster page render.
5. Set Up Incremental Refresh for Large Datasets
For datasets over 1 million rows, full refreshes kill performance. Incremental refresh loads only new/changed data. Avoid reprocessing the whole dataset and serve summaries from cache.
- Incremental Refresh (Pro/Premium + Power BI Service): Partition the fact table (e.g., store 5 years, refresh last 30 days).
- Power Query: Create RangeStart and RangeEnd parameters and filter OrderDate between them.
- Modeling: Right-click on a table >> select Incremental Refresh.
- Set the archive period and incremental period.

- Aggregations for Large DirectQuery Models:
- Build an Import aggregation table (e.g., by Date-Month & Product) and map it as an aggregation over the big DirectQuery fact.
- Queries that hit monthly/product grain get answered from the fast Import cache.
- Right-click on a table >> select Manage aggregations.

- Consider Composite Models: Keep hot slices or reference tables in Import; keep very large, less-used detail in DirectQuery.
Why it helps: Refreshing only what changed and answering common queries from the aggregated cache drastically reduces load and wait time.
Final Thoughts
Speeding up Power BI reports is about smart design, not just powerful hardware. By trimming your data, simplifying calculations, and building a clean model, you’ll create dashboards that are both lightning-fast and scalable. Power BI performance tuning doesn’t require advanced technical skills. You can implement these 5 ways to make Power BI reports load faster. Implement them one at a time, using Performance Analyzer to quantify wins.
Get FREE Advanced Excel Exercises with Solutions!
