
Hypothesis testing is a fundamental statistical method used to determine whether your data supports a particular claim or theory. Microsoft Excel provides powerful built-in functions and tools for hypothesis testing. You can use multiple ways to perform z-tests, t-tests, and other statistical tests without needing external software.
In this tutorial, we show five ways to conduct hypothesis testing in Excel using built-in formulas and the Data Analysis ToolPak.
Understanding Hypothesis Testing Basics
Before we begin, recall the key terms:
- Null Hypothesis (H₀): The baseline claim you want to test (e.g., “The mean weight = 50 kg”).
- Alternative Hypothesis (H₁): What you suspect might be true instead (e.g., “The mean weight ≠ 50 kg”).
- Significance Level (α): Commonly set at 0.05, the threshold for rejecting H₀.
- p-value: The probability of observing your sample result if H₀ were true.
If p < α, you reject H₀; otherwise, you fail to reject H₀.
Let’s assume you collected sample weights (kg) under a diet plan to test whether they differ from the claimed weight of 50 kg.
Method 1: One-Sample t-Test Using an Excel Formula
Use the t-test when comparing a sample mean to a hypothesized value and the population standard deviation is unknown.
We’ll test whether the average weight is greater than 50 kg.
Where:
- H₀: μ = 50
- H₁: μ > 50
Steps:
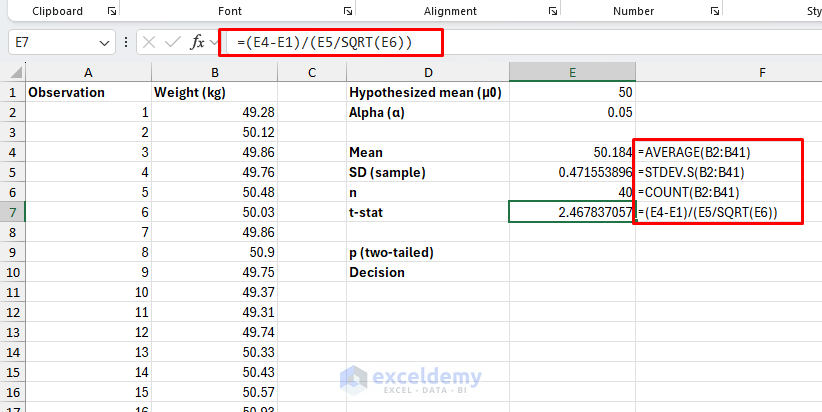
Sample mean:
=AVERAGE(B2:B41)
Sample standard deviation:
=STDEV.S(B2:B41)
Sample size:
=COUNT(B2:B41)
Compute t-stat: (SampleMean − HypothesizedMean) / (SampleSD / SQRT(SampleSize))
=(E4-E1)/(E5/SQRT(E6))
t-test p-value (one-tailed):
=T.DIST.RT(E8,E6-1)
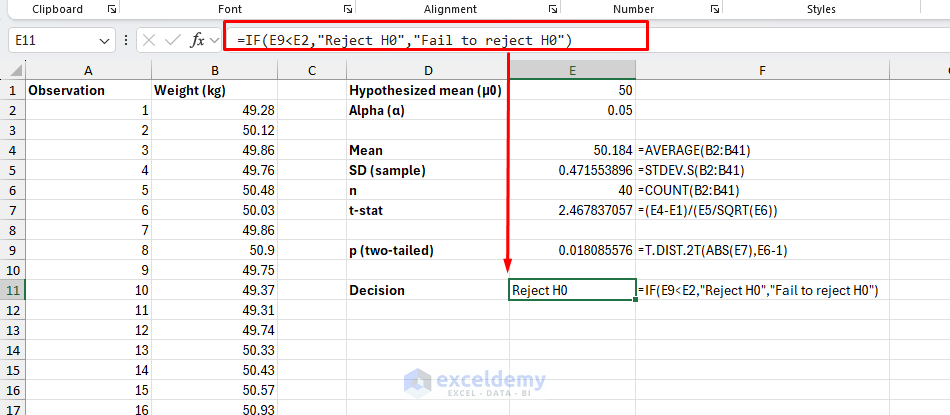
You can use a conditional formula to make a decision:
=IF(E9<E2,"Reject H0","Fail to reject H0")
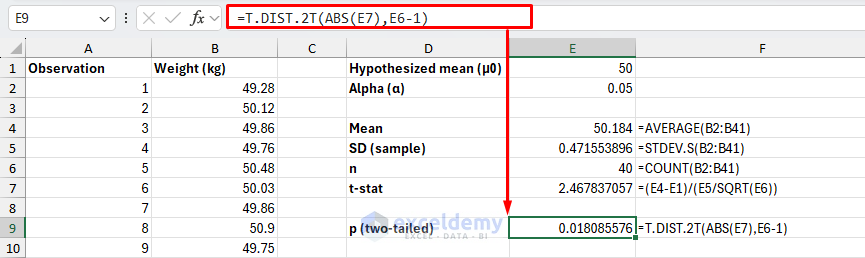
Two-tailed alternative (optional): If H₁ is μ ≠ 50, use =T.DIST.2T(ABS(E8),E6-1).
Interpretation:
- Example: p = 0.0181 < 0.05 → Reject H₀.
- If you reject H₀, the mean is significantly above 50 kg.
Method 2: One-Sample z-Test (Known Population Standard Deviation)
Use a one-sample z-test to compare a sample mean to a known population mean when the population standard deviation (σ) is known. It is most appropriate for large samples (n > 30).
We’ll test whether the average weight is greater than 50 kg with σ = 0.5.
- H₀: μ = 50
- H₁: μ > 50
z-test (one-tailed):
- Select the sample data (e.g., B2:B41).
- Insert the following
Z.TESTformula.
=Z.TEST(B2:B41,E1,E2)
This returns the one-tailed p-value.
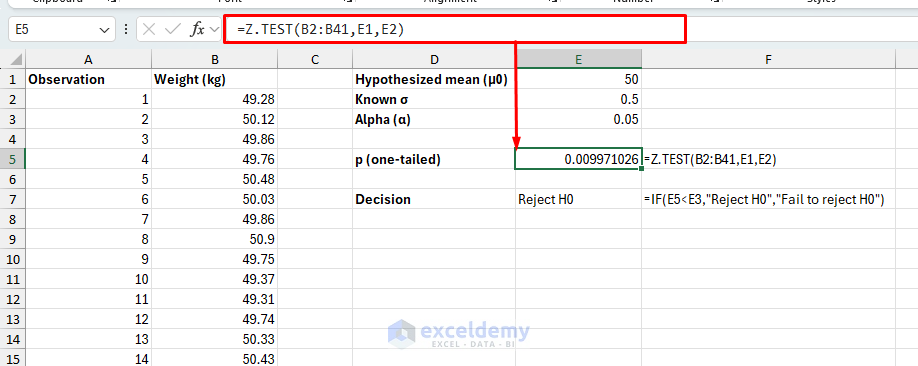
- Decision rule: p = 0.0099 < 0.05 → Reject H₀.
- Interpretation: If you reject H₀, the mean is significantly > 50 kg given σ = 0.5.
z-test (two-tailed):
=2*MIN(E5,1-E5)

Method 3: Two-Sample t-Test (Independent Samples)
Use this to compare means of two independent groups. If the variances are plausibly equal, you can use the equal-variances version; otherwise, prefer the unequal-variances (Welch) option.
Suppose you want to compare the weight changes of Diet Plan A and Diet Plan B.
Steps:
- Go to the Data tab → select Data Analysis → choose t-Test: Two-Sample Assuming Equal Variances → click OK.

- Select ranges:
- Variable 1 Range: Diet Plan A (e.g., A1:A51).
- Variable 2 Range: Diet Plan B (e.g., B1:B51).
- Hypothesized Mean Difference: 0
- Check Labels.
- Alpha: 0.05
- Output Range: Select cell D3.
- Click OK.

You’ll get a summary table including t Stat and P(T ≤ t) two-tail.
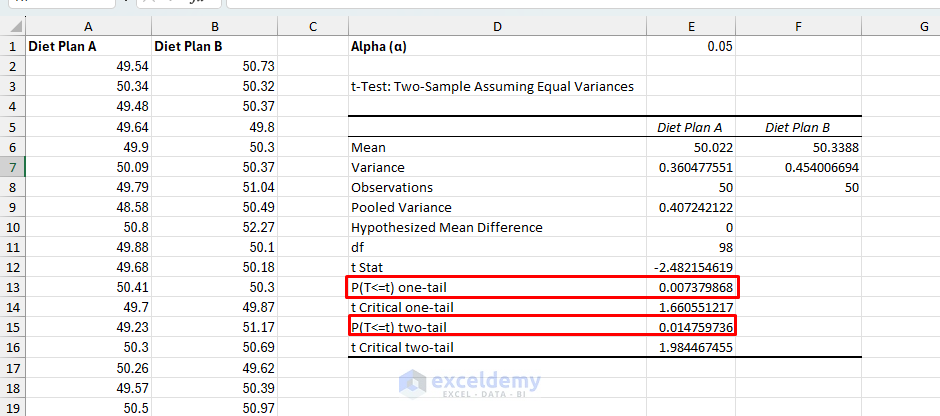
Interpretation:
- If p-value < 0.05 → Reject H₀ (means differ).
- If p-value > 0.05 → Fail to reject H₀ (no difference).
- Example: p-value = 0.0148 < 0.05 → Reject H₀. The difference between Diet Plan A and Diet Plan B is statistically significant.
Method 4: Paired t-Test (Before–After Comparison)
Ideal for comparing means from the same subjects across two conditions (e.g., before/after treatment), accounting for paired dependence.
Let’s measure weights before and after following the diet plan.
Steps:
- Go to the Data tab → select Data Analysis → choose t-Test: Paired Two Sample for Means → click OK.

- Select ranges:
- Variable 1 Range: Before data (e.g., A1:A41).
- Variable 2 Range: After data (e.g., B1:B41).
- Hypothesized Mean Difference: 0
- Check Labels.
- Alpha: 0.05
- Output options: Select a cell.
- Click OK.

Output:

Interpretation:
- p-value: 4.34×10⁻⁹ < 0.05 → Reject H₀ (means differ).
- The “After” values are reliably lower than “Before,” and the drop is not only statistically significant but also substantively large given the paired design.
Method 5: Two-Sample z-Test (Known Variances)
Use this for comparing two large independent samples (n > 30 each) when the population variances are known.
Compare the weights between two diet plans (n = 50 each, known σ₁ = 0.65, σ₂ = 0.8).
Steps:
- Go to the Data tab → select Data Analysis → choose z-Test: Two Sample for Means → click OK.

- Select ranges:
- Variable 1 Range: Diet Plan A (e.g., A2:A51).
- Variable 2 Range: Diet Plan B (e.g., B2:B51).
- Hypothesized Mean Difference: 0
- Variable 1 Variance: 0.65² = 0.4225
- Variable 2 Variance: 0.8² = 0.64
- Check Labels.
- Alpha: 0.05
- Output options: Select cell D6.
- Click OK.

Output:

Interpretation:
- p-value: 0.0297 < 0.05 → Reject H₀.
- There is a statistically significant difference between the average results of Diet Plan A and Diet Plan B when population variances are known.
Data Analysis ToolPak (All Tests in One Place)
If you prefer not to use formulas:
- Go to File → Options → Add-ins → Excel Add-ins → Go → check “Analysis ToolPak”.
- Go to the Data tab → select Data Analysis.
- Choose from:
- t-Test: Paired Two Sample for Means
- t-Test: Two-Sample Assuming Equal Variances
- t-Test: Two-Sample Assuming Unequal Variances
- z-Test: Two Sample for Means

Key Takeaways
- Use t-tests when σ is unknown and z-tests when σ is known.
- Always define H₀, H₁, and α clearly before testing.
- p < 0.05 → statistically significant; reject the null hypothesis.
- Excel’s Data Analysis ToolPak makes hypothesis testing approachable and efficient.
- Combine these with charts and descriptive statistics for better insight.
Download Practice Workbook
Conclusion
This tutorial shows five ways to conduct hypothesis testing in Excel. These methods cover common z- and t-tests in Excel. Always verify assumptions (e.g., normality via histograms, equal variances) and consider statistical software for advanced needs. If p-value < 0.05, the data support the theory; otherwise, you fail to reject the null. These approaches help you rigorously test theories using everyday Excel tools. Practice with the provided datasets to build confidence in drawing data-driven conclusions.
Get FREE Advanced Excel Exercises with Solutions!
