
Image by Editor
Excel is a powerful tool, but add-ins can dramatically enhance its capabilities. For beginners looking to supercharge their spreadsheet experience, these essential add-ins offer value-added features and options that help to streamline the workflow.
In this article, we’ll list 5 essential Excel add-ins for beginners.
How to Install Excel Add-ins
Installing add-ins in Excel is generally simple and follows a standard process. First, download the add-in file, which could be in formats like .xlam, .xla, or .exe. If an installer is provided, run it, or manually install it. Most add-ins follow a similar installation process.
Install Downloaded Add-ins:
- Download the add-in file (.xlam, .xla, or .exe).
- Run the installer if provided.
Install Excel Built-in Add-ins:
- Go to the File tab >> select Options >> select Add-ins.
- From Manage >> select Excel Add-ins >> Click Go.
- Click Browse and locate your downloaded add-in.
- Check the box next to the add-in name.
- Click OK.

After installation, most add-ins will create their own tab in the Excel ribbon for easy access, making them convenient to use.
Built-in Excel Add-ins
Before exploring third-party add-ins, Excel includes powerful built-in tools that many users overlook. These add-ins are free, easy to activate, and can handle a variety of tasks, including statistical analysis, optimization, and data transformation.
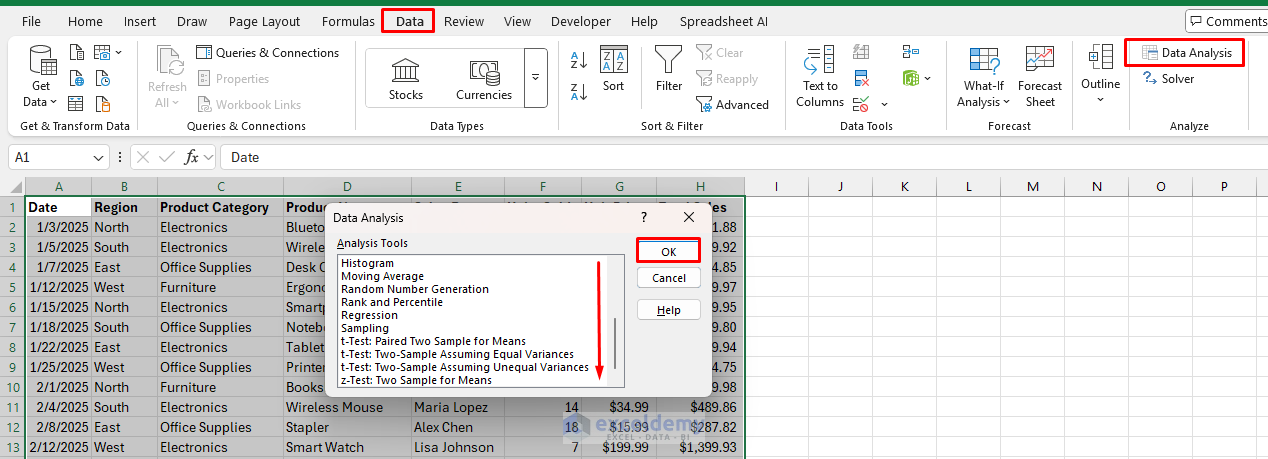
1. Data Analysis ToolPak
The Data Analysis ToolPak is a built-in Excel add-in that provides advanced statistical and analytical tools without requiring complex formula knowledge. After installation, this add-in is accessible from the Data tab, it allows you to perform different analyses.
Key Functionalities:
- Descriptive statistics (mean, median, mode, standard deviation).
- Hypothesis testing (t-tests, z-tests, ANOVA).
- Regression analysis (linear regression, correlation analysis).
- Engineering tools (Fourier analysis, statistical distributions).
Why beginners love it: It’s free, built into Excel, and performs complex analyses with simple dialog boxes, generating comprehensive statistical reports automatically.
2. Solver Add-in
Solver is a powerful optimization tool that helps find the optimal solution to complex problems with multiple constraints and variables. After installation, this add-in is accessible from the Data tab, it allows you to get an optimal solution based on different scenarios.
Key Functionalities:
- Linear and non-linear optimization.
- Integer programming for whole-number solutions.
- Sensitivity, answer, and limit reports.

Why beginners love it: It simplifies complex optimization problems with an easy-to-use visual interface and provides detailed reports explaining solutions.
3. Power Query
Power Query (also known as Get & Transform in newer versions) allows you to import, clean, and transform data from various sources with ease. It provides functionalities such as:
Getting Started (Excel 365 or Later):
- Go to the Data tab >> select Get Data.

Key Functionalities:
- Connects data from 40 different data sources (CSV, SQL databases, SharePoint lists, etc.).
- Offers built-in features to transform data easily.
- Removes duplicates, splits columns, formats data types, and merges queries.
- Automates data cleaning processes and saves steps for future use.

Why beginners love it: It simplifies data cleaning without the need for complex formulas and handles large datasets efficiently. Plus, it’s built into Excel and requires no separate installation.
Third-Party Add-ins
While Excel’s built-in tools are powerful, third-party add-ins can extend functionality further, particularly for advanced statistical analysis and marketing reporting.
4. XLSTAT Cloud
XLSTAT adds powerful statistical analysis capabilities to Excel. After installation, you can access it from the ribbon to run statistical analyses.
Getting Started:
- Go to the Developer tab >> select Add-in.
- Search for XLSTAT >> select XLSTAT >> click Add.

Key Functionalities:
- Descriptive statistics (skewness, kurtosis, box plots, histograms).
- Statistical tests (t-tests, ANOVA, chi-square tests).
- Data modeling (regression analysis, PCA, cluster analysis).
- Advanced charting and visualization tools.

Why beginners love it: XLSTAT offers an intuitive interface that is easy to navigate, provides detailed result interpretations, and creates professional-looking charts and graphs.
5. Supermetrics for Excel
Supermetrics pulls marketing data directly into Excel from various platforms like Google Analytics, Facebook Ads, and social media. It allows you to automate the process of gathering and reporting data from over 70 marketing platforms.
Getting Started:
- Go to the Developer tab >> select Add-in.
- Search for Supermetrics >> select Supermetrics >> click Add.

Key Functionalities:
- Data connectors for Google Analytics, Facebook Ads, LinkedIn Ads, Shopify, and more.
- Query building tools for selecting metrics, dimensions, and custom date ranges.
- Automated report refreshing and data splitting across worksheets.

Why beginners love it: It eliminates the need for manual data gathering, creating automated reports that refresh with a click. Its simple interface allows users to integrate marketing analytics without the need for coding or SQL.
More Essential Add-ins for Beginners
Power Pivot (Free, Built-in for newer Excel versions)
Another useful built-in add-in is Power Pivot, which handles large datasets and allows advanced data modeling and analysis.
Getting started:
- Go to File >> select Options >> select Add-ins.
- From Manage >> select COM Add-ins >> Click Go.
- Check the box for Microsoft Power Pivot for Excel.
- Access it from the Power Pivot tab, import data, and create relationships between tables.

Key Functionalities:
- Creating relationships between tables.
- Handling millions of rows of data efficiently.
- Using DAX (Data Analysis Expressions) for complex calculations.

Kutools for Excel (Paid, Free Trial)
Kutools adds 300+ productivity features in one package. It simplifies everyday Excel tasks.
Getting started:
- Download from kutools.com and follow the installation instructions.
- Install the add-in.
- Access from the dedicated Kutools tab.
- Explore organized feature groups like Content, Format, and View.
- Hover over any button for helpful tooltips explaining the function.
Key Functionalities:
- Workbook management (merge, split, compare).
- Data cleaning and manipulation shortcuts.
- Advanced formatting tools and templates.
- Text manipulation and extraction tools.
Troubleshooting Installation Issues
If you encounter issues with an add-in, try the following:
- Restart Excel if the add-in does not appear.
- Adjust macro security settings (under Trust Center).
- Ensure compatibility with your Excel version.
- Check for missing dependencies like the .NET Framework.
Final Tips for Beginners
To make the most of these add-ins, follow these tips:
- Start with Excel’s built-in add-ins like the Analysis ToolPak, Solver, and Power Pivot before purchasing third-party tools.
- Master one add-in at a time to avoid feeling overwhelmed.
- Use free trials of third-party add-ins to test their functionality before committing.
- Watch tutorial videos and join Excel communities for further learning.
By using these essential add-ins, you’ll be able to expand your Excel capabilities and tackle complex tasks with confidence.
Get FREE Advanced Excel Exercises with Solutions!

Thank you
Hello Tolani,
You are most welcome. Thanks for your feedback, we appreciate it. Keep exploring Excel with ExcelDemy!
Regards
ExcelDemy