Box and Whisker Plot in Excel
Aug 13, 2024
The sample dataset contains Monthly Sales in 2020 and 2021. Instead of showing the 12 sales amounts, 5 values will be used to show the distribution.
...
Aug 5, 2024
What Is a Box and Whisker Plot?
In Excel, a box and whisker plot is a graphical depiction of a dataset's numerical values. It displays the minimum, ...
Nov 11, 2025
A great way of representing statistical data in Excel is by using a box plot. If the data in a data set are interrelated to each other then showing ...
Jun 18, 2024
What is a Box and Whisker Plot?
A box and whisker plot is used to analyze a given dataset's median, quartiles, and max and min values. It has two ...
Jul 7, 2024
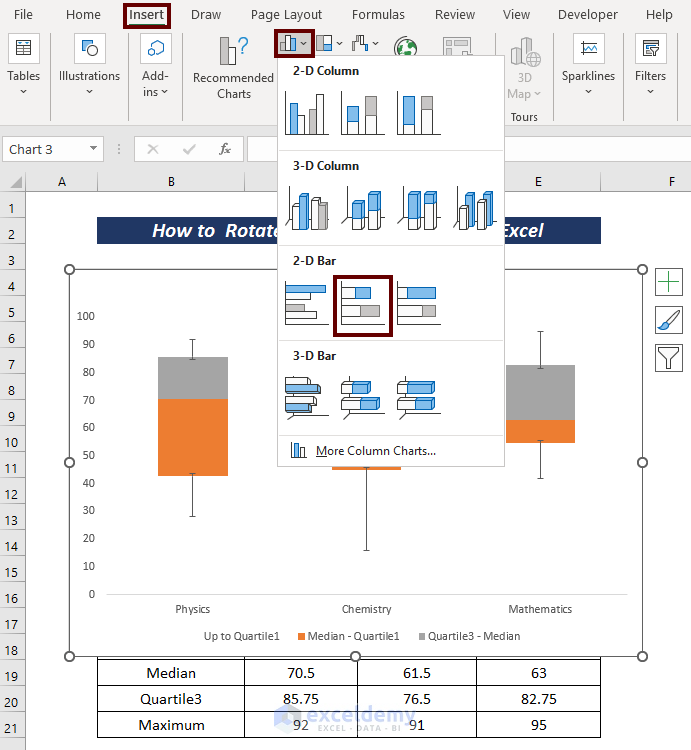
Method 1 - Insert Single Horizontal Box and Whisker Plot in Excel
We'll use the sample dataset below to learn how to make a whisker plot and a ...
Nov 11, 2025
Excel’s Box and Whisker Plot demonstrate the distribution of Quartiles, Median, and Outliers of the assigned dataset. Users often need to make a Box ...
Nov 11, 2025
This tutorial will demonstrate how to make a box plot in Excel. The box plot is another way of presenting statistical data for better visualization. ...