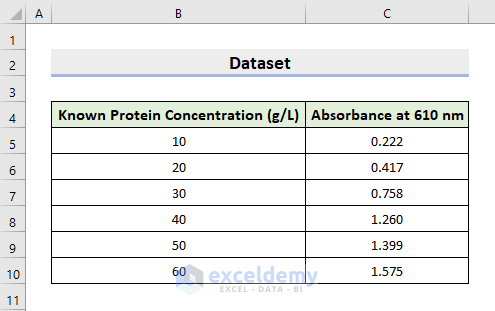
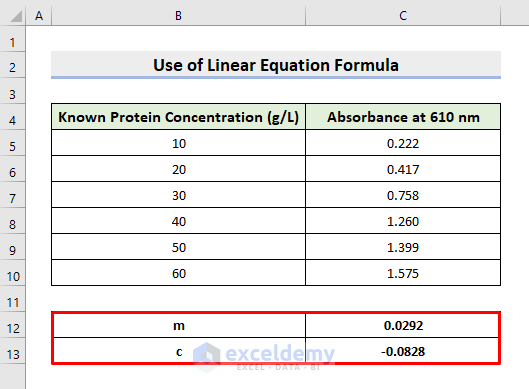
The sample dataset showcases the Known Protein Concentration (g/L) and the Absorbance at 610 nm.
Method 1 – Using a Linear Equation Formula to Determine the Protein Concentration from a Standard Curve in Excel
The formula is:
y = mx + c
STEPS:
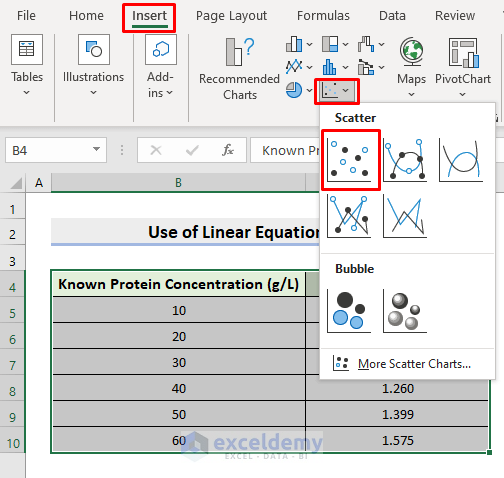
- Select B4:C10.
- Go to Insert ➤ Charts ➤ Scatter.
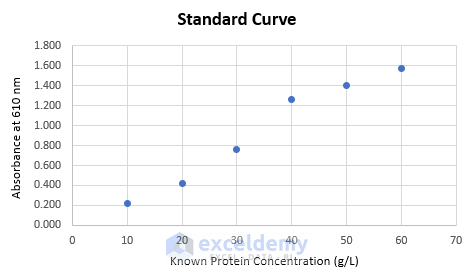
You’ll see the standard curve in the scatter chart:
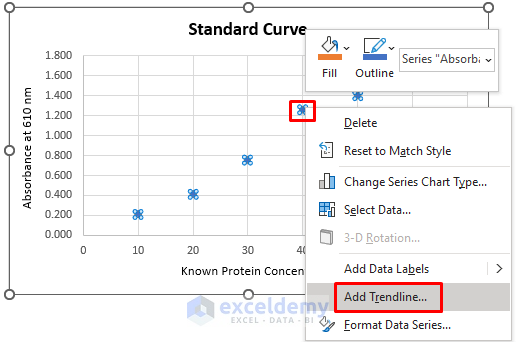
- Double-click a point in the curve.
- Select Add Trendline.
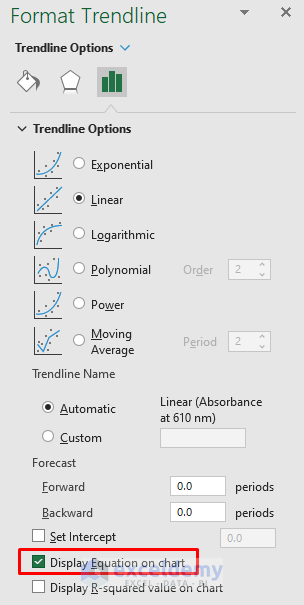
- Double-click the trendline and select Format Trendline.
- Check Display Equation on chart.
You’ll see the trendline with the equation:
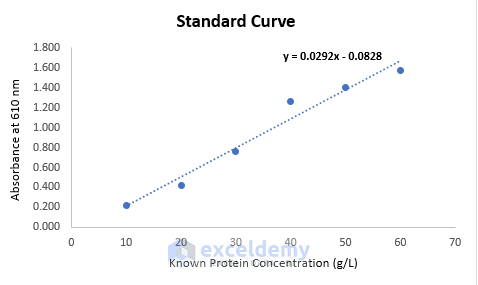
- If you compare the equation in the curve with the linear equation y = mx + c, you get m = 0.0292 and c = -0.0828.
- Enter the values in C12 and C13.
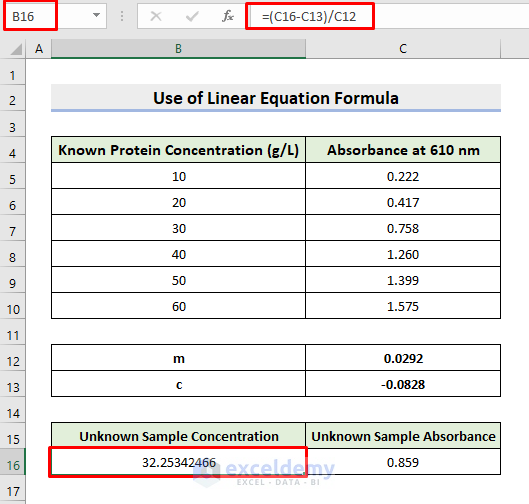
The absorbance of the unknown sample is displayed in C16 (859). It can also be termed y.
- To get the unknown sample concentration or x, use the formula:
x = (y-c)/m- Select B16.
- Use the formula:
=(C16-C13)/C12- Press Enter.
The protein concentration of the unknown sample is displayed.
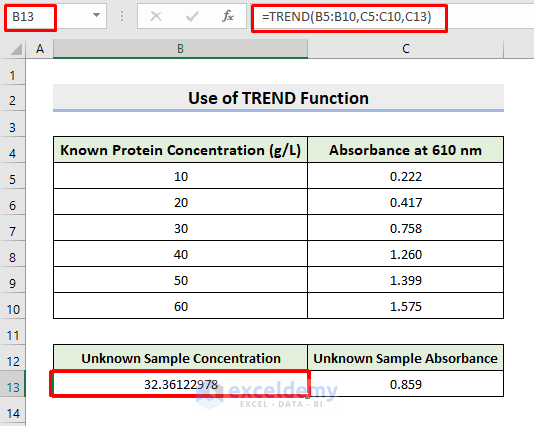
Method 2 – Determine the Protein Concentration from a Standard Curve with the Excel TREND Function
STEPS:
- Select B13.
- Enter the formula:
=TREND(B5:B10,C5:C10,C13)- Press Enter.
This is the output.
Read More: How to Calculate Unknown Concentration from Standard Curve in Excel
Download Practice Workbook
Download the following workbook.
<< Go Back to Excel Standard Curve | Excel Charts | Learn Excel
Get FREE Advanced Excel Exercises with Solutions!

Thank you.
this was the most comprehensive practical in how to set up your excel files.
Hello Karin Williams,
You are most welcome. Thanks for your appreciation, it means a lot to us. We are glad to hear that you found our article most comprehensive. Keep learning Excel with ExcelDemy.
Regards
ExcelDemy