Method 1 – Generating a Standard Curve to Calculate Unknown Concentration in Excel
- Insert a scatter chart for our dataset.
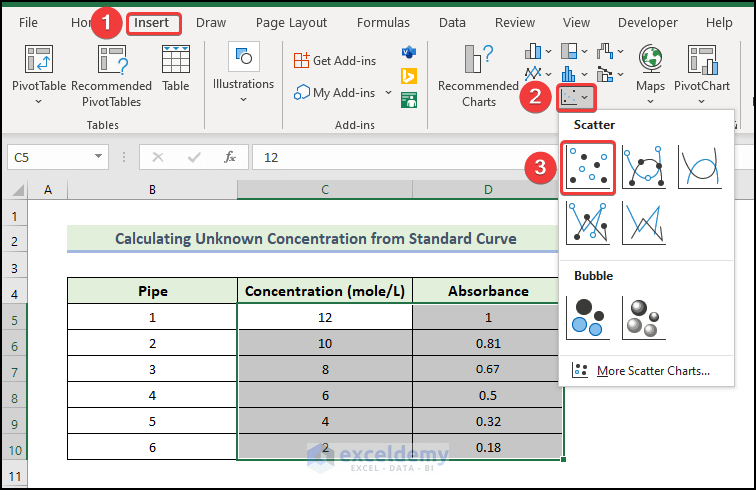
- Select the range of the cells C5:D10.
- In the Insert tab, click on the drop-down arrow of the Insert Scatter (X, Y) or Bubble Chart from the Charts group.
- Choose the Scatter chart.
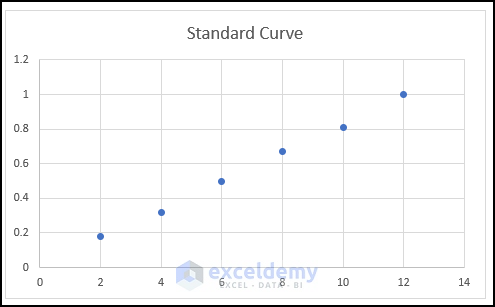
- You will get the following chart.
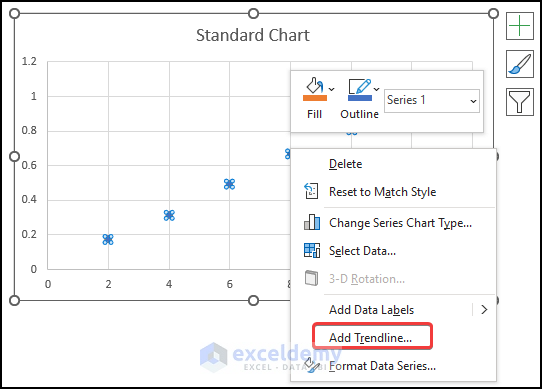
- Select the points in the scatter chart, and right-click on them. Select the Add Trendline option.
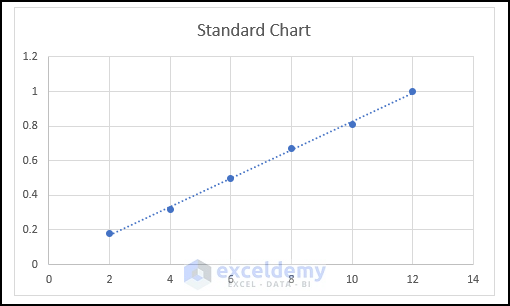
- You will get the following standard chart.
- Add graph elements. In Quick Elements, some elements are already added or removed. But you can manually edit the graph to add or remove any elements of the chart by using the Add Chart Element option.
- After clicking on the Add Chart Element, you will see a list of elements.
- You have to click on them one by one to add, remove, or edit.
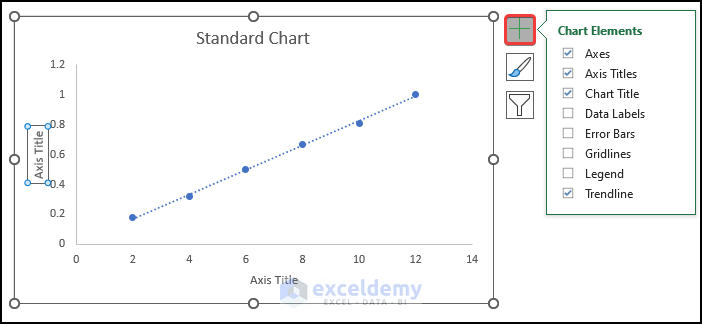
- Find the list of chart elements by clicking the Plus (+) button from the right corner of the chart.
- Mark the elements to add or unmark the elements to remove.
- Find an arrow on the element, where you will find other options to edit the elements.
- Check Axis Titles and uncheck Gridlines.
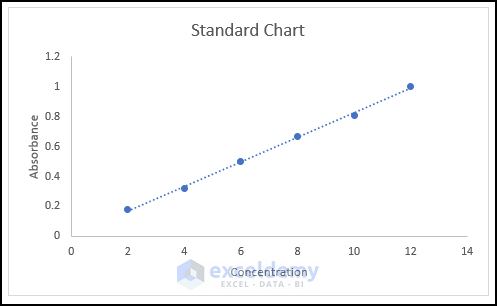
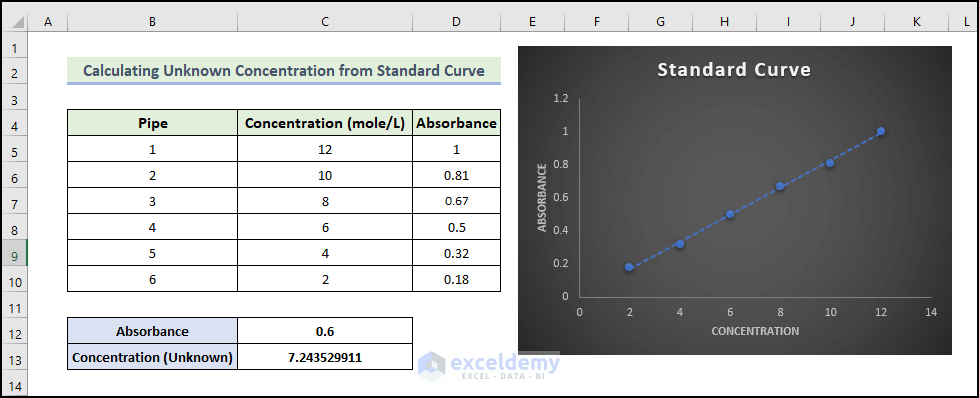
- The standard curve will look like this.
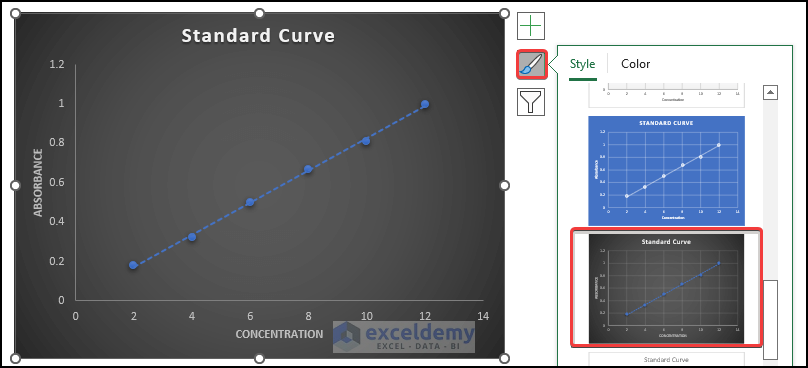
- Modify the chart style, select Chart Design and then, select your desired Style 8 option from the Chart Styles
- Click on the chart, select the Chart Styles icon, and select the chart you want.
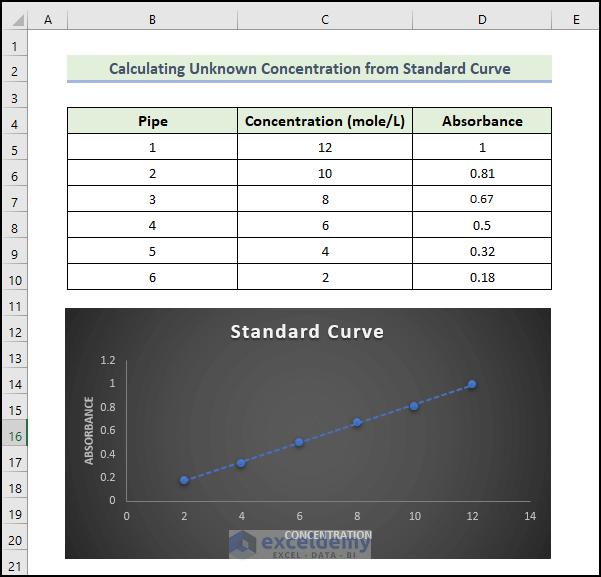
- The standard curve with the dataset will look like this.
Method 2 – Obtain Unknown Concentration from the Standard Curve
- Input the absorbance in cell C12.
- Use the following formula in cell C13:
=TREND(C5:C10,D5:D10,C12)
C5:C12 = known_y’s, dependent y-values.
D5:D12 = known_x’s, independent x-values.
C12 = new_x’s, new x-values to calculate the TREND value for.
- Press Enter.
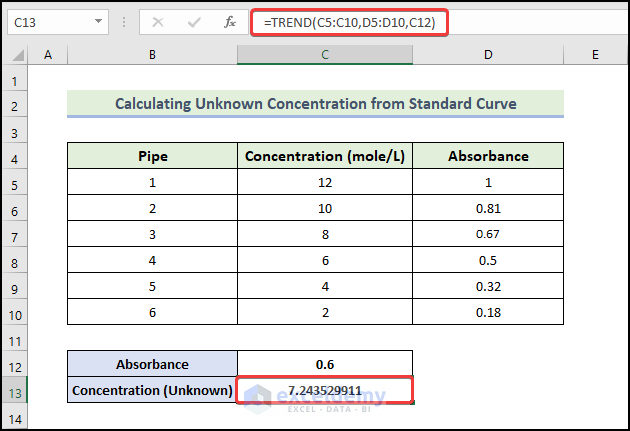
- Calculate an unknown concentration from the standard curve as shown below.
Note:
Whenever the known X and Y values differ in length, the TREND function returns a #REF error.
It is necessary for the known values – known_x’s, known_y’s – to be linear data. It is possible for the predicted values to be inaccurate otherwise.
Things to Remember
✎ Before inserting a scatter chart, you must select anywhere in the dataset. The rows and columns will need to be manually added otherwise.
✎ When the given values of X, Y, and new X are non-numeric, and when the const argument is not a Boolean value (TRUE or FALSE), then the TREND function returns #VALUE! Error.
Download Practice Workbook
Download this practice workbook to exercise while you are reading this article. It contains all the datasets in different spreadsheets for a clear understanding. Try yourself while you go through the step-by-step process.
<< Go Back to Excel Standard Curve | Excel Charts | Learn Excel
Get FREE Advanced Excel Exercises with Solutions!

